HAL Id: hal-02890286
https://hal.inrae.fr/hal-02890286
Submitted on 6 Jul 2020
HAL is a multi-disciplinary open access
archive for the deposit and dissemination of
sci-entific research documents, whether they are
pub-lished or not. The documents may come from
teaching and research institutions in France or
abroad, or from public or private research centers.
L’archive ouverte pluridisciplinaire HAL, est
destinée au dépôt et à la diffusion de documents
scientifiques de niveau recherche, publiés ou non,
émanant des établissements d’enseignement et de
recherche français ou étrangers, des laboratoires
publics ou privés.
Remotely-sensed assessment of the impact of
century-old biochar on chicory crop growth using
high-resolution UAV-based imagery
Ramin Dehkordi, Antoine Denis, Julien Fouché, Victor Burgeon, Jean
Cornelis, Bernard Tychon, Edmundo Placencia Gomez, Jeroen Meersmans
To cite this version:
Ramin Dehkordi, Antoine Denis, Julien Fouché, Victor Burgeon, Jean Cornelis, et al..
Remotely-sensed assessment of the impact of century-old biochar on chicory crop growth using high-resolution
UAV-based imagery. International Journal of Applied Earth Observation and Geoinformation,
Else-vier, 2020, 91, �10.1016/j.jag.2020.102147�. �hal-02890286�
Contents lists available atScienceDirect
Int J Appl Earth Obs Geoinformation
journal homepage:www.elsevier.com/locate/jag
Remotely-sensed assessment of the impact of century-old biochar on chicory
crop growth using high-resolution UAV-based imagery
Ramin Heidarian Dehkordi
a,b,*
, Antoine Denis
a, Julien Fouche
b,c, Victor Burgeon
b,
Jean Thomas Cornelis
b, Bernard Tychon
a, Edmundo Placencia Gomez
d, Jeroen Meersmans
baDepartment of Environmental Sciences and Management, University of Liège, Arlon, Belgium
bTERRA Teaching and Research Centre, Gembloux Agro-Bio Tech, University of Liège, Gembloux, 5030, Belgium cLISAH, Univ Montpellier, INRAE, IRD, Montpellier SupAgro, Montpellier, France
dUrban and Environmental Engineering, University of Liège, Liège, Belgium
A R T I C L E I N F O
Keywords: UAV remote sensing Canopy cover
Multispectral vegetation indices Thermal imagery
Charcoal Soil organic carbon
A B S T R A C T
In recent years, special attention has been given to the long-term effects of biochar on the performance of agro-ecosystems owing to its potential for improving soil fertility, harvested crop yields, and aboveground biomass production. The present experiment was set up to identify the effects on soil-plant systems of biochar produced more than 150 years ago in charcoal mound kiln sites in Wallonia (Belgium). Although the impacts of biochar on soil-plant systems are being increasingly discussed, a detailed monitoring of the crop dynamics throughout the growing season has not yet been well addressed. At present there is considerable interest in applying remote sensing for crop growth monitoring in order to improve sustainable agricultural practices. However, studies using high-resolution remote sensing data to focus on century-old biochar effects are not yet available. For the first time, the impacts of century-old biochar on crop growth were investigated at canopy level using high-resolution airborne remote sensing data over a cultivatedfield. High-resolution RGB, multispectral and thermal sensors mounted on unmanned aerial vehicles (UAVs) were used to generate high frequency remote sensing information on the crop dynamics. UAVs wereflown over 11 century-old charcoal-enriched soil patches and the adjacent reference soils of a chicoryfield. We retrieved crucial crop parameters such as canopy cover, vegetation indices and crop water stress from the UAV imageries. In addition, our study also provides in-situ measurements of soil properties and crop traits. Both UAV-based RGB imagery and in-situ measurements demonstrated that the presence of century-old biochar significantly improved chicory canopy cover, with greater leaf lengths in biochar patches. Weighted difference vegetation index imagery showed a negative influence of biochar presence on plant greenness at the end of the growing season. Chicory crop stress was significantly increased by biochar presence, whereas the harvested crop yield was not affected. The main significant variations observed between reference and century-old biochar patches using in situ measurements of crop traits concerned leaf length. Hence, the output from the present study will be of great interest to help developing climate-smart agriculture practices allowing for adaptation and mitigation to climate.
1. Introduction
In the context of mitigating climate change and adapting to the loss of soil fertility, the application of biochar has been promoted during the last decades as a strategy for sustainably improving the soil hydric status and organic matter contents (e.g. Sohi et al., 2010; Malghani et al., 2013;Stewart et al., 2013;Kerré et al., 2017). Biochar is a solid carbon-rich residue of the pyrolysis of biomass produced in an oxygen-limited environment and amended to soil (e.g. Yamato et al., 2006;
Montanarella and Lugato, 2013;Lehmann and Joseph, 2015;Trupiano
et al., 2017). Biochar can be obtained from a broad range of feedstocks including manure, wood, and crop residues (Trupiano et al., 2017).
Many efforts have been devoted to providing an indication of the fresh biochar effect on soil properties such as soil acidity, nutrient re-tention, and water holding capacity (Biederman and Stanley Harpole, 2013;Lehmann et al., 2003;Glaser et al., 2002). For example,de la Rosa et al. (2014)showed that there is a strong positive relationship between the amount of biochar application and soil water holding ca-pacity (WHC) by studying four types of biochar originating from dif-ferent feedstocks.Glaser et al. (2002)reported that the WHC in terra
https://doi.org/10.1016/j.jag.2020.102147
Received 2 October 2019; Received in revised form 23 April 2020; Accepted 28 April 2020
⁎Corresponding author at: TERRA Teaching and Research Centre, Gembloux Agro-Bio Tech, University of Liège, Passage des Deportes 2, Gembloux, 5030, Belgium.
E-mail address:ramin.heidariandehkordi@uliege.be(R. Heidarian Dehkordi).
Available online 11 May 2020
0303-2434/ © 2020 The Authors. Published by Elsevier B.V. This is an open access article under the CC BY license (http://creativecommons.org/licenses/BY/4.0/).
preta charcoal-enriched soils of the Amazon basin was higher in com-parison to its adjacent reference soils.Abel et al. (2013)also illustrated that biochar could improve the WHC of a sandy soil six months after its application. However, Jeffery et al. (2015) recently indicated that biochar had no significant impact on either the sandy soil WHC or plant available water content in a naturally restored grassland located in Ede (The Netherlands). Similarly, Gray et al. (2014) confirmed no
sig-nificant effects of biochar produced from feedstocks of hazelnut shells and Douglasfir chips on plant available water content in a clay-loam soil in Western Oregon, United States. A recent study bySchneider et al. (2020)reported a higher water content for relict charcoal hearths in the forest area of the Tauersche Forst, Germany for wet conditions versus a lower water content under dry conditions.Major et al. (2010)stated greater nutrient availability, especially in Ca and Mg, in charcoal amended tropical soils of savannas in Colombia; they also demonstrated a higher grain yield for maize for up to at least four years after the application of biochar. The higher nutrient availability (Ca and Mg) was also found in similar charcoal-rich cultivated soils in Wallonia (Hardy et al., 2017a).
A commonly documented impact of biochar is the improvement of aboveground crop biomass productivity. Using a quantitative global-scale approach,Jeffery et al. (2011)found an average increase in crop productivity of 10 % as a result of biochar addition in tropical soils. Similarly,Simon et al. (2017)reported an average crop yield increase of 25 % with biochar application in arable tropical soils, whereas no in-fluence was found in temperate latitudes. Meta-regression analyses showed that crop yield response increases over time after the initial addition of biochar, i.e. an increase of 7 % and 12 % in the second and fourth year post biochar application, respectively (Crane-Droesch et al., 2013).Biederman and Stanley Harpole (2013)reported a significant
positive short-term impact of biochar on aboveground crop pro-ductivity and yield through a comprehensive meta-analysis of 371 in-dependent experiments. Likewise, large short-term yield increases of cow pea were found in Manaus, Brazil, after charcoal amendments to highly weathered tropical soils (Lehmann et al., 2003). However, both short-term agronomical benefits of biochar (few years after the appli-cation) and long-term effects (up to few centuries after appliappli-cation) should be studied. Although, there is a general lack of studies focusing on long-term effect,Hernandez-Soriano et al. (2016)illustrated a long-term impact of biochar with an average increase of 10 % in the aboveground dry biomass of maize by studying 12 different kiln sites within 5 different arable fields in Wallonia, Belgium, during autumn 2014. In contrast, evidence of plant growth diminution as a con-sequence of biochar application has been found in some instances.
Mikan and Abrams (1986)indicated significant growth depression of both white and red oak over the historic charcoal hearth sites of Pennsylvania, United States.Mastrolonardo et al. (2019)also observed that average values of tree ring width (European beech and silver birch) decreased even though soil nutrient status was improved in a silty soil (Belgium). It was argued that biochar addition could inhibit the pro-motion of plant growth as observed with wheat and radish biomass decrease in loamy calcarosol amended with fertiliser taken from Vic-toria, Australia (van Zwieten et al., 2010). Another study byGüereña et al. (2013) has corroborated this reductive impact of biochar in-corporation by reporting no improvement of maize crop growth in fertile temperate soils over a long-term study from 2007 to 2010.
Despite the growing body of literature on biochar incorporation into the soil, accurate monitoring of the observed long-term agronomic ef-fects on crop growth remains largely elusive. Yet, understanding long-term effects in agro-ecosystems is important as long-long-term biochar ac-cumulation in soils significantly impact soil physico-chemical and mi-crobial properties in agricultural fields affected by relic charcoal hearths (Hardy et al., 2017a,b;Hardy et al., 2019). Remote sensing is proposed as an approach to provide detailed information regarding spatial and temporal variations in crop status for precision agricultural monitoring (Gevaert, 2015). In recent decades, numerous satellite
products have been used to support agricultural applications (Mulla, 2013). Although high spatial, spectral, and temporal resolution data needed for precision agriculture applications can currently be obtained from satellite imagery (e.g. Sentinel-1 SAR), optical remotely-sensed data acquisition (e.g. Sentinel-2) is often difficult during growing sea-sons as these periods are often characterized by cloud cover (Gevaert, 2015;Clevers et al., 2017). Moreover, a detailed monitoring of crop dynamics is particularly critical when considering high-value crops to improve decision-making associated with precision crop management at the subfield scale (Zipper and Loheide, 2014). High-resolution air-borne remote sensing data either from low-altitude manned aircrafts or unmanned aerial vehicles (UAVs), has recently been proposed as a way tofill this gap (Xia et al., 2016). It is important to note that the main restriction of UAV-based remote sensing is that its image acquisition is paired with operational costs and efforts, which may therefore reduce the temporal frequency of the UAV imagery as well as limit the size of the monitoring area (Gevaert, 2015).
High-resolution RGB, multispectral and thermal UAV imageries have been widely promoted in recent years because of their ability to provide plant physiology, vegetation characteristics, and crop water status at the canopy scale improving the site-specific decision-making process in a precision agriculture context (Gago et al., 2015;Berni et al., 2009b). Regarding biochar impacts on plant systems, there are no studies available using high-resolution UAV-based data at canopy level over a cultivatedfield enriched with century-old biochar patches. In this study, we will focus on investigating the impacts of century-old biochar enrichment on crop growth at canopy level for thefirst time using UAV imagery.
Airborne RGB and multispectral imageries are capable of providing crucial crop structural parameters like canopy cover and leaf area index (LAI), together with the narrow-band multispectral vegetation indices that provides relevant information about photosynthesis and plant functioning (Gago et al., 2015;Berni et al., 2009b). A new era of UAV-based thermal remote sensing is emerging with the high-resolution modelling of spatially distributed crop water status parameters such as stress or evapotranspiration (Berni et al., 2009a). Deficiency in the plant available water content is defined as the crop water stress (Ihuoma and Madramootoo, 2017), and leads to leaf stomatal closure, reduction of the transpiration rate and the evaporative cooling, and will consequently increase the leaf temperature (Berni et al., 2009a; Zarco-Tejada et al., 2013). Mapping the crop water stress over discontinuous canopies is seen as the benchmark capability of UAV-based thermal remote sensing (Berni et al., 2009a, b). High-resolution UAV-based thermal imagery is able to detect the incidence of water stress by monitoring the canopy temperature with thermal infrared sensors (Berni et al., 2009a;Zarco-Tejada et al., 2013;Gago et al., 2015). Thus, thermal remote sensing is capable of early detection of water scarcity related to drought over agriculturalfields, which are essential features for managing irrigation schedules and various environmental activities (Tanriverdi et al., 2017). Crop water stress is a function of air and ca-nopy temperatures together with the vapour pressure deficit (Bellvert et al., 2014;Gago et al., 2015). The difference between canopy surface temperature (Tc) and air temperature (Ta), is a widely accepted
in-dicator of crop water stress (Jackson et al., 1977;Bellvert et al., 2014;
García-tejero et al., 2016) which can be derived from UAV-based thermal images.
A last important point to address is that crop water stress might be highly affected by topography because soil water content, and hence, the canopy temperature depend on topography, which is a dominant factor influencing hydrological processes such as groundwater flow (Seibert et al., 2006). Therefore, a more specific evaluation of the ca-nopy temperature as a function of biochar presence is of great interest in order to mitigate information redundancy due to the field topo-graphy. Over the past few years, the usage of digital elevation model (DEM)-based topographic indices has gained increasing attention for predicting the spatial distribution of soil moisture, which imposes a
significant ecohydrological impact on the vegetation composition in accordance with the site tendency to receive or evacuate water from up-land and down-up-land areas, respectively (Kopecký andČížková, 2010). The topographic wetness index (TWI) is a well-known terrain derivative that reveals the potential spatial variation of soil wetness and surface saturation conditions (Grabs et al., 2009).
This manuscript describes the impacts of century-old biochar using high-resolution UAV remote sensing data in combination with in situ measurements of soil properties and crop traits. We examined the ef-fects of century-old charcoal-enriched kiln sites, produced from beech and oak forests in Wallonia more than 150 years ago on chicory crop growth. The advanced perspectives of UAV remote sensing for mon-itoring the temporal dynamics of crops affected by century-old biochar enrichment in precision agriculture are addressed.
2. Materials and methods
2.1. Study area
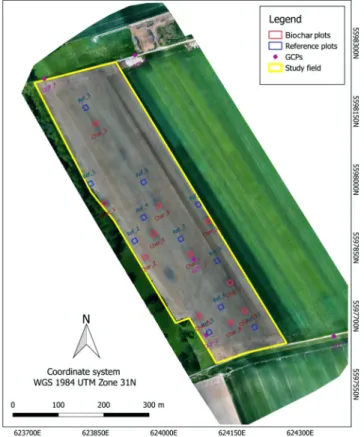
The study area was an agricultural field with chicory (Cichorium intybus subsp. intybus convar. Sativum) of approximately 13 ha located near Isnes (NW corner: 50°31′N 4°44′E; SE corner: 50°31′N 4°45′E), central Belgium. The climate of the area is temperate with dry and hot summers and 30-year (1987–2017) average annual temperature and precipitation of 9.6 °C and 889.42 mm, respectively. Thisfield is com-prised of 13 century-old biochar-enriched patches resulting from his-torical charcoal production in mound kiln sites of oak, hornbeam, beech, and hazel forests dating to more than 150 years ago (for a more detailed description, the reader is referred toHardy et al., 2017b). The century-old biochar-enriched patches are apparent as darker black spots of nearly 25 m diameter (Fig. 1). Apart from these biochar-enriched
patches, the experimentalfield has homogeneous soil conditions: Lu-visol with a silt loam texture in the topsoil. The agricultural practices are homogenous throughout thefield. Eleven 10 m × 10 m plots (red squares inFig. 1) were designed inside the biochar-enriched patches, at least 3 m from the border of each patch in order to avoid gradient ef-fects at the edge of the biochar-enriched patches. The two remaining patches were instrumented for another experiment and hence were not used in the present study. Subsequently, eleven plots of 10 by 10 m (blue squares inFig. 1) were created over adjacent reference soil areas within a distance of approximately 45 m from the biochar-enriched patches in order to prevent the plausible mixing of biochar and re-ference soil particles due to ploughing activities. It is worth mentioning that each biochar-enriched patch was located on the same management strip (NW-SE direction) as the corresponding reference patch to avoid variation in treatment effects between the strips. Five black and white tiles of 65 cm × 65 cm, were deployed throughout the study field (Fig. 1) as ground control points (GCPs) to optimise the geo-referencing and alignment of the acquired UAV images which enables a precise time-series analysis at the pixel-to-pixel level. The centroid coordinates of the GCP targets were determined using a real-time kinematic GPS (RTK-GPS) with∼3 cm horizontal accuracy.
2.2. Statistical analysis
Statistical global and paired t-tests were conducted to examine the influence of century-old charcoal kiln sites on the crop growth. A t-test indicates the statistical significance of the difference between two groups of data assuming the normal distribution of each data set (Kim, 2015). Paired t-tests consider the independence of the pairs which is an important constraint in this study. First, the normality of the observed differences was confirmed using the Shapiro-Wilk normality test (Shapiro and Wilk, 1965). Then, the paired and global t-tests were applied to identify the significance of the observed differences between the pairs of biochar-enriched and reference plots.
It is worth noting that the small number of available observations, i.e. 11 paired sites (reference versus biochar-enriched), did not guar-antee using goodness offit measures such as coefficient of determina-tion (R2) in this study. Therefore, we checked the significance of the
attained R2value between the UAV-based imageries and soil properties
or crop traits using the statistical F-test. We also applied the non-parametric Kendall's rank correlation tau (τ) test which is less sensitive to the small statistical sample size (Kendall, 1938) to further assess the significance of the obtained correlations.
2.3. In situ and laboratory measurements
2.3.1. Soil organic carbon and nitrogen contents
A regular sampling method, comprised of 5 soil subsamples was followed in each of the 22 experimental plots, totalling 110 subsamples over the entirefield on the 11th of October 2018. The subsamples were spatially distributed within each plot in order to better capture the potential intra-plot variability. Initially, five random subsamples per plot were obtained using a hand-held soil auger applied to a reference depth of 10 cm. It should be highlighted that prior to the soil sampling, the soil was ploughed to a depth of nearly 30 cm. Next, thefive sub-samples of each plot were evenly blended together resulting in one composite sample per plot (22 samples for the entirefield). Then, the soil samples were passed through a 2 mm sieve to separate soilfine earth with a minimum quantity of 200 g per sample in order to facilitate the laboratory soil analysis. Prior to the laboratory analysis the samples were oven-dried at 40 °C until they reached a constant weight. The soil samples were analysed for the quantification of organic carbon (ISO 10694:1995, 1995), and total nitrogen (ISO 13878:1998, 1998) con-centrations. Organic carbon and total nitrogen were analysed by dry combustion using the Leco TruMac element analyser.
Fig. 1. The experimental area within the chicoryfield revealing the composi-tion of the 11 pairs of biochar-enriched versus reference plots as well as the location of the ground control points. Century-old biochar-enriched patches are visible as darker black ovals. An RGB orthomosaic image captured by the un-manned aerial vehicle on the 22th May of 2018 is used as the background.
2.3.2. Crop traits
One intention of this study was to observe the variations in bio-physical plant growth indicators, for instance the differences in plant yield, induced by biochar presence in the soil. Non-invasive measure-ments of crop traits were performed on the 15th of June 2018. This dataset assessed the impact of biochar on the leaf length (using a measuring tape) and chlorophyll content (using a hand-held Opti-Sciences CCM-200 chlorophyll content meter) of the chicory crop. The CCM-200 reading represents the chlorophyll content index (CCI) based on the leaf transmittance values of the spectral bands centred at 653 and 931 nm. A regular sampling method of 25 measurements in each of the 22 experimental plots, totalling 550 measurements of leaf length and chlorophyll content were carried out. In this case, each measure-ment was made on the most developed leaf of the plant selected for data acquisition, and the leaves were also visually checked to avoid any potential disease. For each plot, the 25 measurements were spatially distributed over the plot to better represent intra-plot variability. The median of 25 measurements made within each plot (i.e. median used instead of mean in order to avoid the possible bias introduced by out-liers) were used to describe the canopy in each experimental plot.
A set of destructive crop trait measurements were performed on plant roots and leaves. This sampling took place on the 6th and 7th of September 2018, a few days before the harvest date. Destructivefield measurements are usually time-consuming and expensive. As a result, in the destructive sampling campaign three randomly selected rows of 0.5 m length consisting of approximately 10 chicory plants were col-lected in each of the 22 test plots, totalling 66 samples (for nearly 660 plants) for the entirefield. The median of the 10 plants in each plots was used. Fresh weight and yield of leaves were measured in thefield immediately after sampling, leaf dry weight was measured in the la-boratory after oven-drying the leaves at 80 °C until a constant weight was reached in order to compute leaf dry matter content. Similarly, root yield, length, and perimeter at the soil surface level were measured to obtain data as regards root characteristics. A previous study byAbawi (1998) reported that specific soil conditions, such as excess soil moisture or high contents of organic acids (i.e. C/N greater than 30), could induce forking in carrot plants. Therefore, we also measured the number of forks and number of cracks in the collected chicory roots. The hypothesis was that charcoal presence in the soil would reduce the compactness of its particles, thereby becoming highly desirable for root growth and avoiding the possible physiological disorders such as cracking and forking.
2.4. UAV-based imageries
2.4.1. Airborne campaigns and image processing
A total of 13flights were executed over the 2018 growing season (Table 1) using RGB, multispectral and thermal cameras on board of two UAVs. A DJI Phantom 4 Pro (DJI, Nanshan, Shenzhen, China) was
flown over the chicories at 65 m altitude above ground level (AGL) at nadir,field of view (FOV) of 84°, an airspeed of 5 ms−1, with 85 % front and 75 % side image overlaps obtaining 5472 × 3648 pixel RGB images. With these specifications, the resulting ground sampling dis-tance (GSD) was 1.8 cm. We planned DJI Phantom 4 Pro UAVflights using Pix4D capture software (Pix4D S.A., Lausanne, Switzerland).
The second set of UAV images were acquired from a DJI Matrice 100 (DJI, Nanshan, Shenzhen, China), a quadcopter with aflight endurance of 30 min using two TB48D 5700 mA h batteries simultaneously, which was developed to carry the multispectral and thermal sensors con-currently. The multispectral sensor used was a MicaSense RedEdge-M integrated with MicaSense downwelling light sensor (MicaSense, Seattle, WA, USA) with five discrete narrow bands comprising blue (475 nm centre wavelength, 20 nm bandwidth), green (560 nm, 20 nm), red (668 nm, 10 nm), red-edge (717 nm, 10 nm), and near-infrared (840 nm, 40 nm). The FLIR Vue Pro Radiometric thermal imager (640 × 412 pixels, 13 mm lens, and 9 Hz frequency) with spectral re-sponse in the range of 7.5–13 μm was used together with the FLIR GPS geo-tagger (FLIR, Oregon, USA) to conduct the thermal imagery. The UAVflight path of DJI Matrice 100 was planned using Atlas Flight software (MicaSense, Seattle, WA, USA). Theflight altitude was set at 60 m AGL, an airspeed of 7 ms−1, and with 75 % forward and sideways image overlap resulting in a spatial resolution of 3.7 cm and 7 cm for multispectral and thermal images, respectively. Neither multispectral nor thermal data were acquired before July 2018 (Table 1) since the Matrice 100 platform was developed at the end of June 2018.
Acquired RGB images were processed using Pix4Dmapper photo-grammetric software (Pix4D S.A., Lausanne, Switzerland). The proces-sing chain includes: (i) aerial triangulation and geometric correction using the ground control point coordinates obtained from the DGPS to assign the high accuracy geo-coordinate system to the photogrammetric block, (ii) construction of the dense point cloud and mesh, (iii) ortho-rectification of the images, and (iv) derivation of the digital surface model (DSM) along with the RGB orthomosaic (Fig. 2).
Likewise, the multispectral imagery was processed using Pix4Dmapper software following the same photogrammetric processing chain. MicaSense calibrated reflectance panels with known reflectance values (MicaSense, Seattle, WA, USA) were captured immediately be-fore and after eachflight. Therefore, the radiometric calibration chain used the calibration coefficients of the reflectance panels along with the ISO values recorded by the downwelling light sensor (DLS) to convert the raw image digital number (DN) to the calibrated reflectance values (Fig. 2).
Thermal images were initially geo-tagged during the UAVflights using the integrated FLIR GPS geo-tagger. The brightness temperature values were translated to the land surface temperature (LST) through the FLIR UAS application (FLIR, Oregon, USA) and Pix4Dmapper by applying the local recorded air temperature, humidity, and emissivity values. The same photogrammetric alignment and geometric correction was applied using the coordinates of the GCPs to generate the high-resolution temperature index maps over the study site (Fig. 2).
2.4.2. RGB canopy cover
The ratio of the pixels covered by vegetation to the total number of ground pixels, named the canopy cover, is a widely used biophysical indicator of the crop growth stage in remote sensing-based environ-mental applications (Trout et al., 2008;Johnson et al., 2012). In the present study, the canopy cover was derived from the high-resolution UAV-based RGB orthomosaic image, with the GSD of 1.8 cm, which enables the accurate classification of the study area into vegetation and non-vegetation pixels. For all the pixels within the orthomosaic image we calculated the difference between the spectral response of the green band and the corresponding values of the blue and red channels as follows:
[(DNgreen- DNblue) =α] and [(DNgreen- DNred) =β] (1)
Table 1
An overview of the unmanned aerial vehicleflights over the year 2018. Flight times are provided in local time.
Date UAV imagery
Month Day RGB Multispectral Thermal
April 19 11h — — May 09 11h — — 22 10h — — June 05 12h — — 15 11h — — 22 11h — — July 05 10h 12h 12h 13 10h 13h 13h 24 10h 12h — August 07 — 12h 12h
where DNblue,DNgreen, and DNredrepresent the digital numbers (DNs) of
the blue, green and red parts of the visible spectrum, respectively. This classification equation was established using the fact that the spectral signature of vegetation reveals a slight peak in the green band of the electromagnetic spectrum compared to the blue and red spectral channels (Parece and Campbell, 2015). Pixels with bothα and β greater than 20 were classified as vegetation since this threshold yielded the best vegetation clustering results from the visual inspection (Fig. 2).
2.4.3. Multispectral vegetation indices
Several narrow-band vegetation indices were calculated from the multispectral imagery to examine whether the impact of biochar on the crop performance could be captured by the high-resolution UAV-based multispectral remote sensing. Table 2summarises the vegetation in-dices evaluated in this research. The normalised difference vegetation index (NDVI) (Rouse Jr et al., 1974) was determined to indicate the vegetation coverage within the study plots following:
NDVI = (RNIR– Rred) / (RNIR+ Rred) (2)
where Rredand RNIRare the processed reflectance values of the red and
near-infrared spectral bands of the MicaSense RedEdge-M sensor, re-spectively.
It is generally assumed that the normalised difference vegetation index (NDVI) provides a robust indication of photosynthetic activity as well as vegetation greenness (Rouse et al., 1974;Schmidt and Karnieli, 2001), since vegetation has the highest rates of absorption and
reflec-tion in the red and NIR bands, respectively. However, there are further merits of using NDVI to retrieve pure vegetation and soil pixels due to the fact that the index is highly sensitive to soil brightness and back-ground effects, as was raised byHuete (1988)andSchmidt and Karnieli (2001). To address such background effects, the weighted difference vegetation index (WDVI) developed by Clevers (1989) was further computed based on Eq. (3). WDVI explicitly considers that the ratio between NIR and red reflectance values over the bare soil is constant and also independent of soil moisture content (Clevers, 1989).
WDVI=RNIR– a.Rred (3)
where a is the slope of soil line which can be derived as the ratio of the NIR to red band reflectance values over the bare soil; Rred and RNIR are the reflectance values in the red and near-infrared portions of spectrum, respectively.
Clevers (1989)concluded that the WDVI is an appropriate index for most soil types. Moreover, WDVI is less sensitive to the saturation of the chicory leaves, as opposed to NDVI, when the crop is at the end of its growth stage. As a result, UAV-based WDVI could lead to a better se-paration of soil and vegetation pixels than NDVI imagery. Therefore, WDVI was used instead of NDVI to create a multispectral based vege-tation mask. It is worth mentioning that we were interested in evalu-ating the plant healthiness as well as vegetation greenness as a function of biochar presence and hence only the vegetation pixels were
monitored in the multispectral analysis. First, a threshold of WDVI higher than 0.45 was applied to the WDVI imagery with 3.7 cm GSD to extract the so-called true canopy pixels in which the pixels are entirely covered by vegetation. This threshold provided the best vegetation mask according to the visual inspection. Second, the obtained WDVI-based vegetation mask was used to remove the soil pixels from the determined vegetation indices. Apart from the two above-mentioned structural indices, three chlorophyll indices (Table 2) were also com-puted to perform a detailed analysis of the information provided by UAV-based multispectral imagery. Similar to the structural indices, the created WDVI-based mask layer was used to remove the soil pixels from the multispectral analysis of the retrieved chlorophyll indices.
2.4.4. Crop water stress and Topographic wetness index modelling Meteorological data was retrieved from a local automated weather station situated in the middle of the studyfield. Meteorological data was recorded as 30 min averages, including air temperature, pre-cipitation, wind speed and direction, relative humidity, and solar ra-diation. First, the computed RGB-based vegetation mask (Section2.4.2) was resampled to the spatial resolution of the thermal images using the nearest neighbour algorithm in order to retrieve the true canopy pixels from the thermal imagery. Then, the air temperature recorded by the local weather station at the UAV overpass time (Table 1) was used to determine the implemented Tc– Taindex as the crop water stress
in-dicator. It is important to highlight that the developed Matrice 100 platform at 60 mflight altitude enabled the thermal image acquisition to cover the entirefield in approximately 30 min, and hence, a constant value of air temperature was used to model Tc– Tafor each recording
date. All the thermal flights were executed around noon (Table 1) which is the optimum time to obtain thermal imageries in order to avoid the shaded leaves and variability of stomatal closure in leaf water status (Bellvert et al., 2014). Moreover, the sky condition was clear with no clouds over the studyfield during the thermal acquisitions. To assess the case where a complete impact of biochar on the crop water stress over the entire growing season is available, we computed the mean Tc–
Tavalue of the three monitoring dates (Table 1).
Traditional topographic wetness index (T-TWI) and system for au-tomated geoscientific analyses wetness index (SAGA WI) are the most widely applied algorithms in advanced geographic information systems (GIS) software packages such as Quantum GIS (QGIS) for modelling the topographic wetness index based on remote sensing inputs (Kopecký andČížková, 2010;Aksoy et al., 2016). TWI was computed as (Aksoy et al., 2016):
TWI=ln [α / tan(β)] (4)
whereα is the local contributing drainage area that reflects the ten-dency of waterflow from upslope and β is the angle of the local to-pographic slope in radians.
Aksoy et al. (2016)illustrated that SAGA WI generates more rea-listic estimates of the topographic wetness index than T-TWI with Fig. 2. Methodologicalflowchart to assess the impact of biochar on soil-plant systems.
respect to SAGA modified catchment surface determinations. Therefore, SAGA WI was used in the present study to model the topographic wetness index over the studyfield. For this, the RGB flight on the 9th of May 2018 (Table 1) was executed over the entirely bare soil ground following a so-called double grid pattern consisting of perpendicular flight lines with 85 % frontal and 75 % side overlap in order to capture the highest terrain discrepancies in terms of topography elements. The obtained DSM from the UAV imagery over the bare soilfield is equal to a digital terrain model (DTM) that only reflects the terrain surface to-pography.
It is worth drawing attention to the fact that both current versions of T-TWI and SAGA WI are dedicated to moderate and high spatial re-solution satellite remote sensing inputs ranging from 30 to 0.5 m. As a result, very high-resolution UAV-based DTM image (spatial resolution of 1.8 cm in the current study) would lead to noisy TWI patterns in the outcome of the SAGA WI modelling approach. In other words, the higher resolution the inputs are, the noisier the outcome is. Thus, the acquired DTM from the UAV imagery was initially pre-processed to smooth abnormal alterations in the elevation map caused by noisy micro-topographic details. Pre-processing of the UAV-based DTM was carried out using a rectangular 3 × 3 low-pass focal-modal digitalfilter (corresponding to 5.4 × 5.4 m) with a relatively higher power on the rows than the columns due to the fact that the major tractor driving paths, as the main source of the micro-topography changes in elevation, were apparent vertically within the studyfield. Next, the primary to-pographic attributes (i.e. slope, aspect, and curvature) were derived from the post-processed DTM and were fused in SAGA WI to model secondary topographic derivatives such as the topographic wetness index over the test area.
We used a multivariable function based on the UAV-based thermal and TWI imageries to mitigate the impact of topography on the canopy temperature as follows:
Tc(TWI corrected) (i) = Tc(i)– [f (TWI) (i) – Tc(TWI median) (i)]
(5) where Tc (TWI corrected) is the retrieved pure canopy temperature
while mitigating the topography impact, Tcis the pure canopy
tem-perature after removing the soil background pixels, f (TWI) is the re-gression function of Tcbased on TWI imagery considering all the
re-ference and biochar-enriched plots, Tc(TWI median) is the predicted
canopy temperature for a given value of TWI which is the median value of TWI imagery combining all the experimental pairs, and index i re-presents the experimental plots.
It is worth noting that the aforementioned thermal amendment was applied separately for each acquisition date. As such, the identified linear regressionfits between TWI and Tc- Tafor each acquisition date
were used to mitigate the impact of topography on the crop water stress and the corrected Tc- Tavalues were calculated. Finally, we computed
the mean corrected Tc - Tavalues of the three thermal acquisitions
(Fig. 2).
3. Results and discussion
3.1. Soil organic carbon and nitrogen contents
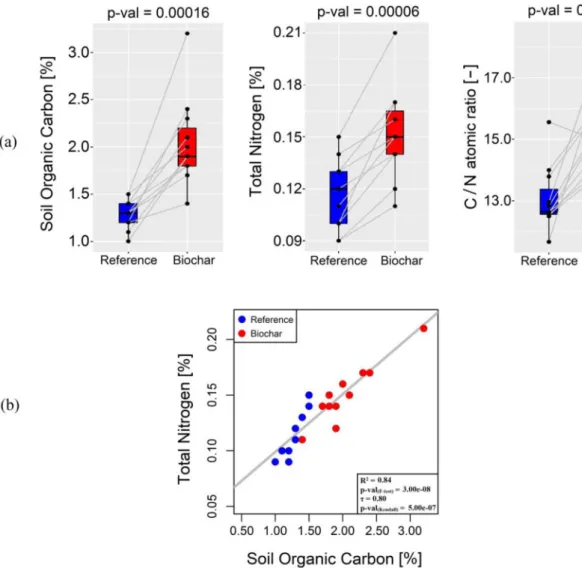
The biochar-enriched sites were found to be characterized by sig-nificantly higher soil organic carbon (SOC) and nitrogen contents (Fig. 3a), which was also reported byBiederman and Stanley Harpole (2013)andde la Rosa et al. (2014). More specifically, the largest effect
was observed in the total nitrogen content (i.e. t-test p-value = 0.00006) with a median total nitrogen content for the biochar-enriched soils of 0.15 % (expressed as grams of N per 100 g of dry soil (gN/100 g)) compared to 0.12 % for the reference soils. Moreover, (SOC) content is 1.9 % (gC/100 g) for the biochar-enriched soils, whereas this is only 1.3 % for the reference soils (which is significantly
Table 2 Vegetation indices investigated in the present study. Abbreviation Index name Formulation Indication Reference NDVI normalized di ff erence vegetation index (R NIR – Rred )/( RNIR +R red ) Structural index, photosynthetic activity and vegetation greenness (Rouse Jr et al., 1974) WDVI weighted di ff erence vegetation index WDVI = RNIR – a.R red with a = (R NIR /R red ) of the soil Crop physiological traits ( Clevers, 1989 ) NDRE normalized di ff erence red edge index (R NIR – Rrededge )/ (R NIR +R rededge ) Crop nitrogen concentration ( Siegmann et al., 2012 ) CI-red chlorophyll index red (R NIR /R red ) -1 Canopy chlorophyll and biomass (Similar to Clevers et al., 2017 ) s-CCCI simpli fi ed canopy chlorophyll content index NDRE / NDVI Canopy chlorophyll (Similar to Fitzgerald et al., 2006 )
different with a p-value = 0.0001). Also the atomic SOC to total ni-trogen ratio (C/N) was significantly higher (p-value = 0.0007) in the biochar-enriched soils (15.7) as compared to the reference soils (12.6). Consequently, SOC was strongly correlated with total nitrogen when considering all the reference and biochar-enriched plots (R2= 0.84, p-value(F-test)= 3.00e-08) as shown in Fig. 3c (Kendall's τ
coeffi-cient = 0.80, p-value(Kendall)= 5.00e-07).
3.2. Crop traits
The results of the non-destructive crop trait measurements taken on the 15th of June 2018, are presented inFig. 4a. Chicory leaf length was significantly different with 26 ± 1.72 cm in the reference plots and 30 ± 1.58 cm for the biochar-enriched plots (p-value = 0.00040). All the biochar-enriched plots reported longer chicory leaves than the corresponding reference plots, except for plot 2 where the leaf length was equal (28 cm) for both biochar-enriched and reference plots. In contrast, the chlorophyll content was not significantly different (p-value = 0.619) between treatments (Fig. 4a).
Fig. 4b-c shows a comprehensive overview of the destructive in situ measurements. In light of the weak statistical differences (p-value > 0.1) obtained for all the examined plant biophysical parameters, no
significant influence of biochar can be illustrated. The biochar chicory leaves exhibited a median yield value of 26.62 ± 5.56 t.ha−1, versus 26.40 ± 4.31 t.ha−1for the reference leaves, resulting in a paired t-test p-value of 0.1. The leaf dry matter content revealed no statistical dif-ference between treatments (p-value = 0.24). This slight promotion of the aboveground productivity as a consequence of biochar presence is in line with several previous studies (Major et al., 2010; Hernandez-Soriano et al., 2016;Kerré et al., 2017).
Chicory root perimeter, length, and yield were not significantly different between the reference and biochar-enriched plots (p-value = 0.36, p-(p-value = 0.41, and p-(p-value of 0.34 respectively). These results differ from the total root mass increase of maize observed by
Yamato et al. (2006). Discrepancies in the physiological disorder of chicory roots, either potential forking or cracking caused by biochar presence, were not observed (Fig. 4c).
3.3. UAV-based indices
3.3.1. RGB canopy cover
First, the canopy cover of the eleven experimental pairs (Fig. 1) was evaluated. Fig. 5a shows the temporal profiles of the canopy cover percentage for the biochar-enriched plots in comparison to the Fig. 3. (a) Comparison of soil organic carbon (SOC), total nitrogen, and C/N atomic ratio between the reference and biochar-enriched plots following the statistical paired t-test. The horizontal black line represents the median value, surrounded by box edges presenting the 25th and 75th percentiles. The black circles represent the experimental plots of each pair and the grey line between the points compares the corresponding reference and biochar-enriched plots of each pair. (b) Relationship between soil total nitrogen (y-axis) and soil organic carbon (x-axis) for all the 11 experimental pairs, the blue and red circles represent the reference and biochar-enriched plots, respectively and the grey line indicates the linear regressionfit. (For interpretation of the references to colour in this figure legend, the reader is referred to the web version of this article).
reference plots. The canopy cover displayed greater values in biochar-enriched plots over the green-up phase, except for plots 8 and 10. The area under the curve (AUC) of the canopy cover yielded a significant statistical difference (p-value = 0.00032) between the biochar-enriched and reference plots (Fig. 5b). In addition, the global T-test of the AUC-canopy cover confirmed a significant positive impact of biochar pre-sence on the crop growth (p-value = 0.00038) counting the entire da-taset regardless of the other potential effects. This finding is in ac-cordance with the positive growth of maize observed byKerré et al. (2017)who also studied relict charcoal hearths in Belgium.
As stated before, the destructive in situ dataset was collected on the 6th and 7th of September 2018 at the end of the growing season and a few days prior to the harvesting period. The analysis of the UAV-based canopy cover indicated that it is worthwhile to pay more attention to the plant biophysical indicators during the green-up phase in order to have a better assessment of the impact of biochar on the crop growth. However, a more detailed evaluation is needed to completely evaluate the biochar amendment feedback in this regard. We recommend de-veloping further sampling schemes that account for the temporal effects associated with phenology. High frequency sampling schemes would also help to provide a better interpretation of the results.
Delta area under the curve (AUC) of canopy cover exhibited no linear relationship with delta SOC (Fig. 6a). Similar to the delta SOC results, the UAV-based canopy cover showed no relationship with delta total nitrogen, nor with C/N atomic ratio (Fig. 6b-c).
To assess the cause of these weak relationships, the key assumptions related to the design of the experimental plots were examined. Looking at the scatterplots (Fig. 6a–c), one plot (plot 3) displayed the highest
value of delta AUC of canopy cover with a low delta SOC that did not align with the other pairs. We split the data into delta AUC of canopy cover and delta SOC. Plot 3 was detected as an outlier based on the median absolute deviation test of delta AUC of canopy cover. In addi-tion, one plot (i.e. plot 1) showed the highest value in delta SOC while having a low delta AUC of canopy cover (Fig. 6a–c). Subsequently, plot
1 was detected as an outlier through the median absolute deviation test of delta SOC.
To investigate whether the detected outliers closely matched the real field constraints, we specifically focused on the location of the experimental plots along with the SOC and nitrogen contents of the soil samples. Although plot 1 revealed the highest delta SOC, the impact of charcoal presence on the canopy cover growth was not of particular concern which is likely due to the presence of shadows from the ad-jacent trees located in the west of thefield (Fig. 1) and the associated impacts on the soil moisture. Also, plot 1 measurements may have been affected by litter fall of these trees (Schwendenmann, 2015). It is worth mentioning that high-resolution UAV-based DSM imagery indicated that pairs 1 and 3 are the only experimental pairs which are situated in the part of the studyfield where the slope is towards the northwest (image not shown) which may reduce the likelihood of facing the sun illumination. In addition, the TWI imagery showed its twofirst highest values in biochar-enriched plot 1 (TWI = 9.02) and biochar-enriched plot 3 (TWI = 6.79) indicating high soil moisture potentials in the de-tected outliers.
After removing these two outliers, delta SOC yielded a linear re-lationship (Fig. 6d) with delta AUC of canopy cover (R2of 0.48 and
p-value(F-test)= 0.038). The obtained correlation was statistically
Fig. 4. Impact of biochar presence on the biophysical plant growth parameters for non-destructive leaf structural traits on the 15th of June 2018 (a), destructive measurements of leaves (b) and roots (c) on the 6th and 7th of September 2018. The statistical significance of the difference for each parameter is expressed as the p-value of the paired t-test. The horizontal black line represents the median p-value, surrounded by box edges presenting the 25th and 75th percentiles. The black circles represent the experimental plots of each pair and the grey line between the points compares the corresponding reference and biochar-enriched plots of each pair.
significant (Kendall's τ coefficient = 0.55, p-value(Kendall)= 0.044).
Delta soil total nitrogen displayed a non-significant but still fairly clear relationship (R2= 0.40, p-value
(F-test)= 0.066) with the delta AUC of
canopy cover when the outliers were omitted (Fig. 6e). The obtained correlation was statistically significant (Kendall's τ coefficient of 0.4, p-value(Kendall)= 0.014). In contrast, no significant relationship was
found between delta AUC of canopy cover and delta C/N atomic ratio (p-value(F-test)= 0.277) (Fig. 6f).
3.3.2. Multispectral vegetation indices
The impact of biochar presence on the narrow-band multispectral vegetation indices (as given inTable 2) for the four recording dates in July and August is presented inTable 3. In general, no significant dif-ference of the vegetation indices was observed between the biochar-enriched and reference plots (p-value > 0.1). Concerning the WDVI imagery, the significant p-values obtained from the paired t-test to-wards the end of the growing season, confirmed that the influence of biochar presence can be captured by the UAV-based WDVI imagery. Comparisons of WDVI imagery between the reference and biochar-en-riched plots for the four multispectral recording dates are shown in
Fig. 7. Significant differences were observed between reference and
biochar-enriched plots in the last two acquisitions at the end of July (p-value = 0.09647) and in August (p-(p-value = 0.00931). It is worth noting that the observed WDVI differences were normally distributed allowing the use of a statistical paired t-test (plots not shown). Nevertheless, the rest of the selected narrow-band vegetation indices were highly affected by the crop saturation at the maturity stage and were not able to il-lustrate alterations associated to biochar presence.
Biochar showed a negative influence (lower median values of WDVI in Fig. 7) on crop status in terms of health and greenness over the maturity phase using multispectral imagery. Moreover, the rest of the
examined multispectral vegetation indices corroborated this negative effect of biochar on crop spectral information for each recording date (graphs not shown). The negative impact of biochar presence is more significant in August as leaves gradually lost their greenness and began yellowing (Table 3). Thisfinding contrast with the positive impact of biochar presence on the evolution of crop canopy cover measured by RGB imagery (Section3.3.1). However, in the present study a detailed evaluation of how biochar could have affect crop health in the senes-cence phase is still missing. And as such, future research focusing on how multispectral information, gathered during this critical phase of the season, could be used to support sustainable agricultural manage-ment is highly favourable.
Noting the aforementioned caveats, we were interested in testing whether the observed discrepancies in the UAV-based WDVI imagery (Fig. 7) could be explained by the different SOC and total nitrogen
concentrations between the paired plots. Comparison of UAV-based WDVI and laboratory measurements of SOC and nitrogen contents for all the experimental plots exhibited no-significant correlations (Fig. 8a–c). After removing the two identified outliers (i.e. plots 1 and 3), the relationship between delta AUC of WDVI and delta SOC im-proved (R2= 0.21, p-value(F-test)= 0.100; Kendall's τ
coeffi-cient = 0.43, p-value(Kendall)= 0.111) as presented in Fig. 8d.
Simi-larly, the relationship between delta AUC of WDVI and delta total nitrogen slightly improved when the outliers were omitted (R2= 0.18,
p-value(F-test)= 0.251; Kendall's τ coefficient = 0.28,
p-va-lue(Kendall)= 0.291) as shown inFig. 8e, though the improvement was
not significant. In addition, there was still no significant relationship between delta AUC of WDVI and delta C/N atomic ratio without con-sidering the outliers (Fig. 8f). Normalized difference red edge (NDRE) index allows the estimation of canopy nitrogen concentration (Siegmann et al., 2012). However, the result indicated no correlation Fig. 5. (a) Temporal evolution of canopy cover for the 11 pairs of chicory plots (biochar versus reference) within the study area. Image detail comparing the canopy cover between the reference and biochar-enriched plot 3 on the 5th of June 2018. (b) Box plot representation of the area under the curve of the canopy cover graphs. The horizontal black line represents the median value, surrounded by box edges presenting the 25th and 75th percentiles. The black circles represent the experi-mental plots of each pair and the grey line between the points compares the corresponding reference and biochar-enriched plots of each pair. (For interpretation of the references to colour in thisfigure legend, the reader is referred to the web version of this article).
between delta AUC of NDRE and delta total nitrogen (plots not shown). Interestingly, the relationships between delta area under the curve of UAV-based WDVI and measured SOC and total nitrogen contents were negative (Fig. 8). This result indicated that biochar presence de-creases the plant health and greenness over the maturity phase, whereas there was a positive impact of biochar on crop growth during the green-up phase (Fig. 6).
3.3.3. Crop water stress and topographic wetness indices
The data recorded by the local meteorological station in the ex-perimentalfield reported an extremely warm period (daily mean tem-perature of 18.5 °C) with rainfall close to zero from the beginning of July until mid-August that season (pers. comm. V. Burgeon). The wes-tern part of the experimentalfield is clearly less water stressed (Fig. 9a).
This is a consequence of the tall trees in the vicinity of thefield, whose shadows were visible in the west of the experimentalfield (Fig. 1). The presence of shadows likely increased the crop evaporative cooling mechanism in the western part of the experimental field. A higher stressed zone is located in the middle of thefield (Fig. 9a).
In addition,Fig. 9a highlights close similarities between the maps of the topographic wetness index on the 9th of May 2018 and mean crop water stress index. The south-western corner of thefield, which had the highest rate for topographic wetness index, remained low in crop water stress index throughout the entire season. The associated map of mean crop water stress index (computed from the three thermal acquisitions) yielded a negative linear relationship with TWI map (R2= 0.40,
p-va-lue(F-test)= 0.001) considering all the experimental plots (Fig. 9a). The
obtained correlation was statistically significant (Kendall's τ coeffi-cient = 0.40, p-value(Kendall)= 0.008).
There was no notable effect of century-old biochar on topographic wetness index (p-value = 0.302) (Fig. 9b). The paired t-test of corrected mean crop water stress index indicated that biochar presence increased the mean crop water stress index from 4.6 °C in the reference plots to 5.0 °C for the biochar-enriched plots (Fig. 9b), although the observed difference was not statistically significant (p-value = 0.779). This in-crease of 0.4 °C could be attributed to the fact that the soil surface of the biochar-enriched plots is darker compared to the reference plots. This finding is in accordance with previous studies byJeffery et al. (2015)
andGray et al. (2014)who documented that biochar addition did not Fig. 6. Relationship between delta area under the curve of the unmanned aerial vehicle-based canopy cover time-series (y-axis) with delta soil organic carbon, delta total nitrogen, and delta C/N atomic ratio (x-axis) for all the 11 experimental pairs with (a-c) and without (d-f) considering the outliers. Delta is the computed difference between the reference and biochar-enriched plots of each pair. The black circles and triangles represent the soil samples and the detected outliers, respectively. The green line indicates the linear regressionfit. In (d), (e), and (f) the outliers are excluded from the regression fits. (For interpretation of the references to colour in thisfigure legend, the reader is referred to the web version of this article).
Table 3
P-value results of the statistical paired t-test for the narrow-band vegetation indices derived from the unmanned aerial vehicle-based multispectral imagery.
Index NDVI WDVI NDRE CI_Red CCCI
Date
July 5 0.064 0.512 0.575 0.065 0.949
July 13 0.326 0.359 0.817 0.346 0.890
July 24 0.572 0.096 0.579 0.637 0.681
Fig. 7. The effectiveness of the weighted difference vegetation index in describing the impact of biochar presence on the radiometric information provided by the unmanned aerial vehicle-based multispectral imagery at the maturity phase. The horizontal black line represents the median value, surrounded by box edges presenting the 25th and 75th percentiles. The black circles represent the experimental plots of each pair and the grey line between the points compares the corresponding reference and biochar-enriched plots of each pair.
Fig. 8. Relationship between delta area under the curve of the unmanned aerial vehicle-based weighted difference vegetation index time-series (y-axis) with delta soil organic carbon, delta total nitrogen, and delta C/N atomic ratio (x-axis) for all the 11 experimental pairs with (a-c) and without (d-f) consideration of the outliers. Delta is the computed difference between the reference and biochar-enriched plots of each pair. The black circles and triangles represent the soil samples and the detected outliers, respectively. The green line indicates the linear regressionfit. (For interpretation of the references to colour in this figure legend, the reader is referred to the web version of this article).
affect the plant available water content. However, our result cannot entirely rule out the previous evidence of higher soil and plant available water content as a consequence of biochar presence (Glaser et al., 2002;
Abel et al., 2013;de la Rosa et al., 2014;Kerré et al., 2017) due to the
limited number of thermal acquisitions throughout the season in the present study.
There was no significant relationship between delta SOC and delta topographic wetness index with or without considering the outliers (p-(caption on next page)
value(F-test)of 0.110 and 0.217, respectively)(Fig. 9c–d). We repeated a
similar exercise with the corrected crop water stress index values based on TWI imagery to study the isolated impact of biochar on crop water stress (Fig. 9c–d). Delta SOC exhibited a strongly significant relation-ship with delta mean corrected crop water stress index (R2= 0.71,
p-value(F-test)= 0.001). The achieved correlation was slightly significant
(Kendall'sτ coefficient = 0.47, p-value(Kendall)= 0.048). In this context,
it is worth mentioning that the attained relationship was weaker when the two identified outliers (i.e. plots 1 and 3) were omitted (R2
= 0.52, p-value(F-test)= 0.028; Kendall's τ coefficient = 0.43,
p-va-lue(Kendall)= 0.111) as shown inFig. 9c–d. The identified positive
re-lationship between delta SOC and delta crop water stress underlines the previousfinding ofSchneider et al. (2020)who concluded that biochar leads to lower available water contents under dry conditions. However, it is important to bear in mind that characterization of the soil pore size distribution is needed in order to draw conclusions as regards this kind of effects (Atkinson et al., 2010;Minasny and McBratney, 2018).
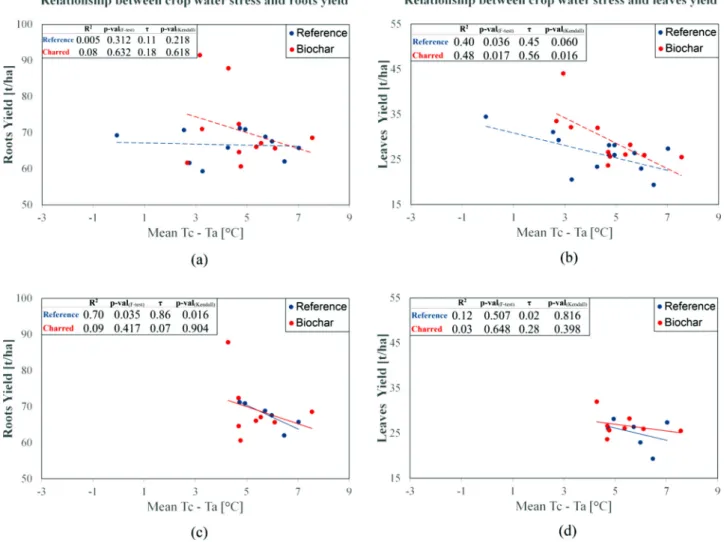
There was no significant relationship between mean crop water stress index and root yields for neither the reference plots nor the biochar-enriched plots (p-value(F-test)of 0.312 and 0.632, respectively)
(Fig. 10a). However, the reference plots characterized by the higher water stress values (the six identified blue circles inFig. 10c) showed a strong negative relationship with root yields (R2= 0.70, p-value (F-test)= 0.035). The obtained correlation was statistically significant
(Kendall'sτ coefficient of 0.86, p-value(Kendall)= 0.016). However, the
higher stressed biochar-enriched plots exhibited no significant re-lationship with root yields (p-value(F-test)= 0.417) (Fig. 10c).
On the other hand, leaf yield was strongly associated with the mean crop water stress index of all the reference plots (Kendall'sτ coefficient of 0.45, p-value(Kendall)= 0.060) as well as all the biochar-enriched
plots (Kendall'sτ coefficient of 0.56, p-value(Kendall)= 0.016) as shown
inFig. 10b. In contrast, no significant relationship was found between
leaf yield and mean crop water stress index in the higher stressed plots, neither for the reference nor the biochar sites (p-value(F-test) of 0.507
and 0.648, respectively) (Fig. 10d).
Our results showed that the presence of biochar did not increase the harvested crop yield, neither roots or leaves yield, under the stressed conditions (Fig. 10). Thisfinding is in contradiction withKerré et al. (2017)who reported an increased yield of maize along with a reduced water stress across three charcoal-enriched plots under similar pedo-logical and climatic conditions.
The main objective of this research was to assess the long-term ef-fects of biochar on crop growth, using high-resolution UAV-based re-mote sensing data, which may support climate-smart agriculture prac-tices in the context of adaptation and mitigation to climate change. Until now many studies have explored the potential of biochar in maintaining soil organic matter and soil water holding capacity, en-hancing soil fertility, reducing crop water stress, and improving crop productivity through quantitative meta-analysis (e.g. Jeffery et al., 2015). This paper presented a proof of concept of using UAV-based imageries in evaluating the effects of century-old biochar on crop growth and crop water stress in combination with in situ and laboratory measurements.
4. Conclusion
We highlighted a significant impact of century-old biochar on a soil-plant system based on UAV imageries. The assessment performed here focused on the temporal dynamics of chicory crop growth curves using RGB imagery. We concluded a detectable positive impact of biochar on chicory canopy cover during the growing season. UAV-based multi-spectral imagery underlined the negative influence of biochar on crop greenness using narrow-band vegetation indices, especially WDVI over the maturity period. It was verified that high-resolution UAV-based remote sensing can aid our understanding of the crop dynamics throughout the growing season which might be difficult with tradi-tionalfield work.
In summary, biochar seems to slightly reinforce leaf length over the growing season as measured by in situ data. Biochar effects on root biophysical traits such as root length or yield were not perceptible.
Despite the hypothesis that biochar could increase the soil water retention, as would be the case in most wet conditions, century-old biochar in our study significantly increased the crop water stress at the end of the growing season derived from the UAV-based thermal ima-geries. In addition, it was found that topographic elements such as the topographic wetness index could contribute to the imposed crop stress levels towards the growing season. Future studies should evaluate how well these results can be generalised explicitly considering the actual field conditions.
To our knowledge this is thefirst paper to investigate the impact of century-old biochar on crop growth by remote sensing technology. The proposed approach using high spatial and temporal resolution UAV imagery is only suitable for monitoring single small sizefields in the order of a few hectares. Further investigation should repeat the same tests across a wider range of crops and under contrasting weather conditions. Use of manned aircrafts or satellite images (e.g. Sentinel-2 and TripleSat) could bridge this gap of knowledge thanks to theirfine spatial and temporal characteristics.
Author statement
RHD and AD conceived and designed the experiments. RHD per-formed thefield and laboratory measurements together with AD, VB, JF, and EPG. RHD processed and analysed the data with assistance from AD, JF, and JM. BT, JM, and JTC managed the project administration and funding acquisition. JTC led the coordination of CHAR project. RHD wrote the manuscript. RHD, AD, VB, JF, JTC, and JM contributed to the editing of the manuscript. RHD revised the manuscript with as-sistance from all other co-authors. All authors contributed to the con-ceptualization of this work.
Declaration of Competing Interest
None.
Acknowledgments
This research was conducted within the framework of the CHAR Fig. 9. (a) Map of mean crop water stress index (mean Tcanopy– Tair) computed from the three thermal acquisitions along with the topographic wetness index (TWI) map on the 9th of May 2018 over the studyfield. Relationship between mean crop water stress index (y-axis) and TWI (x-axis), the blue and red circles represent the reference and biochar-enriched plots, respectively and the grey line indicates the linear regressionfit. (b) Box plots represent topographic wetness index as wells as mean corrected crop water stress index after applying TWI amendment. The horizontal black line represents the median value, surrounded by box edges presenting the 25th and 75th percentiles, the black circles represent the experimental plots of each pair and the grey line between the points compares the corresponding reference and biochar-enriched plots of each pair. (c-d) Relationship between delta soil organic carbon (SOC) (x-axis) with delta topographic wetness index as well as delta mean corrected crop water stress index (y-axis) for all the 11 experimental pairs with (c) and without (d) inclusion of the outliers, delta is the computed difference between the reference and biochar-enriched plots of each pair, the black circles and triangles represent the soil samples and the detected outliers, respectively and the green line indicates the linear regressionfit. (For interpretation of the references to colour in this figure legend, the reader is referred to the web version of this article).
project at the University of Liège. The research was funded through the ARC grant 17/21-03 for Concerted Research Actions,financed by the French Community of Belgium. The authors acknowledge the land-owner, Alexandre Godfrind, who provided access to hisfield. Thanks also to Sarah Garre, Frederic Nguyen, Catherine Timmermans, and Aurore Houtart for their technical support as the member of CHAR project. We also express our sincere gratitude to all the people who helped us with the field campaigns. At last, we thank the editor and anonymous reviewers for their constructive and insightful re-commendations.
References
Abawi, G., 1998. Project Reports 1998 J L Y L Integrated Pest Management. pp. 14456. Abel, S., Peters, A., Trinks, S., Schonsky, H., Facklam, M., Wessolek, G., 2013. Impact of biochar and hydrochar addition on water retention and water repellency of sandy soil. Geoderma 202–203, 183–191.https://doi.org/10.1016/j.geoderma.2013.03. 003.
Aksoy, H., Ozgur Kirca, V.S., Burgan, H.I., Kellecioglu, D., 2016. Hydrological and Hydraulic Models for Determination of Flood-Prone and Flood Inundation Areas 373. IAHS-AISH Proc. Reports, pp. 137–141. https://doi.org/10.5194/piahs-373-137-2016.
Bellvert, J., Zarco-Tejada, P.J., Girona, J., Fereres, E., 2014. Mapping crop water stress index in a‘Pinot-noir’ vineyard: comparing ground measurements with thermal re-mote sensing imagery from an unmanned aerial vehicle. Precis. Agric. 15, 361–376.
https://doi.org/10.1007/s11119-013-9334-5.
Berni, J.A.J., Zarco-Tejada, P.J., Sepulcre-Cantó, G., Fereres, E., Villalobos, F., 2009a. Mapping canopy conductance and CWSI in olive orchards using high resolution thermal remote sensing imagery. Remote Sens. Environ. 113, 2380–2388.https://
doi.org/10.1016/j.rse.2009.06.018.
Berni, J.A.J., Zarco-Tejada, P.J., Suárez, L., Fereres, E., 2009b. Thermal and narrowband multispectral remote sensing for vegetation monitoring from an unmanned aerial vehicle. IEEE Trans. Geosci. Remote Sens. 47, 722–738.https://doi.org/10.1109/ TGRS.2008.2010457.
Biederman, L.A., Stanley Harpole, W., 2013. Biochar and its effects on plant productivity and nutrient cycling: a meta-analysis. Gcb Bioenergy 5, 202–214.https://doi.org/10. 1111/gcbb.12037.
Clevers, J.G.P.W., 1989. The application of a weighted infrared-red vegetation index for estimating leaf area index by correcting for soil moisture. Remote Sens. Environ. 29, 25–37.https://doi.org/10.1016/0034-4257(89)90076-X.
Clevers, J.G.P.W., Kooistra, L., van den Brande, M.M.M., 2017. Using Sentinel-2 data for retrieving LAI and leaf and canopy chlorophyll content of a potato crop. Remote Sens. 9, 1–15.https://doi.org/10.3390/rs9050405.
Crane-Droesch, A., Abiven, S., Jeffery, S., Torn, M.S., 2013. Heterogeneous global crop yield response to biochar: a meta-regression analysis. Environ. Res. Lett. 8.https:// doi.org/10.1088/1748-9326/8/4/044049.
de la Rosa, J.M., Paneque, M., Miller, A.Z., Knicker, H., 2014. Relating physical and chemical properties of four different biochars and their application rate to biomass production of Lolium perenne on a Calcic Cambisol during a pot experiment of 79 days. Sci. Total Environ. 499, 175–184.https://doi.org/10.1016/j.scitotenv.2014.08. 025.
Fitzgerald, G.J., Rodriguez, D., Christensen, L.K., Belford, R., Sadras, V.O., Clarke, T.R., 2006. Spectral and thermal sensing for nitrogen and water status in rainfed and ir-rigated wheat environments. Precis. Agric. 7, 233–248.https://doi.org/10.1007/ s11119-006-9011-z.
Gago, J., Douthe, C., Coopman, R.E., Gallego, P.P., Ribas-Carbo, M., Flexas, J., Escalona, J., Medrano, H., 2015. UAVs challenge to assess water stress for sustainable agri-culture. Agric. Water Manag. 153, 9–19.https://doi.org/10.1016/j.agwat.2015.01. 020.
García-tejero, I.F., Costa, J.M., Egipto, R., Durán-zuazo, V.H., Lima, R.S.N., Lopes, C.M., Chaves, M.M., 2016. Thermal data to monitor crop-water status in irrigated Mediterranean viticulture. Agric. Water Manag. 176, 80–90.https://doi.org/10. Fig. 10. Relationship between mean crop water stress index (mean Tc– Ta) computed from the three thermal acquisitions and in situ yield measurements of roots and leaves for all the 11 experimental pairs (a and b) as well as for only the higher stressed plots (c and d). The blue and red circles represent the reference and biochar plots respectively. The dashed and solid lines represent the linear regressionfits considering all the experimental plots and only the higher stressed plots, respectively. (For interpretation of the references to colour in thisfigure legend, the reader is referred to the web version of this article).