HAL Id: hal-01281190
https://hal.inria.fr/hal-01281190
Submitted on 13 Apr 2016
HAL is a multi-disciplinary open access
archive for the deposit and dissemination of
sci-entific research documents, whether they are
pub-lished or not. The documents may come from
teaching and research institutions in France or
abroad, or from public or private research centers.
L’archive ouverte pluridisciplinaire HAL, est
destinée au dépôt et à la diffusion de documents
scientifiques de niveau recherche, publiés ou non,
émanant des établissements d’enseignement et de
recherche français ou étrangers, des laboratoires
publics ou privés.
Social Clicks: What and Who Gets Read on Twitter?
Maksym Gabielkov, Arthi Ramachandran, Augustin Chaintreau, Arnaud
Legout
To cite this version:
Maksym Gabielkov, Arthi Ramachandran, Augustin Chaintreau, Arnaud Legout. Social Clicks: What
and Who Gets Read on Twitter?. ACM SIGMETRICS / IFIP Performance 2016, Jun 2016, Antibes
Juan-les-Pins, France. �hal-01281190�
Social Clicks: What and Who Gets Read on Twitter?
Maksym Gabielkov
INRIA-MSR Joint Centre, Columbia University
[email protected]
Arthi Ramachandran
Columbia University[email protected]
Augustin Chaintreau
Columbia University[email protected]
Arnaud Legout
INRIA-MSR Joint Centre
[email protected]
ABSTRACT
Online news domains increasingly rely on social media to drive traffic to their websites. Yet we know surprisingly lit-tle about how a social media conversation mentioning an online article actually generates clicks. Sharing behaviors, in contrast, have been fully or partially available and scruti-nized over the years. While this has led to multiple assump-tions on the diffusion of information, each assumption was designed or validated while ignoring actual clicks.
We present a large scale, unbiased study of social clicks— that is also the first data of its kind—gathering a month of web visits to online resources that are located in 5 leading news domains and that are mentioned in the third largest social media by web referral (Twitter). Our dataset amounts to 2.8 million shares, together responsible for 75 billion po-tential views on this social media, and 9.6 million actual clicks to 59,088 unique resources. We design a reproducible methodology and carefully correct its biases. As we prove, properties of clicks impact multiple aspects of information diffusion, all previously unknown. (i) Secondary resources, that are not promoted through headlines and are responsible for the long tail of content popularity, generate more clicks both in absolute and relative terms. (ii) Social media at-tention is actually long-lived, in contrast with temporal evo-lution estimated from shares or receptions. (iii) The actual influence of an intermediary or a resource is poorly predicted by their share count, but we show how that prediction can be made more precise.
1.
INTRODUCTION
In spite of being almost a decade old, social media con-tinue to grow and are dramatically changing the way we access Web resources. Indeed, it was estimated for the first time in 2014 that the most common way to reach a Web
site is from URLs cited in social media1. Social media
ac-count for 30% of the overall visits to Web sites, which is
1http://j.mp/1qHkuzi
Publication rights licensed to ACM. ACM acknowledges that this contribution was authored or co-authored by an employee, contractor or affiliate of a national govern-ment. As such, the Government retains a nonexclusive, royalty-free right to publish or reproduce this article, or to allow others to do so, for Government purposes only.
SIGMETRICS ’16, June 14 - 18, 2016, Antibes Juan-Les-Pins, France
ACM ISBN 978-1-4503-4266-7/16/06. . . $15.00
DOI:http://dx.doi.org/10.1145/2896377.2901462
higher than visits due to organic search results from search engines. However, the context and dynamics of social media referral remain surprisingly unexplored.
Related works on the click prediction of results of search engines [21] do not apply to social media referral because they are very different in nature. To be exposed to a URL on a search engine, a user needs to make an explicit request, and the answer will be tailored to the user profile using be-havioral analysis, text processing, or personalization algo-rithms. On the contrary, on social media, a user just needs to create a social relationship with other users, then he will automatically receive contents produced by these users. At a first approximation, a web search service provides pull based information filtered by algorithms and social media provide a push based information filtered by humans. In fact, our results confirm that the temporal dynamics of clicks in this case is very different.
For a long time, studying clicks on social media was hin-dered by unavailability of data, but this paper proves that
today, this can be overcome2. However, no sensitive
individ-ual information is disclosed in the data we present. Using multiple data collection techniques, we are able to jointly study Twitter conversations and clicks for URLs from five reputable news domains during a month of summer 2015. Note that we do not have complete data on clicks, but we carefully analyze this selection bias and found that we col-lected around 6% of all URLs, and observed 33% of all clicks. We chose to study news domains for multiple reasons de-scribed below.
First, news are a primary topic of conversation on social
media3, as expected due to their real time nature. In
partic-ular, Twitter is ranked third behind Facebook and Pinterest in total volume of web referral traffic, and often appears sec-ond after Facebook when web users discuss their exposure
to news1. Knowing which social media generates traffic to
news site is important to understand how users are exposed to news.
Second, diffusion of news are generally considered highly influential. Political opinion is shaped by various editorial messages, but also by intermediaries that succeed in
gener-2Like any social media studies, we rely on open APIs and
search functions that can be rendered obsolete after policy changes, but all the collection we present for this paper fol-low the terms of use as of today, and the data will remain persistently available. http://j.mp/soTweet
3For instance, more than one in two American adult reports
using social media as the top source of political news, which is more than traditional network such as CNN [22].
ating interest in such messages. This is also true for any kind of public opinion on subjects ranging from a natural disaster to the next movie blockbusters. Knowing who re-lays information and who generates traffic to news site is important to identify true influencers.
Last, news exhibit multiple forms of diffusion that can vary from a traditional top-down promotion through head-lines to a word-of-mouth effect of content originally shared by ordinary users. Knowing how news are relayed on social media is important to understand the mechanisms behind influence.
This paper offers the first study of social web referral at a large scale. We now present the following contributions.
• We validate a practical and unbiased method to study
web referral from social media at scale. It leverages URL shorteners, their associated APIs, in addition to multiple social media search APIs. We identify four sources of biases and run specific validation experi-ments to prove that one can carefully minimize or cor-rect their impact to obtain a representative joint sam-ple of shares/receptions/clicks for all URLs in various online domains. As an example, a selection bias leads to collecting only 6.41% of the URLs, but we validate experimentally that this bias can be entirely corrected. (Section 2)
• We show the limitations of previous studies that
ig-nored click conversion. First, we analyze the long-tail content popularity primarily caused by the large num-ber of URLs mentioned that are not going through official headline promotions and show their effect to be grossly underestimated: those typically receive a
minority of the receptions4, indeed almost all of them
are shared only a handful of times, and we even show a large fraction of them generate no clicks at all, some-times even after thousands of receptions. In spite of this, they generate a majority of the clicks, highlight-ing an efficient curation process. In fact, we found evidence that the number of shares, ubiquitously dis-played today on media’s web presence to indicate pop-ularity, appears an inaccurate measure of actual read-ership. (Section 3)
• We show that that clicks dynamics reveal the attention
of social media to be long-lived, a significant fraction of clicks by social media referrals are produced over the following days of a share. This stands in sharp con-trast with social media sharing behavior, previously shown to be almost entirely concentrated within the first hours, as we confirm with new results. An ex-tended analysis of the tail reveals that popular content tend to attract many clicks for a long period of time, this effect has no equivalent in users’ sharing behavior. (Section 4)
• Finally we leverage the above facts to build the first
analysis of URL or user influence based on clicks and Clicks-Per-Follower. We first validate our estimation, show it reveals a simple classification of information intermediaries, and propose a refined influence score motivated by statistical analysis. URLs and users in-fluence can be leveraged to predict a significant
frac-4See Section 2.1 for definition.
tion of future social media referral, with multiple ap-plications to the performance of online web services. (Section 5)
2.
MEASURING SOCIAL MEDIA CLICKS
Our first contribution is a new method leveraging features of social media shorteners to study for the first time in a joint manner how URLs get promoted on a social media and how users decide to click on those. This method is scalable using no privileged accounts, and can in principle apply to differ-ent web domains and social media than those we consider here. After presenting how to reproduce it, we analyze mul-tiples biases, run validation experiment, and propose cor-rection measures. As a motivation for this section, we focus on estimating the distribution of Click-Per-Follower (CPF), which is the probability that a link shared on a social me-dia generates a click from one of the followers receiving that share.
Background on datasets involving clicks.
As a general rule, datasets involving clicks of users are highly sensitive and rarely described let alone shared in a public manner, for two reasons.
First, they raise ethical issues as the behavior of individual users online (e.g., what they read) can cause them real harm. Users share a lot of content online, sometimes with dramatic consequence as this spreads, but they also have an expec-tation of privacy when it comes to what they read. This important condition makes it perilous to study clicks by col-lecting individual behaviors at scale. We carefully analyze the potential privacy threat of our data collection method and show that it merely comes from minutiae of social web referral that can be accounted for and removed at no ex-pense.
Second, clicks on various URLs have important commer-cial value to a news media, a company, or a brand: if a movie orchestrates a social media campaign, the producing com-pany, the marketing comcom-pany, and the social media itself might not necessarily like to disclose its success in gathering attention, especially when it turns out to be underwhelming. These issues have hindered the availability of any such in-formation beyond very large seasonal aggregates. Moreover due to the inherent incentives in disclosing this information (social media buzz, or the lack thereof), one may be tempted to take any of those claims with a grain of salt. In fact, prior to our paper, no result can be found to broadly estimate the Click-Per-Follower of a link shared on social media.
2.1
Obtaining raw data & terminology
For our study, we consider five domains of news media chosen among the most popular on Twitter: 3 news media channels BBC, CNN, and Fox News, one newspaper, The New York Times, and one strictly-online source, The Huff-ington Post. Our goal is to understand how URLs from these news media appear and evolve inside Twitter, as well as how those URLs are clicked, hence bringing web traffic revenue to each of those medias.
To build our dataset, we crawled two sources: Twitter to get the information on the number of shares and receptions (defined below), and bit.ly to get the number of clicks on the shortened URLs. At the beginning of our study, we mon-itored all URLs referencing one of the five news media using the Twitter 1% sample, and we found that 80% of the URLs
of these five domains shared on Twitter are shortened with bit.ly, using a professional domain name such as bbc.in or fxn.ws. In the following, we only focus on the URLs shortened by bit.ly.
Twitter Crawl. We use two methods to get tweets from the Twitter API. The first method is to connect to the
Streaming API5 to receive tweets in real time. One may
specify to access a 1% sample of tweets. This is the way we
discover URLs for this study6.
The second method to get tweets, and the one we use
after a URL is discovered, is to use the search API7. This
is an important step to gather all tweets associated with a given URL, providing a holistic view of its popularity, as op-posed to only tweets appearing in the 1% sample. However, this API call has some limitations: (i) we cannot search for tweets older than 7 days (related to the time the API is called), (ii) the search API is rate-limited at 30 requests per minute for an application-only authentication and 10 re-quests per minute for a user authentication. This method proved sufficient to obtain during a month a comprehensive view of the sharing of each URL we preliminary discovered.
bit.ly Crawl. The bit.ly API provides the hourly
statistics for the number of clicks on any of its URLs, in-cluding professional domains. The number of API calls are
rate-limited, but the rate limit is not disclosed8. During
our crawl, we found that we cannot exceed 200 requests per hour. Moreover, as the bit.ly API gives the number of clicks originating from each web referrer, we can distinguish between clicks made from twitter.com, t.co, and others, which allows us to remove the effect of traffic coming from other sources.
In the rest of this article, we will use the following terms to describe a given URL or online article.
Shares. Number of times a URL has been published in tweets. An original tweet containing the URL or a retweet of this tweet are both considered as a new share.
Receptions. Number of Twitter users who are potentially exposed to a tweet (i.e., who follow an account that shared the URLs). Note that those may not have nec-essarily seen or read the tweet in the end. As an ex-ample, if a tweet is published by a single user with N followers, the number of receptions for this tweet is N . This metric is related but different from the number of “impressions” (number of people who actually saw the tweets in their feed). Impressions are typically im-possible to crawl without being the originator of the tweet (see a study by Wanget al. [26] comparing those two metrics).
Clicks. Number of times a URL has been clicked by a vis-itor originating from twitter.com or t.co.
5https://dev.twitter.com/streaming/overview
6One can also specify to the Streaming API a filter to receive
tweets containing particular keywords (up to 400 keywords) or sent by particular people (up to 5000 userIDs) or from particular locations. For the volume of tweets that we gath-ered, this method can be overwhelmed by rate limit, leading to real time information loss, especially during peak hours, that are hard to recover from.
7https://dev.twitter.com/rest/reference/get/search/tweets
8http://dev.bitly.com/rate limiting.html
Click-Per-follower (CPF). For a given URL, the CPF is formally defined as the ratio of the clicks to the receptions for this URL. For example, if absolutely all followers of accounts sharing a URL go visit the article, the CPF is equal to 1.
Limitations.
The rest of this section will demonstrate the merit of our method, but let us first list a serie of limitations. (i) It only monitors searchable public shares in social media. Facebook, an important source of traffic online, does not offer the same
search API9. Everything we present in this article can only
be representative of public shares made on Twitter. (ii) It only deals with web resource exchanged using bit.ly or one of its professional accounts. This enables to study leading news domain which are primarily using this tool to direct traffic to them. Our observations are also subject to the particular choice of domains (5 news channel, in English, primarily from North America). (iii) It is subject to rate limits. bit.ly API caps the number of request to an undis-closed amounts and Twitter implements a 1 week window on any information requested. This could be harmful to study even larger domains (e.g., all links in bit.ly) as this is im-practical, but as we will see it was not a limitation for those cases considered in this study. (iv) It measures attention on social media only through clicks. While in practice merely viewing a tweet can already convey some information, we consider that no interest was shown by the user unless they are actively visiting the article mentioned.
2.2
Ensuring users’ privacy
Since we only collect information on URLs shared, viewed, and visited, we do not a priori collect individual data that are particularly sensitive in nature. Note also, that all those data are publicly available today. However, the scale of our data might a posteriori contains sufficient information to derive those individual behaviors from our aggregates. As an extreme example, if a user is the only user on that social media receiving an article, and that this article is clicked, that information could be used to infer that this user most likely read that webpage.
We found a few instance of cases like the above, but in practice those particular cases can be addressed. First, be-fore we analyze the raw data we apply a preprocessing merg-ing step in which all URLs shorteners that lead to the same developed URLs were merged together (ignoring informa-tion contained after the symbols “?” and “#” which may be used in URL to inform personalization). This also helps our analysis further as it allows to consider the importance of a given article independently of the multiplication of URLs by which it is shortened. After considering the data after this processing step, we found that case of clicked URLs with less than 10 receptions never occurred. Moreover, we found only a handful of URLs with less than 50 receptions, show-ing that in all cases we considered, all but a extremely small number of users are guaranteed to be k-anonymous with
k= 50. Equivalently, it means that their behavior is
indis-tinguishable from at least 49 other individuals. In practice, for most users, the value of k will be much larger. Finally,
9Although, very recently as of October 2015 Facebook
pro-vides search over public posts http://www.wired.com/2015/ 10/facebook-search-privacy/.
we observe that no explicit information connect clicks from multiple URLs together. Clicks are measured at a hourly rate, it is therefore particularly difficult to use this data to infer that the same user has clicked on multiple URLs and use it for reidentification.
Finally, we computed the probability for a discovered URLs to receive at least one click as a function of its num-ber of receptions, and found that observed URLs with less than 500 receptions are a minority (3.96%), and among those 9.80% actually receive clicks. This shows that, while our study dealing with links from popular sources online raised little privacy issue, one could in practice extend this method for more sensitive domains simply by ignoring clicks from those URLs if a larger value of k-anonymity is required (such as k = 500) to protect users.
Removing clicks from all URLs with less than k receptions would in practice affect the results very marginally.
2.3
Selection bias and a validated correction
The most important source of bias in our experiment comes from the URL discovery process. As we rely on a 1% sample of tweets from Twitter, there are necessarily URLs that we miss, and those we obtain are affected by a selec-tion bias. First, Twitter does not always document how this sample is computed, although it is arguably random. (Our experiments confirmed that it a uniform random sam-ple.) Second, the 1% sample yields a uniform sample of tweets, but not the URLs contained in these tweets. We are much more likely to observe a URLs shared 100 times than one shared only in a few tweets. We cannot recover the data about the missed URLs, but we can correct it by giving more weight to unpopular URLs in our dataset when we compute statistics. We note that this selection bias was present in multiple studies before ours, but given our focus on estimating the shape of online news, it is particularly damaging.
To understand and cope with this bias, we conduct a val-idation experiment in which we collected all tweets for one of the news sources (i.e., nytimes.com) using the Twitter search API. Note that bit.ly rate limits would not allow us to conduct a joint analysis of audience for such volumes of URLs. This collection was used to compare our sample, and validate a correction metric.
Figure 1 compares distributions of the number of shares among URLs in our sample and in the validation experi-ment for the same time period. We see that 1% sample underestimates unpopular URLs that are shared less often. However, this bias can be systematically corrected by re-weighting each URL in the 1% sample using the coefficient
1
1−(1−α)s, where α = 0.01 is the probability of a tweet to
get into the sample and s is the number of shares that we observed for that URL from the search API. We then obtain a partial but representative view of the URLs that are found online, which also indirectly validates that Twitter 1% sam-pling indeed resembles a random choice. All the results in this paper take into account this correction.
Finally, we need to account for one particular effect of our data: URLs shorteners were first discovered separately, and crawled each for a complete view of their shares, but shorteners are subsequently merged (as explained in §2.2) into articles leading to the same developed URL. It is not clear which convention applies to best assign weight among merged URLs that have been partially observed, so we relied
Number of URL shares
100 101 102 103
Number of URLs discovered
100 101 102 103 104 105 106 full 1% sample reweighted
Figure 1: 1% sample bias and correction. The bias
due to the 1% sample is significant, but can be fully corrected using reweighting. CPF 10-8 10-7 10-6 10-5 10-4 10-3 10-2 10-1 100 ECDF 0 0.1 0.2 0.3 0.4 0.5 0.6 0.7 0.8 0.9 1 reweighted original
Figure 2: CPF distribution with and without
selec-tion bias. The number of URLs with low CPF is
signif-icantly underestimated if the bias due to the 1% sample is not corrected.
on simple case analysis to decide on the best choice. Our analysis showed that not to overwhelm the correction in fa-vor of either a small or a large article, the best is to sum all shares of shorteners leading to the same article before applying the re-weighting exactly as done above.
Social media CPF and the effect of selection bias.
To illustrate the effect of the selection bias, Figure 2 presents the two empirical distributions of CPF obtained from the Twitter crawl by dividing for each article its sum of clicks by its number of receptions (all measured after 24 h), and after re-weighting each value according to the above correction.We highlight multiple observations: First, CPF overall is low (as one could expect) given that what counts in our data as a reception does not guarantee that the user even has seen the tweet, for instance if she only accesses Twit-ter occasionally this tweet might have been hidden by more recent information. In fact, we estimate that a majority (59%) of the URLs mentioned on Twitter are not clicked at all. Note that this would not appear in the data without re-weighting, where only 22% of URLs are in that case, which illustrates how the selection bias present in the Twitter 1% sample could be misleading. Finally, for most of the URLs that do generate clicks, the CPF appear to lie within the
[10−5; 10−3] range. It is interesting to observe that
remov-ing the selection bias also slightly reinforce the distribution for high values of CPF. This is due to a minority of niche URLs shared only to a limited audience but that happens to generate in comparison a larger number of clicks. This effect will be analyzed further in the next section.
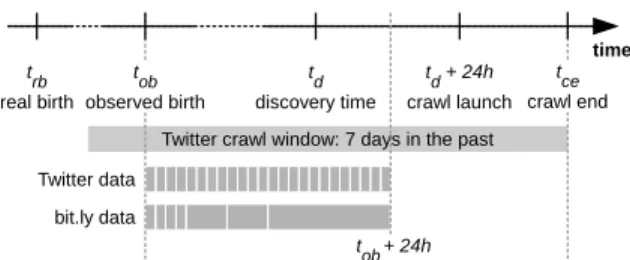
Twitter crawl window: 7 days in the past t d + 24h crawl launch t d discovery time t rb real birth t ob observed birth time t ce crawl end t ob+ 24h Twitter data bit.ly data
Figure 3: Time conventions and definitions for URL life description.
2.4
Other forms of biases
Limited time window.
On Figure 3, we present the time conventions and defi-nitions we are using to describe the lifespan of a URL. We
monitored the 1% tweet sample, and each time tdwe found
a tweet containing a new URL (shortened by bit.ly) from one of the five news media we consider, we schedule a crawl
of this URL at time td+ 24h, the crawl ends at time tce.
The rational to delay by 24 hours the crawl is to make sure that each URL we crawl has a minimum history of 24 hours. The crawl of each URL consists of the three following steps. 1. We query the Twitter search API for all tweets
con-taining this URL. We define the time tob of observed
birth of the URL as the timestamp of the earliest tweet found containing this URL.
2. We query the bit.ly API to get the number of clicks on the URL. Due to the low limit on the number of queries to the bit.ly API, we make 7 calls asking for the number of clicks in the 1st, 2nd, 3rd, 4th, 5th through 8th, 9th through 12th, and 13th through 24th
hours after tob.
3. After this collection was completed, we crawled bit.ly a second time to obtain information on clicks com-pleted after a day (up to 2 weeks).
Note that this technique inherently leverages a partial view on both side of the temporal axis. On the one hand, some old information could have been ignored, due to the limited time window of our search. In fact, we cannot be sure that no tweet mentioned that URL a week before. On the other hand, we empirically measured that for a
major-ity of URLs td− tob≤1 hour which means that the oldest
observation of that URLs in the week was immediately be-fore our discovery. Moreover, for an overwhelming majority
of the URLs (97.6%) td− tob ≤5 days. This implies that
for all of those our earliest tweets were preceded by at least two days where this URLs was never mentioned (see Fig-ure 3). Given the natFig-ure of news content, we deduce that
earlier tweets are non-existent (we conclude that trbis equal
to tob), or even if they are missed, not creating any more
clicks at the time of our observations. Finally, we note that recent information occurring after our observation time is missing, especially as we cannot retroactively collect tweets after 24 h. While this could in theory be continuously done in a sliding window experiment, we observe that an over-whelming majority of tweets mentioning a URLs occurred
immediately after our discovery (within a few hours). We also note that the effect of those tweets would not affect the clicks seen before 24 h.
The effect of multiple receptions.
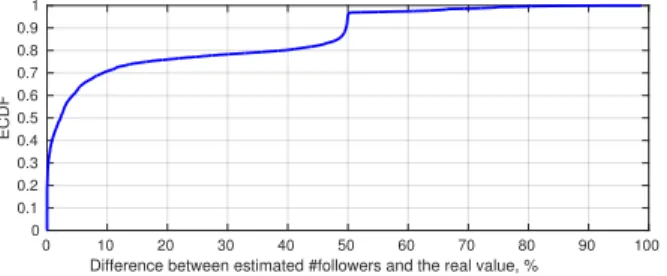
An online article may be shown multiple times, sometimes using the same shorteners, to the same user. This comes from multiple reasons. Two different accounts that a user follows may share the same link, or a given Twitter account may share multiple times the same URL, which is not so uncommon. This necessarily affects how one should count receptions of a given URLs, and how to estimate its CPF although it’s not clear whether receiving the same article multiple times impacts its chance to be seen. Note finally, that even if we know the list of Twitter users who shared a URL, we cannot accurately compute how many saw the URLs at least once without gathering the list of followers of those who share, in order to remove duplicates, i.e., overlaps between sets of followers. Because of the low rate limit of the Twitter API, it would take us approximately 25 years with a single account to crawl the followers of users who shared the URLs in our dataset. However, we can compute an upper bound of the number of receptions as a sum of the number of followers. This is an upperbound because we don’t consider the overlap between the followers, that is any share from a different user counts as a new reception. Note that this already removes multiplicity due to several receptions coming from the same account.
To assess the bias introduced by this estimation, we con-sider a dataset that represents the full Twitter graph as of July 2012 [8]. This graph provides not only the number of followers, but also the full list of followers for each ac-count, at a time where the API permitted such crawl. There-fore, this graph allows to compute both an estimate and the ground truth of the number of receptions. We computed our estimated reception and the ground truth reception for each URLs on the 2012 dataset. We note that some users that exist today might not have been present in the 2012 dataset. Therefore, we extracted from our current dataset all Twitter users that published one of the monitored URLs and found that 85% of these users are present in the 2012 dataset, which is large enough for our purpose.
Figure 4 shows the difference between our estimation of the number of receptions and the real number of receptions based on the 2012 dataset. We observe that for an over-whelming majority (more than 97% of URLs) the two values are of the same order (within a factor 2). We also observe that for 75% of them, the difference is less than 20%.
This implies that the CPF values we obtain are conserva-tive (they may occasionally underestimate the actual prob-ability by about 20-50%) but within a small factor of values computed using other conventions (i.e., for instance, if mul-tiple receptions to the same user are counted only once). For the sake of validating this claim, and measuring how overlaps affect CPF estimation, we ran a “mock” experiment where we draw the distribution among URLs of the CPF assuming that the audience is identical to the followers found in the 2012 dataset. We compare the CPF when multiple recep-tions are counted (as done in the rest of this paper), and when duplicate receptions to the same user are removed. Note that since 2012 the number of followers have evolved (typically increased) as Twitter expanded, hence receptions are actually underestimated. The absolute values we
ob-Difference between estimated #followers and the real value, % 0 10 20 30 40 50 60 70 80 90 100 ECDF 0 0.1 0.2 0.3 0.4 0.5 0.6 0.7 0.8 0.9 1
Figure 4: Bias of the estimation of the number of
receptions. The figure present the ECDF of the
rela-tive difference of the real number of receptions and our esti-mate. The lists of followers are taken from the 2012 Twitter dataset [8]. For 75% of the receptions, the estimation error is less than 20%, which is good enough for this study.
serve are hence not accurate (typically ten times larger). However, we found that the CPF for multiple conventions always are within a factor two of each other. It confirms that the minority of URLs where overlaps affect receptions are URLs shared to a small audience that typically do not impact the distribution.
3.
LONG TAIL & SOCIAL MEDIA
For news producers and consumers, social media create new opportunities by multiplying articles available and ex-posed, and enabling personalization. However, with no anal-ysis of consuming behaviors that is, clicks, which we show vastly differ from sharing behaviors, it remains uncertain how the users of social media today take advantage of such features.
3.1
Background
Social media such as Twitter allow news consumption to expand beyond the constraints of a fixed number of head-lines and printed articles. Today’s landscape of news is in theory only limited by the expanding interests of the online audience. Previous studies show that almost all online users exhibit an uncommon taste at least in a part of their online consumption [9], while others point to possible bottlenecks in information discovery that limits the content accessed [5]. To fully leverage opportunities open by social media, works propose typically to leverage either a distributed social cura-tion process (e.g., [32, 11, 27, 20]) or some underlying inter-est clusters to feed a recommender system (e.g., [30, 19]). However, with no evidence on the actual news consumed by users, it is hard to validate whether todays’ information has benefited from those opportunities. For instance, online media like those in our study continue to select a few set of headlines articles to be promoted via their official Twitter account, followed by tens of millions of users or more, effec-tively reproducing traditional curation under a new format. Those are usually leading to large cascades of information. What remains to measure is how much web traffic comes from such promoted content, and how much from different type of content reaching users organically through the dis-tributed process of online news sharing. To answer these questions, we rely on a detailed study of the properties of the long tail and the effect of promotion on content accessed.
Long tail of online news: What to expect?.
Pareto’s principle, or the law of diminishing return, states that a majority of the traffic (say, for instance 80%) should primarily comes from a restricted, possibly very small, frac-tion of the URLs. Those are typically referred to as the blockbusters. This prediction is however complemented with the fact that most web traffic exhibits a long tail effect. The later focuses on the set of URLs that are requested infre-quently, also referred to as niche. It predicts that, when it comes to generating traffic, whereas the contribution of each niche URLs is small, they are in such great numbers that they collectively contribute a significant fraction of the overall visits. Those properties are not contradictory and usually coexist, but a particular one might prevail. When it is the case, it pays off for a content producer who has limited resource and wishes to maximize its audience to fo-cus either on promoting the most popular content, or, on the contrary, on maintaining a broad catalog of available information catering to multiple needs.
And what questions remains to answer?.
Beyond the above qualitative trends, we wish here to an-swer a set of precise questions by leveraging the consumption of online news. What level of sharing defines a blockbuster URL that generates an important volume of clicks, or a niche one; for instance, should we consider a moderate success a URL that is shared 20 times or clicked 5 times? Does it mean that niche URLs have overall a negligible effect in bringing audience to an online site? Since the headlines selected by media to feature in their official Twitter feed benefit from a large exposure early on, could it be that they account for almost all blockbuster URLs? More generally, what frac-tion of traffic is governed by blockbuster and niche clicks? Moreover, do any of those property vary significantly among different online news sources, or is it the format of the social media itself (here, Twitter) that governs users behaviors, in the end, determining how content gets accessed?
3.2
Traditional vs. social media curation
To answer the above questions, we first introduce a few definitions:
Primary URL. A primary URL is a URL contained in a tweet sent by an official account of the 5 news me-dia we picked for this study. Such URLs are spread through the traditional curation process because they are selected by new media to appear in the headlines. Secondary URL. All URLs that are not primary are sec-ondary URLs. Although they refer to official and au-thenticated content from the same domain, none bene-fited from the broad exposure that the official Twitter of this source offers. Such URLs are spread trough the social media curation process.
We see from the sharing activities (tweet and retweet) that primary URLs accounts for 60.47%, hence a majority, of the receptions in the network. This comes from the fact that, although primary URLs only account for 17.43% of the shares overall, non-primary URLs are typically shared to less followers.
If we assume that clicks are linearly dependent on the re-ceptions then we will wrongly conclude that clicks are pre-dominantly coming from primary or promoted content. In
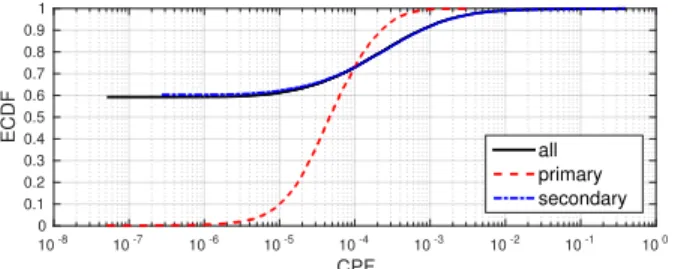
CPF 10-8 10-7 10-6 10-5 10-4 10-3 10-2 10-1 100 ECDF 0 0.1 0.2 0.3 0.4 0.5 0.6 0.7 0.8 0.9 1 all primary secondary
Figure 5: The empirical CDF of the CPF for primary and secondary URLs. Primary URLs account for 2% of all URLs after selection bias is removed, are always receiving clicks, whereas secondary URLs account for 98% URLs, and 60% of them are never clicked.
fact, one could go even further and expect primarily URLs to generate an ever larger fraction of the clicks. Those URLs, after all, are the headlines that are carefully selected to ap-peal to most, they also contain important breaking news, and are disseminated through a famous trusted channel (a verified Twitter account with a strong brand name). It is however, the opposite that holds. As our new data permits to observe for the first time, secondary URLs, who receive a minority of receptions, generate a significant majority of the clicks (60.66% of them). Note that our methodology plays a key role in proving this result, as without correcting the sampling bias, this trend is less pronounced (non-primary URLs are estimated in the raw data to receive 52.01% of the clicks).
We present in Figure 5 the CPF distribution observed among primary and secondary URLs separately. This al-lows to compare for the first time the effective performance of traditional curation (primary URLs) with the one per-formed through a social media (secondary URLs). Primary URLs account for less than 2% of the URLs overall and all of them are clicked at least once. Secondary URLs, in con-trast, very often fail to generate any interest (60% of them are never clicked), and are typically received by a smaller au-dience. However, secondary URLs that are getting clicked outperform primary URLs in terms of CPF.
This major finding has several consequences. First, it sug-gests that social media like Twitter already play an impor-tant role, both to personalize the news exposed to generate more clicks, and also to broaden the audience of a particular online domain by considering a much larger set of articles. Consequently, serving traffic for less promoted or even non-promoted URLs is critical for online media, it even creates a majority of the visits and hence advertising revenue. Simple curating strategies focusing on headlines and traditional cu-ration would leave important opportunities unfulfilled (more on that immediately below). In addition, naive heuristics on how clicks are generated in social media are too simplistic, and we need new models to understand how clicks occur. Beyond carefully removing selection bias due to sampling, there is a need to design CPFs model which accounts for various types of sharing dynamics.
Variation across news domain.
One could formulate a simple hypothesis in which the channel, or in this case the social network, that is used to share information governs how its users decide to share and click URLs, somewhat independently of the sources. But we
found that the numbers reported above for the overall data vary significantly between online news media (as shown in Table 1 where they are sorted from the most to the least popular), proving that multiple audiences use Twitter dif-ferently.
Most of the qualitative observations remain: a majority of URLs (50-70%) are not clicked, and primarily URLs al-ways generate overall more receptions than they generate clicks. But, we also observe striking differences. First, do-mains that are less popular online (in terms of mentions and clicks) shown on the right in Table 1 typically rely more on traditional headline promotion to receive clicks: nyti.ms and fxn.ws stand as the two extreme examples with 60% and 90% of their clicks coming from headlines, whereas the Huff-ington Post and the BBC which receive more clicks, present opposite profiles. These numbers suggest that most famous domains like those receive the same absolute order of clicks from primary URLs (roughly between 0.5 and 1.2 million), but that some differ in successfully fostering broader interest to their content beyond those. Although those domain cater to different demographics and audience, Twitter users rep-resent a relatively young crowd and this may be interpreted as an argument that editorial strategy based on a breadth of topics covered might be effective as far as generating clicks from this population is concerned.
3.3
Blockbusters and the share button
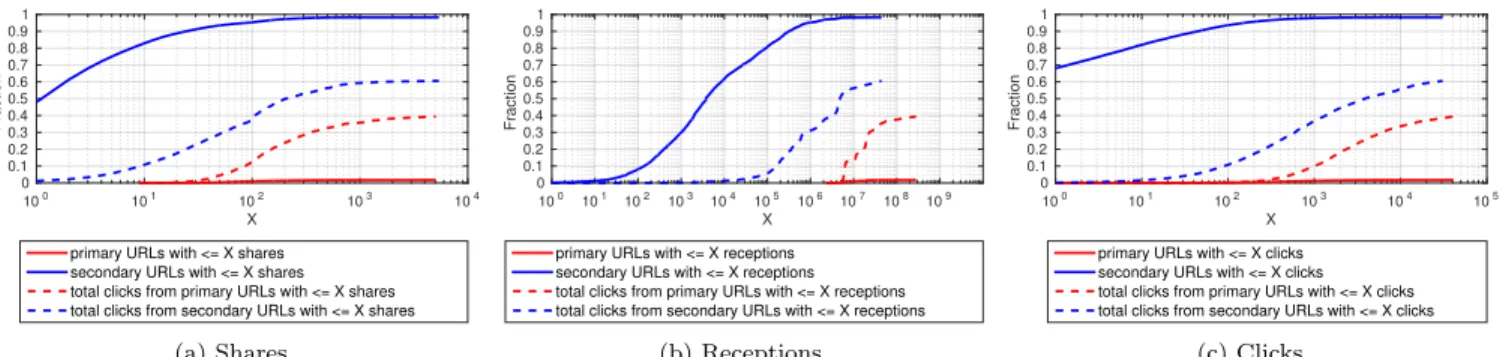
Our results show that information sharing on social me-dia plays a critical role for online news; it complements cu-ration offered traditionally through headlines. These two forms of information selection appear strikingly similar: in traditional curation 2% of articles are chosen and produce a disproportionate fraction (near 39%) of the clicks; the shar-ing process of a social media also results in a minority of secondary URLs (those clicked at least 90 times, about 7% of them) receiving almost 50% of the click traffic. Together, those blockbuster URLs capture about 90% of the traffic. Each typically benefits from a very large amount of recep-tions (from Figure 6, we estimate that 90% of the clicks come from URLs with at least 150,000 receptions). More details on each metric distribution and how those URLs generate clicks can be seen in Figure 6.
Before our study, most analysis of blockbusters content made the following assumptions: since the primary ways to promote a URL is to share or retweets this article to your fol-lowers, one could identify blockbusters using the number of times a URL was shared. This motivates today’s ubiquitous use of the “share number” shown next to an online article with various button in Twitter, Facebook, and other social media. One could even envision that, since a fraction of the users clicking an article on a social media decide to retweet it, the share number is a somewhat reduced estimate of the actual readership of an article. However, our joint analysis of shares and clicks reveal limitations of the share number.
First, 59% of the shared URLs are never clicked or, as we call them, silent. Note that we merged URLs pointing to the same article, so out of 10 articles mentioned on Twitter,
6 typically on niche topics are never clicked10.
Because silent URLs are so common, they actually ac-count for a significant fraction (15%) of the whole shares we collected, more than one out of seven. An interesting
10They could, however, be accessed in other ways: inside the
bbc.in huff.to cnn.it nyti.ms fxn.ws # URLs 13.14k 12.38k 6.39k 5.60k 1.82k # clicks (million) 3.05 2.29 2.01 1.53 0.79 % primary shares 7.24% 10.34% 22.94% 31.86% 41.06% % primary receptions 31.16% 61.78% 75.37% 78.97% 84.76% % primary clicks 15.01% 30.81% 61.29% 60.31% 89.79% % unclicked URLs 51.19% 59.85% 70.16% 64.94% 62.54%
Clicks from all URLs shared <100 times 51.10% 75.70% 33.67% 22.59% 34.89%
Clicks from secondary URLs shared <100 times 46.11% 55.28% 24.73% 14.83% 6.62%
Threshold share to get 90% clicks 8 6 22 34 90
Threshold receptions to get 90% clicks 215k 110k 400k 560k 10,000k
Threshold clicks to get 90% clicks 70 62 180 170 2,000
Table 1: Variation of metrics across different newssource.
X 100 101 102 103 104 Fraction 0 0.1 0.2 0.3 0.4 0.5 0.6 0.7 0.8 0.9 1
primary URLs with <= X shares secondary URLs with <= X shares total clicks from primary URLs with <= X shares total clicks from secondary URLs with <= X shares
(a) Shares. X 100 101 102 103 104 105 106 107 108 109 Fraction 0 0.1 0.2 0.3 0.4 0.5 0.6 0.7 0.8 0.9 1
primary URLs with <= X receptions secondary URLs with <= X receptions total clicks from primary URLs with <= X receptions total clicks from secondary URLs with <= X receptions
(b) Receptions. X 100 101 102 103 104 105 Fraction 0 0.1 0.2 0.3 0.4 0.5 0.6 0.7 0.8 0.9 1
primary URLs with <= X clicks secondary URLs with <= X clicks total clicks from primary URLs with <= X clicks total clicks from secondary URLs with <= X clicks
(c) Clicks.
Figure 6: Fraction of Primary/Secondary URLs (divided by all URLs) with less than X shares, receptions and clicks, shown along with the cumulative fraction of all clicks that those URLs generate (dashed lines).
paradox is that there seems to be vastly more niche content that users are willing to mention in Twitter than the content that they are actually willing to click on. We later observe another form of a similar paradox.
Second, when it comes to popular content, sharing activity is not trivially correlated with clicks. For instance, URLs re-ceiving 90 shares or more (primary or secondary) comprises the top 6% most shared, so about the same number of URLs as the blockbusters, but they generate way less clicks (only 45%). Conversely we find that blockbuster URLs are shared much less. Figure 6 shows that 90% of the clicks are dis-tributed among all URLs shared 9 times and more.
The 90% click threshold of any metric (clicks, shares, re-ceptions) is the value X of this metric such that the subset of URLs with metric above X receives 90% of the clicks. We present values of the 90% click threshold for different do-mains in Table 1. We observe that the threshold for share is always significantly smaller than other metrics, which means that any URLs shared even just a few times (such as 6 or 8) may be one generating clicks significantly.
The values of 90% click thresholds, when compared across
domains, reveals another trend: most popular domains
(shown on the left) differ not because their most success-ful URLs receive more clicks, but because clicks gets gener-ated even for URLs shared a few times only. For instance, in fxn.ws, URLs with less than 90 mentions are simply not contributing much to the click traffic; they could entirely dis-appear and only 10% of the clicks to that domain would be lost. In contrast, for bbc.in and huff.to the bulk of clicks are generated even among URLs shared about 6-8 times. Similarly, for Fox News 90% of clicks belong to URLs
gen-erating at least 10 million receptions on Twitter, this goes down by a factor 50x to 100x when it comes to more pop-ular domains receiving 3 or 4 times more clicks overall. In other words, although massive promotion remains an effec-tive medium to get your content known, the large popularity of the most successful domains is truly due to a long-tail ef-fect of niche URLs.
In summary, the pattern of clicks created from social me-dia clearly favors a blockbuster model: infrequent niche URLs—whatever numerous they are—are generally seen by few users overall and hence have little to no effect on clicks, while successful URLs are seen by a large number (at least 100,000) of the users. But those blockbusters are not easy to identify: massive promotion of articles through official Twit-ter accounts certainly work, but it appeals less to users as far as clicks are concerned, and in the end, most of the web visits come from other URLs. All evidence suggest that for a domain to expand and grow, the role of other URLs, some-times shared not frequently, is critical. We note also that relying on the number of shares to characterize the success of an article, as commonly done today for readers of online news, is imprecise (more on that in Section 5).
4.
SOCIAL MEDIA ATTENTION SPAN
We now analyze how our data on social media attention reveals different temporal dynamics than those previously observed and analyzed in related literature. Indeed, prior to our work, most of the temporal analysis of social media relied on sharing behavior, and concluded that their users have a short attention span, as most of the activity related
to an item occurs within a small time of its first appearance. We now present contrasting evidence when clicks are taken into account.
4.1
Background
Studying the temporal evolution of diffusion on social me-dia can be a powerful tool, either to interpret the attention received online as the result of an exogenous or endogenous process [6], to locate the original source of a rumor [24], or to infer a posteriori the edges on which the diffusion spreads from the timing of events seen [10]. More generally, exam-ining the temporal evolution of a diffusion process allows to confirm or invalidate simple model of information prop-agation based on epidemic or cascading dynamics. One of the most important limitation so far is that prior studies focus only on the evolution of the collective volume of at-tention (e.g., hourly volumes of clicks [25], views [6, 5]), hence capturing the implicit activity of the audience, while ignoring the process by which the information has been prop-agated. Alternatively, other studies focus on explicit infor-mation propagation only (e.g., tweets [31], URLs shorteners, diggs [28]) ignoring which part of those content exposure leads to actual clicks and content being read. Here for the first time we combine explicit shares of news with the im-plicit web visits that they generate.
Temporal patterns of online consumption was gathered using videos popularity on YouTube [6, 5] and concluded to some evolution over days and weeks. However, this study considered clicks originating from any sources, including YouTube own recommendation systems, search engine and other mentions online. One hint of the short attention span
of social media was obtained through URLs shorteners11.
Using generic bit.ly links of large popularity, this study concludes that URLs exchanged using bit.ly on Twitter to-day typically fades after a very short amount of time (within half an hour). Here we can study jointly for the first time the two processes of social media sharing and consumption. Prior work [1] dealt with very different content (i.e., videos on YouTube), only measured overall popularity generated from all sources, and only studied temporal patterns as a
user feature to determine their earliness. Since the two
processes are necessarily related, the most important unan-swered question we address is whether the temporal property of one process allows to draw conclusion on the properties of the others, and how considering them jointly shed a new light on the diffusion of information in the network.
4.2
Contrast of shares and clicks dynamics
For a given URL and type of events (e.g., clicks), we define this URL half-life as the time elapsed between its birth and half of the event that we collected in the entire data (e.g., the time at which it received half of all the clicks we measured). Intuitively, this denotes a maturity age at which we can
ex-pect interest for this URL to start fading away. Prior report1
predicted that the click half-life for generic bit.ly links us-ing Twitter is within two hours. Here we study in addition half-life based on other events such as shares and receptions, and we consider a different domain of URLs (online news). We found, for instance that for a majority of URLs, the half-life for any metric is below one hour (for 52% of the URLs when counting clicks, 63% for shares, and 76% for recep-tions). This offers no surprise; we already proved that most
11http://bitly.is/1IoOqkU
URLs gather a very small attention overall, it is therefore expected that this process is also ephemeral.
But this metric misrepresents the dynamic of online traffic as it hides the fact that most traffic comes from unusual URLs, those that are more likely to gather a large audience over time. We found for instance that only 30% of the overall clicks gathered in the first day are made during the first hour. This fraction drops to 20% if it is computed for clicks gathered over the first two weeks; overall the number of clicks made in the second week (11.12%) is only twice smaller than in the first hour. Share and receptions dynamics are, on the contrary, much more short lived. While we have no data beyond 24 hours for those metrics due to Twitter limitations, we observe that 53% of shares and 82% of all receptions on the first day occur during the first hour, with 91% and 97% of those created during the first half of the day. By the time that we reach the limit of our observation window, it appears that the shares and receptions are close to zero. In fact, the joint correlation between half-life defined on shares and clicks (not shown here, due to lack of space) revealed that those gathering most of the attention are heavily skewed towards longer clicks lifetime. Note that we are reporting results aggregated for all domains but each of them follow the same trend with minor variations.
4.3
Dynamics & long tail
To understand the effect of temporal dynamics on the distribution of online attention, we draw in Figure 7 for shares, receptions and clicks the evolution with time. Each plot presents, using a dashed line, the distribution of events observed after an hour. In solid line we present how the distribution increases cumulatively as time passes, whereas the dashed-dotted line shows the diminishing rate of hourly events observed at a later point. Most strikingly, we observe that shares and especially receptions dropped by order of magnitude at the end of 24 h. Accordingly, the cumulative distribution of receptions seen at 24 h is only marginally dif-ferent from the one observed in the first hour. Clicks, and to some extent shares, present a different evolution. Clicks drop more slowly, but more importantly it does not drop uniformly. The more popular a tweet or a URL the more likely it will be shared or clicked after a big period of time. We highlight a few consequences of those results. Social media have often been described as entirely governed by fast successive series of flash crowds. Although that applies to shares and receptions, it misrepresents the dynamics of clicks which, on the contrary, appear to follow some long term dy-namics. This opens opportunities for accurate traffic predic-tion that we analyze next. In addipredic-tion, our dynamics moti-vate to further investigate the origins and properties of the reinforcing effect of time on popularity, as our results sug-gest that gathering clicks for news on social media rewards URLs that are able to maintain a sustained attention.
5.
CLICK-PRODUCING INFLUENCE
In this section, we propose a new definition of influence based on the ability to generate clicks, and we show how it differs from previous metrics measuring mere receptions. We then show how influence and properties of sharing on social media can be leveraged for accurate clicks prediction.
#shares 100 101 102 103 104 CCDF 10-5 10-4 10-3 10-2 10-1 100 first 24h first 1h last 1h of 24h (a) Shares. #receptions 100 101 102 103 104 105 106 107 108 109 CCDF 10-5 10-4 10-3 10-2 10-1 100 first 24h first 1h last 1h of 24h (b) Receptions. #clicks 100 101 102 103 104 105 CCDF 10-5 10-4 10-3 10-2 10-1 100 first 24h first 1h last 1h of 24h first 2 weeks (c) Clicks.
Figure 7: Evolution of the empirical CCDF with time for three metrics.
5.1
Background
Information diffusion naturally shapes collective opinion and consensus [12, 7, 18], hence the role of social media in redistributing influence online has been under scrutiny ever since blogs and email chains [2, 17]. Information on traditional mass media follows a unidirectional channel in which pre-established institutions concentrate all decisions. Although the emergence of opinion leaders digesting news content to reach the public at large was pre-established long time ago [12], social media presents an extreme case. They challenge the above vision with a distributed form of in-fluence: social media allow in theory any content item to be tomorrow’s headline and any user to become an influ-encer. This could be either by gathering direct followers, or by seeing her content spreading faster through a set of intermediary node.
Prior works demonstrated that news content exposure benefits from a set of information intermediaries [29, 20], proposed multiple metrics to quantify influence on social media like Twitter [4, 3], proposed models to predict its long term effect [14, 16], and designed algorithms to lever-age inherent influence to maximize the success of targeted promotion campaign [13, 23] or prevent it [15]. So far, those influence metrics, models, and algorithms have been vali-dated assuming that observing a large number of receptions is a reliable predictor of actual success, hence reducing in-fluence to the ability to generate receptions. We turn to
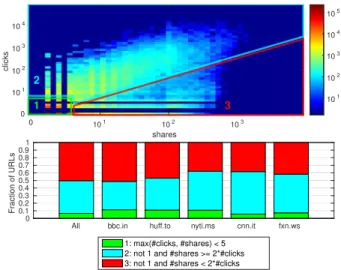
shares 0 101 102 103 cl ic k s 0 101 102 103 104 101 102 103 104 105 1 3 2
All bbc.in huff.to nyti.ms cnn.it fxn.ws
F ra ct io n o f U R L s 0 0.1 0.2 0.3 0.4 0.5 0.6 0.7 0.8 0.9 1 1: max(#clicks, #shares) < 5 2: not 1 and #shares >= 2*#clicks 3: not 1 and #shares < 2*#clicks
Figure 8: Joint distribution of shares and clicks,
and volume of shares created by different subset of URLs.
a new definition in which influence is measured by actual clicks, which are more directly related to revenue through online advertising, and also denote a stronger interaction with content.
5.2
A new metric and its validation
A natural way to measure the influence (or the lack thereof) for a URL is to measure its ability to generate clicks. We propose to measure a URL’s influence by its CPF. To illustrate how it differs from previous metrics, in Figure 8 we present the joint distribution of shares (used today to define influence online) and clicks among URLs in our data using a color-coded heatmap. We observe that the two met-rics loosely correlate but also present important differences. URLs can be divided into three subsets: the bottom left cor-ner comprising URLs who have gathered neither shares nor clicks (cluster 1 in green), and two cluster of URLs separated by a straight line (cluster 2 in cyan and cluster 3 in red). Im-mediately below the figure we present how much share events are created by each cluster. Not shown here is the same dis-tribution for clicks, which confirms that those are entirely produced by URLs in the cluster 2 shown in cyan. This pro-duces another evidence that relying on shares, which classify all those URLs as influential, can be strikingly misleading. While about 40% to 50% of the shares belong to URLs in the cluster 3 in red, those are collectively generating a negligible amount of clicks (1%).
Ideally, we would like to create a similar metric to quantify the influence of a user. Unfortunately, it is not straightfor-ward. One can define the participatory influence of a user as the median CPF of URLs that she decides to share. How-ever, this metric is indirect since clicks generated by these URLs are aggregated with many others. In fact, even if this metric is very high, we cannot be sure that the user was responsible for the clicks we observe on those URLs. To un-derstand the bias that this introduces we compare the CPF of the URLs that users were the only ones to send with the CPF of the other URLs they sent. There are 1,358 users in our dataset that are the only ones tweeting at least one of their URL shorteners (note that for validation we did
CPFparticipant - CPFattributed #10-3 -1 -0.8 -0.6 -0.4 -0.2 0 0.2 0.4 0.6 0.8 1 ECDF 0 0.1 0.2 0.3 0.4 0.5 0.6 0.7 0.8 0.9 1
Figure 9: Bias of the estimation of CPF.
not merge the URL shorteners). For each user, using those URLs whose transmission on Twitter can be attributed to them, we can compare the CPF of attributed URLs, and ones they participated in sharing without being the only ones. Figure 9 presents the relative CPF difference between these two metric computation. We see that for 90% of users with attributed clicks the difference between the
participat-ing CPF and attributed CPF is below 4 × 10⁻⁴. We also see
that the difference is more frequently negative. Overall us-ing the participatus-ing CPF is a conservative estimate of their true influence.
However, one limitation of the above metric is that a very large fraction of users share a small number of URLs. If that or those few URLs happen to have a large CPF, we assign a large influence although we gather small evidence for it. We therefore propose a refined metric based on the same principles as a statistical confidence test. For each user sharing k URLs, we compute a CPF threshold based on the top 95% percentile of the overall CPF distribution, and we count how many (l) of those URLs among k have a CPF above the threshold. Since choosing a URL at random typically succeeds with probability p = 0.05, we can calcu-late the probability that a user obtain at least l such URLs purely due to chance:
k X n=l k n ! pn(1 − p)k −n= 1 − l −1 X n=0 k n ! pn(1 − p)k −n.
When this metric is very small, we conclude that the user must be influential. In fact, we are guaranteed that those URLs are chosen among the most influential in a way that is statistically better than a random choice. It also naturally assigns low influence to users for which we have little evi-dence, as the probability in this case cannot be very small. After computing this metric and manually looking at the results, we found that it clearly distinguish between users, with a minority of successful information intermediaries re-ceiving the highest value of influence.
5.3
Influence and click prediction
So far, our results highlight a promising open problem: as most clicks are generated by social media in the long term, based on early sharing activity, it should be possible to pre-dict, from all the current URLs available on a domain, the click patterns until the end of the day. Moreover, equipped with influence at the user level, we ought to leverage con-text beyond simple count of events for URLs to make that prediction more precise.
To focus on this article on the most relevant outcomes, we omit the details of the machine learning methodology and validation that we use to compute this prediction. They are
however, presented in Appendix A for references. We now present a summary of our main findings:
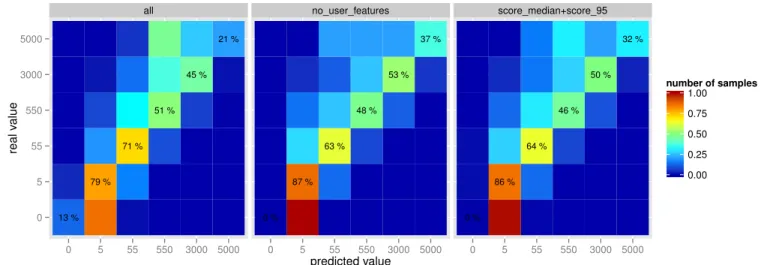
• One can leverage early information on a URL influence
in order to predict its future clicks. For instance, a simple linear regression is shown, based on the number of clicks received by each URL during its first hour, to correctly predict its clicks at the end of the day, with a
Pearson R2correlation between the real and predicted
values being 0.83.
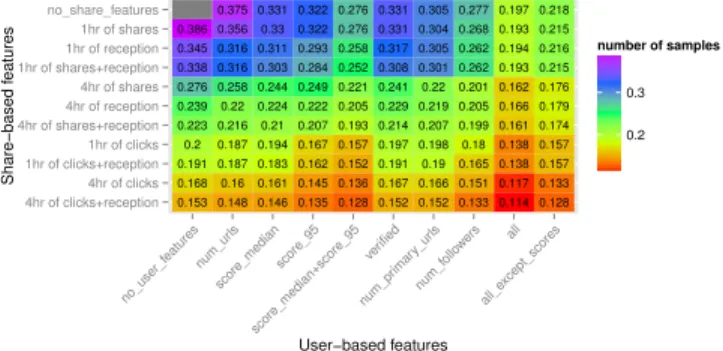
• We found that this result was robust across different
classifications methods (such as SVMs) but it varies with information used. Being able to observe clicks at 4 h, for instance, increased the correlation coefficient of the prediction to 0.87, while information on share after 4 h leads to lower correlations of the prediction of 0.65.
• Including various features for the first 5 users sharing
the URLs (in terms of followers, or the new influence score) is not sufficient to obtain prediction of the same quality. However, this information can be used in com-plement to the 1 h of shares to reach the same precision as with clicks only.
6.
CONCLUSION
As we have demonstrated, multiple aspects of the analysis of social media are transformed by the dynamics of clicks.
We provide the first publicly available dataset12 to jointly
analyze sharing and reading behavior online. We examined the multiple ways in which this information affects previous hypotheses and inform future research. Our analysis of so-cial clicks showed the ability of soso-cial media to cater to the myriad taste of a large audience. Our research also high-lights future area that require immediate attention. Chiefly among those, predictive models that leverage temporal prop-erty and user influence to predict clicks have been shown to be particularly promising. We hope that our methodology, the data collection effort that we provide, and those new observations will help foster a better understanding of how to best address future users’ information needs.
7.
ACKNOWLEDGMENTS
This material is based upon work supported by the Na-tional Science Foundation under grant no. CNS-1254035.
8.
REFERENCES
[1] A. Abisheva, V. R. K. Garimella, D. Garcia, and I. Weber. Who watches (and shares) what on YouTube? And when?: Using Twitter to understand YouTube viewership. In Proc. of ACM WSDM’14. New York, NY, USA, Feb. 2014.
[2] L. A. Adamic and N. Glance. The political
blogosphere and the 2004 U.S. election: divided they blog. In Proc. of ACM SIGKDD LinkKDD’05. Chicago, IL, USA, Aug. 2005.
[3] E. Bakshy, J. M. Hofman, W. A. Mason, and D. J. Watts. Everyone’s an influencer: quantifying influence on Twitter. In Proc. of ACM WSDM’11. Hong Kong, PRC, Feb. 2011.
[4] M. Cha, H. Haddadi, F. Benevenuto, and
K. Gummadi. Measuring user influence in Twitter: The million follower fallacy. In Proc. of AAAI ICWSM’10, Washington, DC, USA, May 2010. [5] M. Cha, H. Kwak, P. Rodriguez, Y.-Y. Ahn, and
S. Moon. Analyzing the video popularity
characteristics of large-scale user generated content systems. IEEE/ACM TON, 17(5):1357–1370, 2009. [6] R. Crane and D. Sornette. Robust dynamic classes
revealed by measuring the response function of a social system. In PNAS, 105(41):15649–15653, Oct. 2008. [7] M. H. Degroot. Reaching a consensus. Journal of the
American Statistical Association, 69(345):118–121, Mar. 1974.
[8] M. Gabielkov, A. Rao, and A. Legout. Studying social networks at scale: macroscopic anatomy of the Twitter social graph. In Proc. of ACM
SIGMETRICS’14, Austin, TX, USA, Jun. 2014. [9] S. Goel, A. Broder, E. Gabrilovich, and B. Pang.
Anatomy of the long tail: ordinary people with extraordinary tastes. In Proc. of ACM WSDM’10, New York, NY, USA, Feb. 2010.
[10] M. Gomez-Rodriguez, J. Leskovec, and A. Krause. Inferring networks of diffusion and influence. ACM TKDD, 5(4), Feb. 2012.
[11] N. Hegde, L. Massouli´e, and L. Viennot.
Self-organizing flows in social networks. In Proc. of SIROCCO’13, pages 116–128, Ischia, Italy, Jul. 2013. [12] E. Katz. The two-step flow of communication: An
up-to-date report on an hypothesis. Public Opinion Quarterly, 21(1):61, 1957.
[13] D. Kempe, J. M. Kleinberg, and ´E. Tardos.
Maximizing the spread of influence through a social network. In Proc. of ACM SIGKDD KDD’03, Washington, DC, USA, Aug. 2003.
[14] J. M. Kleinberg. Cascading behavior in networks: Algorithmic and economic issues. Algorithmic game theory, Cambridge University Press, 2007.
[15] M. Lelarge. Efficient control of epidemics over random networks. In Proc. of ACM SIGMETRICS’09, Seattle, WA, USA, June 2009.
[16] M. Lelarge. Diffusion and cascading behavior in random networks. Games and Economic Behavior, 75(2):752–775, Jul. 2012.
[17] D. Liben-Nowell and J. M. Kleinberg. Tracing information flow on a global scale using Internet chain-letter data. In PNAS, 105(12):4633, 2008. [18] C. G. Lord, L. Ross, and M. R. Lepper. Biased
assimilation and attitude polarization: The effects of prior theories on subsequently considered evidence. Journal of Personality and Social Psychology, 37(11):2098, Nov. 1979.
[19] L. Massouli´e, M. I. Ohannessian, and A. Proutiere. Greedy-Bayes for targeted news dissemination. In Proc. of ACM SIGMETRICS’15. Portland, OR, USA, Jun. 2015.
[20] A. May, A. Chaintreau, N. Korula, and S. Lattanzi. Filter & Follow: How social media foster content curation. In Proc. of ACM SIGMETRICS’14, Austin, TX, USA, Jun. 2014.
[21] H. B. McMahan, G. Holt, D. Sculley, M. Young, and D. Ebner. Ad click prediction: a view from the trenches. In Proc. of ACM SIGKDD KDD’13, Chicago, IL, USA, Aug. 2013.
[22] A. Mitchell, J. Gottfried, J. Kiley, and K. E. Matsa. Political polarization & media habits. Technical report, Pew Research Center, Oct. 2014, http://pewrsr.ch/1vZ9MnM.
[23] J. Ok, Y. Jin, J. Shin, and Y. Yi. On maximizing diffusion speed in social networks. In Proc. of ACM SIGMETRICS’14, Austin, TX, USA, Jun. 2014. [24] P. Pinto, P. Thiran, and M. Vetterli. Locating the
source of diffusion in large-scale networks. Physical review letters, 109(6):068702, Aug. 2012.
[25] G. Szabo and B. A. Huberman. Predicting the popularity of online content. Communications of the ACM, 53(8), Aug. 2010.
[26] L. Wang, A. Ramachandran and A. Chaintreau. Measuring click and share dynamics on social media: a reproducible and validated approach. In. Proc. of AAAI ICWSM NECO’16, Cologne, Germany, May 2016.
[27] F. M. F. Wong, Z. Liu, and M. Chiang. On the efficiency of social recommender networks. In. Proc. of IEEE INFOCOM’15, Hong Kong, PRC, Apr. 2015. [28] F. Wu and B. A. Huberman. Novelty and collective
attention. In PNAS, 104(45):17599–17601, Nov. 2007. [29] S. Wu, J. M. Hofman, W. A. Mason, and D. J. Watts.
Who says what to whom on Twitter. In Proc. of WWW’11. Hyderabad, India, Mar. 2011. [30] J. Xu, R. Wu, K. Zhu, B. Hajek, R. Srikant, and
L. Ying. Jointly clustering rows and columns of binary matrices. In Proc. of ACM SIGMETRICS’14, Austin, TX, USA, Jun. 2014.
[31] J. Yang and J. Leskovec. Patterns of temporal variation in online media. In Proc. of ACM WSDM’11. Hong Kong, PRC, Feb. 2011.
[32] R. B. Zadeh, A. Goel, K. Munagala, and A. Sharma. On the precision of social and information networks. In Proc. of ACM COSN’13. Boston, MA, USA, Oct. 2013.