Describing, Assessing and Embedding Flexibility in
System Architectures with Application to Wireless
Terrestrial Networks and Handset Processors
byPrithviraj Banerjee
Bachelor of Technology, Electronics Engineering Institute of Technology, BHU, Varanasi India Submitted to the System Design & Management Program in partial fulfillment of the requirements for the degree of
Master of Science in Engineering & Management at the
Massachusetts Institute of Technology, Cambridge, MA 02139
January 2004 j-ucc acx
)47
0 Prithviraj Banerjee. All rights reserved
The author hereby grants to MIT permission to reproduce and to
distribute publicly paper and electronic copies of this thesis document in whole or in part.
A u th or ... ...
Prithviraj Banerjee System Design and Management Program 29th Januarv2004 C ertified by ...
unvierL. ae Weck Thesis Supervisor Robert N. Noyce Assistant Professor of Aeronautics and Astronautics and of Engineering Systems Accepted by...
David Simchi Levi Co-Director, LFM/SDM
Professor of Civil and of Environmental Engineerin and En ring Systems
A ccepted by ...
Tom Allen Co-Director, LFM/SDM Professor of Management and of Engineering Systems
MASSACHUSETTS INSTI TIE OF TECHNOLOGY
m
BARKER
Describing, Assessing and Embedding Flexibility in System
Architectures with Application to Wireless Terrestrial Networks and
Handset Processors
By
Prithviraj Banerjee
Submitted to the System Design & Management Program on January 28, 2003, in partial fulfillment of the
requirements for the degree of
Master of Science in Engineering & Management
Abstract
This thesis presents a framework that can be used to identify the flexibility attributes and determine the value of embedding flexibility in system architectures, from the context of network based wireless applications and wireless handset processors Flexibility is first defined and the three dimensions of flexibility - performance, capacity and functionality are explored. This analysis is used to formulate a general model of the dimensions of flexibility. The analysis to determine the value of embedding flexibility is then done using the example of a flexible handset processor. The Black-Scholes model and the Binomial model are presented as methods for computing the economics of financial options. These methods are then applied to computing the value of flexibility options. In order to determine the value of the underlying asset, which is one of the terms needed for the valuation of flexibility, two approaches are presented: conjoint analysis and concept engineering. The bounds of time to expiation are explored. The cost of embedding flexibility is then assessed. Finally, a few methods are proposed for determining the optimal flexibility design vector and implementing a portfolio of real option based flexibility strategy.
Thesis Supervisor: Olivier L. de Weck
Robert N. Noyce Assistant Professor of Aeronautics and Astronautics and of Engineering Systems
Acknowledgements
I would like to thank my thesis advisor Professor Olivier de Weck, for introducing me to
the world of Flexibility and providing his valuable guidance. I would like to acknowledge the valuable help and advice provided by Professor Richard de Neufville.
I would like to thank Badari Kommandur, Principal Engineer Intel Corporation and Jean
Claude Saghbini, Principal Architect EMC Corporation for their contribution to formulate the real option based approach to determine the value of embedding flexibility. I would like to thank Professor Dan Frey, Professor Chris Magee and Ion Freeman for their valuable comments on the Flexibility framework.
Contents
IN T R O D U C T IO N ... 15 1.1 M OTIVATIO N ... 15 1.2 O BJEC-11V ES ... 17 1.2.1 D escribing Flexibility ... 18 1.2.2 A ssessing Flexibility ... 27 1.2.2 Em bedding Flexibility ... 27 1.2.3 A pproach ... 28 1.2.3.1 M ethodology ... 29 1.2.3.2 Structure of Thesis ... 30 LIT ER A T U R E R EV IEW ... 33 2.1 G EN ERAL ... 33 2.2 D EscF= oN O F Fu x im a y ... 33 2.3 EM BEDDIN G FLEXIBILITY ... 34 2.4 A SSESSING FLEXIBILITY ... 35D ESC R IBIN G FLEX IB ILIT Y ... 39
3.1 INTRODUCTION ... 39
3.2 TH E W IRELESS N ETw oRK ... 43
3.2.1 N etw ork Evolution ... 43
3.2.2 Evolution of Standards ... 44
3.2.3 Europe Vs N America in 2G Standard Evolution ... 46
3.2.4 3G N etw ork Evolution ... 47
3.2.4.1 CDM .A -Tedm ological Edge ... 47
3.2.5 The Future ... 49
3.3 D IFFUSION IN TH E W IRELESS IN DUSTRY ... 49
3.3.1 The V oice D im ension - Late M ajority ... 50
3.3.2 C ost ... 52
3.3.3 C apacity ... 52
3.3.4 Spectrum ... 53
3.3.5 V alue A dded A pplications ... 53
3.3.5.1 A pplications - driving the future ... 53
3.4 W IRELESS F]AN DSET PROCESSORS ... 55
3.5 TH E V ALU E C H AIN ... 56
3.6 END U SERS ... 56
3.7 A PPLICATION S SERVICE/ C ONTENT PROVIDERS ... 56
3.7.1 Security A pplications ... 57
3.7.2 G am ing A pplications ... 57
3.7.3 Location A pplications ... 58
3.7.4 M ultim edia A pplications ... 59
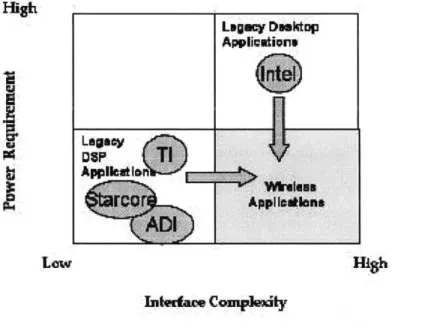
3.9 A PPROACH 1 - REDUCE TH E POW ER ... 64
3.10 APPROACH 2 - ENHANCE INTERFACE COMPLEXITY ... 64
EM BED D IN G FLEXIBILIT Y ... 71
4.1 INTRODUCTION ... 71
4.2 FUNCTIONAL G C)NTEXT ... 72
4.3 N ETW ORK A RCHITECTURE ... 74
4.4 TH E D IM EN SIONS ... 76
4.5 TH E SrATE M ACH INES ... 78
4.6 FLExim n y D IM ENSIONS ... 79
4.7 TH E W DEL ... 79
CON CLUSION ... 89
VALUING PRODUCT FLEXIBILITY (MATHEMATICAL FRAMEWORK) ... 91
5.1 INTRODUCTION ... 91
5.2 C ASE OF FLEM BLE W IRELESS PROCESSOR ... 92
5.2.1 Background ... 92
5.2.2 V alue of the flexibility option ... ... a r.'J 5.2.3 Recom m endation ... 100
5.3 Q UAN TITATIVE FRAM EW ORK ... 101
5.3.1 Flexibility A ttributes ... 102
5.3.2 Tim e W indow ... 103
5.3.3 Flexibility D esign Space ... 104
5.3.4 C urrent C osts ... 105
5.3.5 Future C osts ... 105
5.3.6 V alue ... 106
5.4 R EAL O PHON A PPROACH ... 106
5.4.1 Black-Scholes M odel (PD E) ... 107
5.4.2 The Binomial Solution (Dynamic Programming) ... 114
5.5 C ON CLUSION ... 118
ASSESSING FLEXIBILITY - OPTION PARAMETERS AND COST ... 119
6.1 IN M ODUC IION ... 119
6.2 FUTURE D EM AND ... 121
6.2.1 System D ynam ics M odel ... 123
6.3 V ALUE TO C LE M NERS ... 125 6.3.1 C onjoint A nalysis ... 125 6.3.2 C oncept Engineering ... 128 6.4 TIM E TO EXPIRATION ... 133 6.5 COST ... 137 6.5.1 Functional Flexibility ... 137 6.5.2 C apacity Flexibility ... 139
6.5.2.1 The Platform Strategy ... 140
6.6 C ON CLUSIO N ... 144
FLEXIBILITY STRATEGY AND CONCLUSIONS ... 147
7.1 IM M ODUC nON ... 147
7.2 O pn oN A NALYSIS ... 150
7.2.1 R ate of R eturn Scenario ... 150
7.2.2 U nconstrained Scenario ... 153
7.2.3 C onstrained Scenario ... 155
7.3 PORITOLIO OF REAL O M ONS ... 156
7.4 C ON CLUSION ... 157
List of figures
Figure Number Page
Figure 1 Flexible Design Objective Space (Adapted from [1]))...16
Figure 2 Adoption curve of a flexible product...17
Figure 3: Generic Object-Process-Diagram of System Operating. Source [4]...18
Figure 4 OPD Representation of Flexibility: Functional flexibility...19
Figure 5 OPD Representation of Flexibility: Capacity and Performance Flexibility...20
Figure 6 Intent-Process-Object Diagram for 2G GSM Network...23
Figure 7 Reusable Com ponents ... 26
Figure 8 Flexibility Design and Objective Space. Adapted from [6]...28
Figure 9 Flexibility Fram ework ... 30
Figure 10 Thesis Roadm ap... 32
Figure 11 Focus of Chapter 3 (adapted from [4])...40
Figure 12 W ireless Value Chain... 41
Figure 13 Wireless and Wire line Network Evolution in North America...44
Figure 14 Diffusion for TDMA, CDMA and GSM. (Source: [121)...45
Figure 15 Evolution Paths of TDMA, GSM and CDMA...48
Figure 16 North American Wireless Subscribers...51
Figure 18 Migration Strategy of key players in the wireless processor segment...63
Figure 19 Focus of Chapter 4 (adapted from [4])...72
Figure 20 Simplified (2G) Wireless Network...74
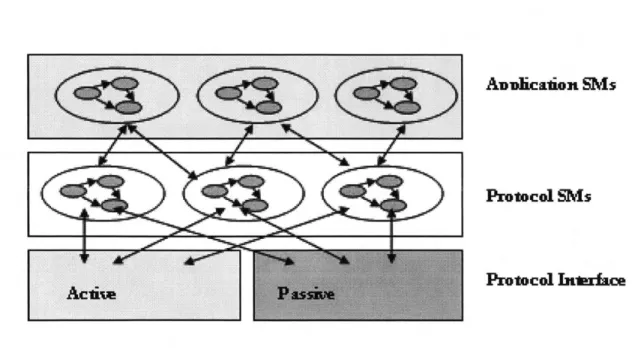
Figure 21 Application Platform Layers...77
Figure 22 Flexibility M odel of a System ... 80
Figure 23 Intent-Process-Concept diagram of Application 1...81
Figure 24 Application Attributes... 82
Figure 25 Architectural Form of Application 1...83
Figure 26 Architectural Form of Application 1 with Functional Flexibility...85
Figure 27 Architectural Form of Application 1 with Capacity Flexibility...86
Figure 28 Distributed realization of Application 1 ... 88
Figure 29 The Three Dimensions Realized...89
Figure 30 Market diffusion prediction...96
Figure 31 Cash Flows under certain demand...97
Figure 32 Predicted 3G units sold with uncertainty (delayed 3G rollout)...98
Figure 33 Cash Flow under uncertain demand...99
Figure 34 Relative advantage of Flexible DSP...100
Figure 35 NPV Gain with increased Activation Cost...101
Figure 36 Mapping Design Flexibility Options to Financial Options...110
Figure 38 D iffusion Curve...113
Figure 39 Black Scholes Valuation of Flexible CPU Architectures...114
Figure 40 Asset value change using the Binomial model (Adapted from [17])...115
Figure 41 Binomial method (stage 2). Rolling back to obtain the value of flexibility...117
Figure 42 Components of the Value distribution over time...121
Figure 43 The effect of uncertainty dimensions...122
Figure 44 Causal Diagram of 3G Capacity ... 124
Figure 45 Orthogonal Array for Processor Design using Conjoint Analysis ... 127
Figure 46 W-V Model (Source [24])...129
Figure 47 Kano Requirement Dimensions (Source [24])...131
Figure 48 Alternative Screening Matrix...132
Figure 49 Flexible Design Time Line...133
Figure 50 Boundary for Time to Expiration for an established product...135
Figure 51 Boundary for Time to Expiration for a disruptive product...136
Figure 52 Functional Flexibility as part of the overall Functional objective space...138
Figure 53 Capacity vs. Cost...142
Figure 54 Performance vs. Cost...143
Figure 55 Option Steps for a Flexible Design...148
Figure 56 Flexibility Design Space for maximizing rate of return...153
Figure 57 Unconstrained Flexibility Options...155
Nomenclature
Abbreviations
2G 2nd Generation
3G 3rd Generation
3GPP 3rd Generation Partnership Project ANSI American National standard Institute
ARPU Average Revenue Per User
ASIC Application Specific Integrated circuit
BSC Base Station Controller
CDMA Code Division Multiple Access
CPU Central Processing Unit
DSP Digital Signal Processing
EDGE Enhanced Data for GSM Evolution
ETSI European Telecommunication Standard Institute
FCC Federal Communication Commission
GGSN Gateway GPRS Support Node
GSM Global System Mobile
HLR Home Location Register
ISDN Integrated Services Digital Network
ISUP ISDN User Part
ITU-T International Telecommunication Council - Telecom JPEG Joint Photographic Expert Group
LCD Liquid Crystal Display
MAP Mobile Application Part
MPEG Motion Picture Expert Group
MSC Mobile Switching Center
NPV Net Present Value
OHG Operators Harmonization Group
PDA Personal Digital Assistant
PLMN Public Line Mobile Network
POP Point Of Presence
PV QFD RISC ROA SGSN SIM SM SMS SMSC SOC TCAP TDD TDM TDMA VAS VLR WDCDMA Present Value
Quality Function Deployment Reduced Instruction Set Computer
Real Option Analysis
Serving GPRS Support None Subscriber Identity Module State Machine
Short Message Service
Short Message Service Center System On Chip
Transaction Capability Application Part Time Division Duplex
Time Division Multiplexing Time Division Multiple Access Value Added Services
Visitor Location Register Wideband CDMA
Symbols
A Ca Cf Ci Dfv Dp Dv Fa N(d) Pa r T TcCurrent value of underlying assets Capacity attributes
Flexibility cost vector
Flexibility implementation cost vector Flexibility design option vector
Flexibility design parameter vector Design option vector
Functionality attributes
Value of normal distribution at d Performance attributes
Risk free interest rate Time of expiration Capacity time window
Tf Functionality time window
Tp Performance time window
V Value of call option
Vi Flexibility value vector
Vv Option value vector
X Exercise price
s Volatility of underlying asset
Inv Net Incremental value of Investment
Gixed Cost to the enterprise for fixed design option Glex Cost to the enterprise for flexible design option Vmod Value of a module/feature to the customer
Chapter 1
Introduction
1.1 Motivation
Flexibility is very critical in addressing changing customer needs in the highly competitive market scenario that we see around us nowadays. There is a general recognition that flexibility is a desirable quality if there is bounded uncertainty in the future usage of the system. These uncertainties can be due to dynamic customer needs, technology, corporate strategy, market conditions, competitive scenario, economic and regulatory policies among other factors.
Due to this, a key interest in industry today is to embed flexibility in Product and System Architecture. In order to embark on a research initiative on flexibility, we need to substantiate the dimension and attributes of flexibility and establish the methods by which flexibility can be described in a rigorous but generic fashion.
Flexibility can be understood as the innate ability of a system or product to support new functions and to perform these at some finite range of operating conditions and capacity levels during later stages of its lifecycle. Usually the range of expected behavior is fixed in a specification. One of the definitions of Flexibility in he published literature is the
property of a system that allows it to respond to changes in its initial objectives and requirements
-both in terms of capabilities and attributes- occurring after the system has been fielded [1].
This differs from robustness, where a fixed behavior is specified for an uncertain range of external influences onto the system. It also differs from agility, which is the ability of a system to be modified or adapt itself to wholly unanticipated operating conditions or functional requirements as shown in Figure 1 Flexible Design Objective Space (Adapted from [1])).
Desired Use
Changing
opthmumFixed
Environment
Fixed
Changing
Figure 1 Flexible Design Objective Space (Adapted from [1]))
As mentioned earlier, there is a general recognition that flexibility is a desirable quality if there is bounded uncertainty in the future usage of the system. Flexibility can be used to
address this uncertainty. Flexibility generally comes at the expense of other system characteristics such as performance, robustness or cost.
architecture is no longer financially viable vis-a-vis fixed architectures is very important from the point of view of product design, placement and deployment strategy.
1.2 Objectives
As identified as one of the possible research areas in the Architecture Trade Methodology research initiative [3], the primary research objective of this thesis is in describing, assessing and embedding flexibility in Product and System Architectures. This thesis will contribute to research in architecture flexibility by demonstrating how alternative valuation methods such as conjoint analysis and concept engineering can yield an estimate of product option value, yielding information on the relative value of flexibility options during product design.
Adoption Curve of Flexible Product
Customers
02.0 0 Time
Figure 2 Adoption curve of a flexible product
In particular, the effect of timing between the decision to implement provisions for flexibility in a product ("designing slots") and actually taking advantage of the flexibility ("populating the slots") will be investigated in relation to the underlying industry dynamics.
The proposed framework will be illustrated using the quantitative sample problem of a flexible processor for a wireless handset to demonstrate how a flexible product can be used for a consolidated adoption curve as shown in Figure 2 Adoption curve of a flexible product
1.2.1 Describing Flexibility
Crawley [4] explains that goods and services deliver value to beneficiaries, primarily by acting on one or more operands [4].
Operand
L lAttribute I or igin a I changed Quantiy
Faluer state
Intent-Attribute
Desired System Operating ou cl
State
Consumnables System Operator Eies
Reliability CoktLvl Degree of Safety CsLveAutonomy
The operand in matter transportation systems are passengers and cargo. In information
transfer systems - such as wireless networks -the operands can be real time voice signals,
alphanumeric messages, data files or multimedia data streams. The information transfer process is described by communications theory. The wireless terrestrial networks described in this thesis are made up of a number of different elements such as base stations, transmitters and servers. An important element is the end user terminal (handset), which is either source or sink in the information transfer process. An object-process description for generic systems has been developed by Crawley, see Figure 3: Generic Object-Process-Diagram of System Operating.
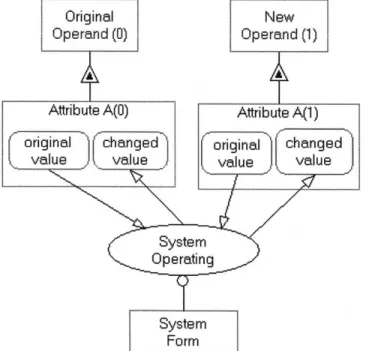
We can refer to this generic view to develop a more specific view of the dimensions of flexibility. Functional flexibility can be expressed as the ability to either effect different types of processes on the same operand, or to effect the same process on different types of operands, see Figure 4 OPD Representation of Flexibility: Functional flexibility.
Original New
Operand (0) Operand (1)
Attribute A(0) Attribute A(1)
original ch an ged original ch nged
value valu a value vlue
System Operating
System Form
Figure 4 OPD Representation of Flexibility:
Operand Beneficiil Abibutes Attbbute Tdna sbSpecific System operating Generic L System --- ---- ---- -----oncept CRpacity Anibutes Transfouning Operating
C apac ity C apac ity Specific
Atttibutes Attnbutes System
- - - ---- -- ~~ ~~ -- ~ -- - ~- ~~ Form
--- ---I ~Petformance Attibvtes
F T5aPpforming Operatiog
CPepa ciaPerformance Form
Atttibutes AttAbnyi. Attibutes
Resource AtttnbwesI
Transforiting Operating
Resoutce Resource
Atttibutes Attjibutes
Figure 5 OPD Representation of Flexibility: Capacity and Performance Flexibility
The notion of performance can be understood as the difference between the changed state and the desired state, capacity is related to the quantity (amount of) operand see Figure
5 OPD Representation of Flexibility: Capacity and Performance Flexibility.
These dimensions would be defined by the range of the Performance and the Capacity related attributes which are part of the transforming attribute of the primary intent and the operating attribute of the process. There is another class of attributes which are
"Resource Attributes" (e.g. Cost) , which would set the constraints for the architectural
tradeoff and cost/benefit analysis.
Product flexibility can be achieved by activating dormant features or adding to existing features to provide enhanced functionality along these dimensions at a later part of product life cycle.
Why Three Dimensions?
Product flexibility could mean flexibility in multiple features of a product. A rigorous analysis, which includes quantification of the range of such features, accessing the cost and value of embedding this range of features would be a complex task.
We used Crawley's architectural framework [4] to derive three categories of favorable
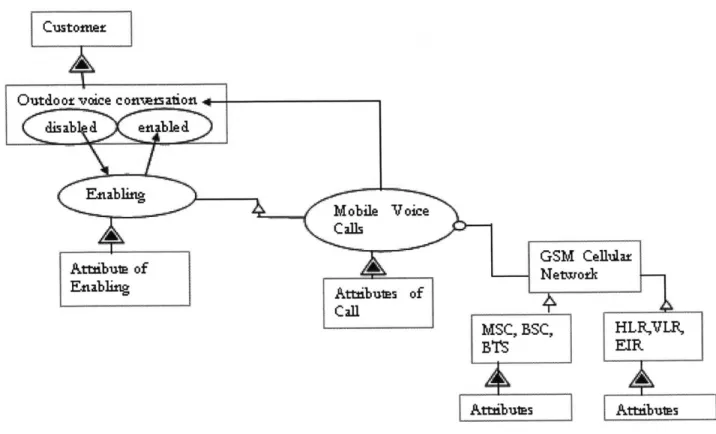
-Transformation of the beneficial attributes of the primary intent: Almost all products, transform one or many beneficial attributes. The Transformation process defines the first category of flexibility dimension. For example
Figure 6 Intent-Process-Object Diagram for 2G GSM Network, shows that the primary intent of enabling outdoor voice conversation is enabled by the process of mobile voice call. The Transformation process acts on a set of attributes. We can also see them as inputs to the transformation function.
The second dimension is defined by the volume of these inputs. In the example shown in Figure 6 Intent-Process-Object Diagram for 2G GSM Network, this dimension will drive the (traditional) voice calls capacity supported by the network. The set of attributes that are transformed, have a "rate" of transformation.
The third dimension is defined by this rate. In the example shown in
Figure 6 Intent-Process-Object Diagram for 2G GSM Network, this dimension can be characterized how fast the primary intent is transformed (rate of enabling of voice conversation). This will drive the (traditional) peak calls/second metrics of the network.
We should remember, however, that there could be attributes that are related to the operation of a product and those could have a set of parallel flexibility dimensions apart of these three. An example of an operating performance measure might be the Mean Time Between Failure (MTBF).
Thus the motivation for the classification of the flexibility dimensions is due to two important reasons:
1. Ease of identification of the "features" that would make the product flexible. 2. Ease of quantification of the range of these features.
CustormNw
Outdo or voice c onrs ation
C it ab d e np d fle Enabling Mobile Voice Calls GSM Celhdar Attibute of Ntrz Eabln bttti s v f MSC, BSC, LVR BTS EIR Atttibu s L At:!ibu
Figure 6 Intent-Process-Object Diagram for 2G GSM Network
The objective of this thesis is to quantify a range of the functional, performance and
capacity attributes which would make the product "flexible" and then analyze the tradeoff between the resource attributes and the value delivered due to flexibility.
The Functional, Capacity and Performance flexibility dimensions are the "results" of a flexible product. These dimensions an be achieved by Reconfigurability, Platforming and Extensibility [9]. Some ecamples of flexibility dimensions with respect to different industry segments are described in the following sections.
Hardware (Processors)
A processor design optimized for only a particular class of application, leads to the constraint of meeting needs of only one market segment. There is an uncertainty associated with how the application scenario, will evolve. Implementing design features for a flexible feature (e.g. cache architecture), we incur a cost in terms of additional design
effort, complexity and allocation of resources, which detract from traditional performance metrics (for example it may lead to higher power and die cost ).
By implementing flexible design features which enable customization of applications, by enabling of an additional on-chip cache at a later decision point in time we can potentially maximize the net benefit by meeting new market needs which may translate into a higher ASP (average selling price) for each unit when the new features are enabled. These features can be:
" Operating Power Supply range changed to support mobile/desktop functionality. - Multi-Threading enabled for greater CPU performance.
" Security features enabled in wireless handsets for premium market segments. - Additional cache enabled for better performance.
A distributed network application can be designed, keeping in mind the functional,
capacity and performance scalability. Such an application could have "hooks" to add a feature, or increase the application capacity at a later point in time. These features can be
" Capacity of the database increased to meet increased capacity needs
" Additional servers, with different instances of the application running in a load
sharing mode to increase the performance of the network application.
" Additional application features enabled (either on the same server or on different
server).
The software "flexibility" features can be designed and embedded in a product and activated later based on license agreements (increased capacity or functionality). Configurability, which is particularly important from the point of view of software products, can be is perceived as a feature in a product to enable the flexibility dimensions in the future.
Civil Architecture
The concept of extensibility, as defined by Crawley [4] was to enable a system to be scaled up significantly in the future or "organically integrate with a larger systems". For this, he believes that there should be a "master plan" to have a future map of this extensibility
and the interfaces must be designed with this in mind. Provision for expansion slots for an additional bedroom or a new barn under the master plan of a house could be example of this extensibility.
From the context of the dimensions of flexibility, the provision to add an additional bedroom provides a capacity flexibility and provision to add a new barn provides a functional flexibility.
Transportation
Blended Body Wing architecture presents an excellent example of modular platform architecture, which enables flexibility [5]. The use of a single flexible platform enables Boeing to be able to design a system which can be adapted to meet the demands of the market. Boeing invests large amounts of R&D capital investment, in face of uncertainty (it can not predict accurately the demand for either type of aircraft -Commercial, Cargo, and Military, or the quantities of these). By designing a BWB platform as shown in Figure 7 Reusable Components, Boeing can adapt the final mix of products manufactured based on the actual market demand without the need to design a new aircraft from scratch.
Figure 7 Reusable Components (Source [5]): The blue components - cockpit and wings are common among the whole product family. The green and yellow components are customized, while the grey components are unique for each variant.
1.2.2 Assessing Flexibility
The flexibility in each of the dimensions identified in the research effort will be assessed critically from the point of engineering and management domains. The engineering domain would include (among others) performance and cost penalty due to embedding flexibility. Management domain would include analysis of impact of architectural flexibility on the market competitiveness by a financial evaluation of the optimal flexibility options.
1.2.2 Embedding Flexibility
The dimensions of flexibility identified in the definition are investigated to a practical depth to gather further insight in embedding flexibility into products and system architectures. Some of the aspects that are covered include
-- Study of performance, capacity and functionality from the context of network based
wireless applications.
- Formulation of a general model of the dimensions of flexibility for network based
application.
- The overlap of flexibility objective space with the overall objective space. - in other words what are appropriate functional operating modes of the system and what performance bandwidths (upper and lower) bounds are appropriate? de Weck has shown a way to map the Design space to the Objective space using a system model, to evaluate different architectures [3]. The Flexibility objective space can be mapped to a subset of this Objective Space, which would necessitate incorporation of a range of
design space in the overall flexible architecture, see Figure 8 Flexibility Design and Objective .
The identification of the flexibility objective space will depend on factors that would address uncertainties due to dynamic customer needs, technology, corporate strategy, market conditions, competitive scenario, economic and regulatory policies among other factors. An example of this space is shown in Figure 1 Flexible Design Objective Space (Adapted from [1])).
D
s
Sp
Design System Model 3j e
Vector Vector
Objective ace
I
-~ -,- - --Figure 8 Flexibility Design and Objective Space. Adapted from [6].
1.2.3.1 Methodology
The dimensions of flexibility are explored using the components of a wireless
communication network (PLMN). The analysis is used to formulate a generic framework of flexibility in Network Application space.
The framework for determining cost of embedding flexibility for a product is established, based on the quantification of flexible design space as a sub-set of the overall design space for the product. The analysis to determine the value of embedding flexibility is then done using the real options approach. The Black-Scholes model and the Binomial model are presented as methods for computing the economics of financial options. These methods are then applied to computing the value of flexibility options. In order to determine the value of the underlying asset, which is one of the terms needed for the valuation of flexibility, two approaches are presented: conjoint analysis and concept engineering. The bounds of time to expiation are explored. Whenever possible a baseline system/product with no flexibility embedded in it is used as a reference system. Thus flexibility is treated as a "real option in a project", rather than real option on a project. This requires a reinterpretation of time to expiration. The overall framework, mapping the design space to the objective space, with respect to the cost and value of flexibility is shown in Figure 9 Flexibility Framework.
Flexibility Design Vector Objective Space Future Opportunities
(Functionality, Capacity, Performance)
Dp =[Dp1, Dp2]
F(t) =[Nf, Tf, Sf, Mf, Cf
E]
(N=need,
T=technology,
S=strategy
M=market,C=competitors,
E=economy)
6
Value of Flexibility
Cf =[Cf1, Cf2,Cf3]
(Cost of flexibility
design)
Figure 9 Flexibility Framework
Finally, a method is proposed for determining the optimal flexibility design vector and implementing a chain of real option based flexibility strategy. . This approach is based on T. Luehrmann's approach [25] of developing a strategy as a portfolio of, possibly nested, real options.
1.2.3.2 Structure of Thesis
Chapter 1: Defines the scope and objective of the thesis - Describing, Embedding and Assessing Flexibility, in product and system architectures with respect to terrestrial wireless networks and handsets.
Chapter 2 Lists the Literature Reference - publications reviewed and referenced in the thesis. The main focus here is to highlight the difference between embedding flexibility in
products and architectures as "real options in projects" as opposed to the more commonly known options "on projects" or the purely financial options.
Chapter 3 : Describing Flexibility : Proposes the dimensions of flexibility for wireless networks and handsets after analyzing the determinants of diffusion in the respective segments. This treats the outcomes of flexibility, i.e. the ways in which flexibility will primarily benefit the user or customer. This chapter will not specify how flexibility is achieved in a product.
Chapter 4: Embedding Flexibility: Develops a generic model, representing most of the nodes in a wireless network, incorporating the flexibility dimensions identified in Chapter 3. These dimensions are then formally defined and an architectural framework is proposed to realize the three dimensions of flexibility from the point of network applications.
Chapter 5: Valuing Flexibility: Builds a mathematical framework to assessing the value a flexibility design option using the real option analysis. Traditional real options theory
"on" projects is extended to include building flexibility into products incrementally.
Chapter 6: Assessing Flexibility (Parameters): Lists the methods for determining the values of the option parameters identified in chapter 5. We will see that finding the value of the underlying asset and determining volatility are particularly challenging in a product development environment. This also includes estimating the cost of embedding flexibility.
Chapter 7: Builds the strategy to determine the best flexible design vector based on the methods and results of the preceding chapters and states the conclusions, recommendations and future work that can be done to expand the framework proposed in the thesis.
Thesis Roadmap
The information flow organization of the different chapters of the thesis is shown in Figure 10 Thesis Roadmap, to organize the thesis and help the reader.
1. Introduction 2. Literature Review
3. Describing 1 4. Embedding Flexibility Flexibility
5. Valuing Flexibility (Mathematical Framework)
6. Assessing Flexibility (Parameters and Cost)
7. Flexibility Strategy and Conclusion
Chapter 2
Literature Review
2.1 General
Identified as one of the possible research areas in the Architecture Trade Methodology research initiative [3], the primary research objective of the literature review was in the area of describing, assessing and embedding flexibility in System Architectures. This review also includes lecture notes of some of the subjects delivered as part of System Design and Management coursework and patent reviews to identify distributed architecture for wireless networks.
2.2 Description of Flexibility
The definition of flexibility as the property of a system that allows it to respond to changes in
its initial objectives and requirements -both in terms of capabilities and attributes- occurring after the system has been fielded[1] was used as a guideline for the analysis of the outcome or as
referred in the thesis as "dimensions" of flexibility. These are also sometimes referred to as "'outcomes" of flexibility. In any case these dimensions regard product or system
functional attributes that are directly perceived by the customer. Other descriptions of flexibility include - Flexible systems allow owner to adapt operating conditions [7] and the (flexible system) system will have to evolve in the face of changing environments and expectations
[4]. Flexibility is one of the desired "ilities" [34,26] from the perspective of System Engineering and System Architecture under uncertainties. An analysis of the relationship of flexibility with extensibility [4,6,9] was also done.
Identification of the primary determinants of diffusion (anything that will cause a favorable diffusion) for the product, within the market context, was the first step to establish the probable objective space [3] for flexibility. These determinants are indicator of the future trends in the industry and thus drive the flexibility dimensions of a product. This study included analysis of the wireless industry (wireless networks and mobile handset processors) from the context of Technology S-Curves [11,36], industry dynamics [36,18,20] and product diffusion F-,18].Identification of the possible product "features" that will cause a positive diffusion included review of publicly available information in the company web sites cf the key players in the industry and market intelligence data [11, 8, 31,29].Quantification/Definition of the range of these features(s) for wireless handset processors was done based on analysis of the market research data.
In general, flexibility is embedded in products and systems to be able to better respond to new customer preferences or trends, without having to redesign a product from the
ground up.
2.3 Embedding Flexibility
This section answers primarily the question of "how is it done"? Thinking about embedding flexibility in the sense of modular innovation [10], we can distinguish three levels of real options, when embedding flexibility in systems or products [9]:
- Reserving resources: this means that growth potential is assured by leaving
surface area, volume, excess power, computing bandwidth and so forth unused in one generation of the product, such that a future product feature may use this resource, should the option be exercised.
- Designing interfaces: the next step consists in designing interfaces between the
baseline product and the area reserved for the flexible product option. These interfaces can be mechanical, energetic or informational. Industry standards and common interface requirements documents (ICDs) significantly facilitate this step.
- Designing the flexible product feature: This next step consists in actually designing
the flexible product feature into the product, while using the resources and interfaces provided for by the previous design steps.
Finally, the last step of the "embedding flexibility" process is actually implementing the flexible product feature, which is analogous to actually exercising the real option in the product. This research included analysis of the architectural details from the context of a
flexible implementation of wireless network applications. This research was largely
based on publicly available data, patent search [32]. Signaling System 7 [37], provided a good insight of the network protocols. Wireless Network evolution was sufficiently described in Smith and Collin's book on the subject P8]. The ITU-T, ETSI and 3GPP
telecommunication standards were also referred2.
2.4 Assessing Flexibility
A study of the different valuation methods -NPV and Real Options, indicated that Real option is better suited for conditions where there is uncertainty [14,15,16]. A good review of the real option approaches in the existing literature was found in Adam Borison's paper [39]. Some of the approaches that were further investigated, based on the categories described in [39]
-- Classic [17,33] - the absence of data on replicating portfolio for flexible options may make this approach impractical. Since flexible product options in innovative industries are not traded on open security markets it is difficult - and often impossible - to find a replicating portfolio for assessing the value of a particular, flexible product feature as a European or American Call Option.
- Subjective [25,19] method uses a subjective assessment of price and volatility of underlying asset. This approach can be used when this assessment is practically possible and the existence of the assumption of a replicating portfolio exists. In absence of this condition, the results would not be accurate.
- Dynamic Programming [17], shows an alternate way of estimating the option price based on binomial lattice. This falls under the category of "simulation", where a set of potential future evolutions is created on the computer and run against the flexible product architectures.
In order to recommend methods to estimate the option parameters (of the chosen method), Conjoint [21,22] and Kano [24] analysis were investigated. Conjoint analysis was found adequate for subjective assessment of the value of the underlying assets, when used in conjunction to product diffusion data. Kano Analysis [24] provides an estimate how well the "customer satisfaction" scales with "flexibility". The basic
concept is to double check the dimensions of diffusion identified in the Description section, to determine whether or not a customer is willing to pay for a scaled of flexible feature.
The flexibility dimensions (Functionality, Capacity and Performance) are explored to mathematically convey the relationships between Flexible design space and the objective space. System Engineering Methods like QFD [30] was studied and recommended for this transformation. The mathematical notation used to map Design Space to Objective Space were based on Olivier de Weck's paper on Architecture Trade Methodology [3].
The cost of implementing flexible design options for wireless network applications was determined using the server costing data available of relevant servers on company website of Sun Microsystems.
Once an optimum design option is defined, assessed and embedded, we reviewed methods to "nurture" this portfolio .The strategy recommended by Luehrman [25],
where the chosen portfolio is" tracked" to nurture - or populate/develop the fruitful
slots (in his paper, he refers to these as ripe tomatoes) and ignore the unpromising ones, can be used to nurture the flexibility design options. According to this framework each option is assessed using two separate metrics,. First, NPVq, which is the quotient formulation of Net Present Value, which accounts for the value of being able to defer an investment. The second metric, is the cumulative volatility ?*sqrt(t), which captures both the time to expiration as well as the riskiness of the option. Here a large volatility is positive due to the asymmetry of possible option value. The value
of a flexible design option can never be negative. However, the initial investment to purchase the real option by reserving resources, designing interfaces or the product feature itself might be lost.
Chapter 3
Describing Flexibility
3.1 Introduction
Flexibility can be understood as the ability of a sy stem or product to support new features and to perform these at some finite range of operating conditions and capacity levels during later stages of its lifecycle. The new features can be classified in three important non orthogonal dimensions from the perspective of wireless network applications and handsets
As described in Chapter 1, Functional flexibility can be expressed as the ability to either effect different types of processes on the same operand, or to effect the same process on different types of operands, see Figure 4 OPD Representation of Flexibility: Functional flexibility. From the context of wireless network applications and handsets, this would map into the ability to perform additional (or a range of) functions.
Capacity flexibility is related to the quantity (amount of) operand, (ee Figure 5 OPD
Representation of Flexibility: Capacity and Performance Flexibility )and will be defined
by the Capacity attributes. From the context of wireless network applications and
handsets this would map into (among other features) the ability to handle additional (or a range of) quantity of interactions.
Performance flexibility can be understood as the difference between the changed state and the desired state and has a 'rate' component. This would be defined by the range of the Performance attribute, see Figure 5 OPD Representation of Flexibility: Capacity and Performance Flexibility. From the context of wireless network applications and handsets this would map into (among other features) the ability to handle additional (or a range of) interaction rate.
Identification of the primary determinants of diffusion (anything that will cause a
favorable diffusion) from the context of product feature, within the market context, is the first step to establish the probable operating space for flexibility. These determinants are indicator of the trends in the industry and thus drive the flexibility dimensions of a product. Regulation Corp orate, Marketing Y Architecture Strategy Form 01
Beneficiary/ - Need - Goals
0 Customers ComDetitive
C-n
-Environment Downstream Strategies,
Competence Focus of Chapter 3
Technology
Figure 11 Focus of Chapter 3 (adapted from [4])
The upstream influences in identifying the Needs and Goals for a flexible architecture were mapped to Crawley's framework [4], as shown in Figure 11 Focus of Chapter 3
(adapted from [4]).
It should be noted that "a range of" functions, volume and rate of interactions can be either more (Forward Flexibility) or less (Backward Flexibility) with reference to the fixed design.
There are two key steps in this process:
- Identification of the possible product "features" that will cause a positive diffusion. - Quantification/Definition of the range of these features(s) for a flexible product. This
range will be the objective space for the flexible product.
This analysis is done for Wireless Networks and Wireless Handset processors in the subsequent sections. The wireless networks are analyzed from a "long term" perspective, which would be typically 4-5 years, based on the current trends of network convergence
and upgrade. The wireless handset processors, on the other hand, are analyzed from a "short term" perspective of 1-2 years.
End Users
This analysis was deliberately designed to validate the flexibility dimensions from the point of long and short term determinants of diffusion in different segments of the same value chain as shown in Figure 12 Wireless Value Chain.
We were able to identify the possible product "features" that will cause a positive diffusion for both the cases. Definite quantification/definition of the range of these features(s) for a flexible product was done for the "short term" case of wireless handset processors. This was because, in order to define flexibility features with a bounded uncertainty, we found the current market research data on wireless handset processor diffusion, adequate (in contrast to similar data on wireless networks). One of the flexibility feature identified (cache architecture), is used to analyze the value of flexibility in Chapter 5 (Valuing Flexibility)
Once the determinants of diffusion are identified, these are then classified based on similar attributes to derive the flexibility dimensions that would enable the product(s) to operate in a finite range (flexible objective space) in the overall objective space as shown in Figure 8 Flexibility Design and Objective Space. Adapted from [6].
3.2 The Wireless Network
The primary determinants of diffusion for the Wireless Networks are very important to establish the probable operating space for flexibility. These determinants would be an indicator of the trends in the industry and thus drive the flexibility dimensions. In this section, the background of the Wireless Networks is explored, to identify these dimensions.
3.2.1 Network Evolution
The overall reference of performance (and from the context of the, flexibility dimensions) of the wireless networks has historically been on two key areas- Call Capacity and Data rate. Though the apparent indicator of increased performance in the evolution of the 2G networks has been the data rate (9.6 Kbps to 2 Mbps), the carriers are more interested in the capacity scaling that the evolving networks provide (from tens to hundreds of users per cell).
The qualitative performance scale for wire line network evolution is based on cost per subscriber (including the fixed infrastructure cost and variable operating costs). Lower the cost, higher is the relative position in this scale. The Technology SCurves [11] showing the evolution of the wireless networks from 1G to 2G to 3G networks is shown in Figure 13 Wireless and Wire line Network Evolution in North America.
The wireless and wire line S curves have been superimposed to give us an idea of the timeline of evolution and a qualitative view of the comparative performance.
PERFO CE Wireless Network Wireline Network
2000s 3G Wireless Networks
2G Wireless Networks iG Wireless Networks 1980s
1985 Advanced Intelligence Networks
1960s CCS (Common Channel Signaling)
Digital PSTN Service
POTS (Plain Old Telephone Service)
TIME Figure 13 Wireless and Wire line Network
Evolution in North America
Today wireless networks can be set up at fraction of the costs of traditional wireline
networks. This is one of the reasons the third world countries are adopting the wireless networks directly (skipping the wireline evolution phase).
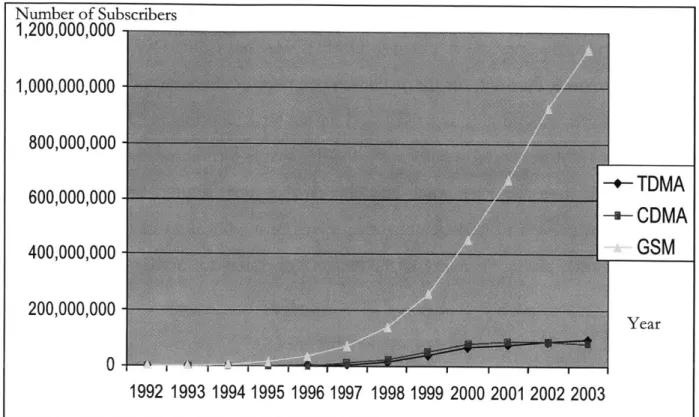
The Wireless Industry is divided by three dominant standards - GSM, TDMA and CDMA3. GSM has evolved as a standard of choice based on overwhelming adoption by users throughout the world as compared to the other two standards [13].
Number of Subscribers Number of Subscribers 1,200,000,000 1,000,000,000 800,000,000 600,000,000 400,000,000 200,000,0 0 0
Figure 14 Diffusion for TDMA, CDMA and GSM.
(Source: [121)
The diffusion curve of GSM is steep due to the Network Effects and positive feedback due to widespread adoption throughout the world as shown in Figure 14 Diffusion for TDMA, CDMA and GSM. (Source: [12]). This diffusion curve is derived using the Lotka Volterra model, which is a simple model of predator-prey interactions.
3 See Appendix A for a-i overview of GSM , TDMA and CDMA frequency allocations and modulation
schemes +
TDMA
-
CDMA
GSM
Year 1992 1993 1994 1995 1996 1997 1998 1999 2000 20012002 2003TDMA and GSM are both based on similar concept of Time division Multiplexing and have joined hands in the "standard tipping" war against CDMA which is considered to be technically superior to TDMA or GSM. This has helped in increasing the installed base of the TDM camp. The global 3G standards are based on CDMA technology. CDMA has higher spectrum efficiency as compared to TDM (TDMA and GSM). Dynamic bandwidth allocation provides flexibility in the maximum number of users supported per cell in
CDMA networks; this number is fixed based on the total timeslots in TDMA and GSM
networks. In TDM networks, adjacent cell interference is a common problem, in cases where the cell sizes are very small and the carriers have limited bandwidths. This problem is not present in CDMA networks, therefore modification of the existing cell structure is easier, giving flexibility to the network operators to modify or expand their networks.
3.2.3 Europe Vs N America in 2G Standard Evolution
ETSI (European Telecommunication Standards Institute) organized the GSM standard, at
the Pan-European level. Europe had faced lot of interoperability problems due the multiple Analog Standards that existed before the 2G migration was decided and was motivated to adopt a common standard to mitigate the interoperability problem in the 2G networks. European Wireless Operators strategy to capture value was to build the installed base based on a consensus standard (GSM).
wireless industry followed the strategy of "Let the Market decide the Standard" strategy.
CDMA did not catch on in Europe because it had not developed fully enough to beat GSM during the selection period that ETSI had set.
3.2.4 3G Network Evolution
3.2.4.1 CDMA -Technological Edge
The Code Division Multiple Access (CDMA) technology was developed by Qualccnm.
CDMA is widely considered a better technology as compared to the Time Division
Multiplexing technology used by GSM and TDMA because of its superior spectral efficiency and lower installation and equipment costs. The Global wireless standards that
are proposed by G3G (Global 3 G Standard Committee) is WDCMA - which is based on
CDMA technology.
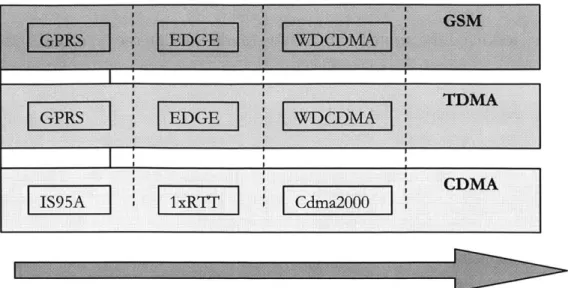
Strategic Alignment [181 of Primary Producers (TDMA & GSM)
In the Evolution to 3G networks, the TDMA and GSM standards aligned to have similar
upgrade paths via GPRS, EDGE and WDCDMA (
Figure 15 Evolution Paths of TDMA, GSM and CDMA) . This alignment was
strategically very important, wherein though the operators would be licensing some portions of the CDMA technology, they could resist the effort of Qualcomm to make
CDMA2000 as the worldwide standard, where Qualcomm would have a substantially
greater share of the overall value and a possible Winner Takes it all situation. The standard war was resolved after many publicized rounds of confrontations.
CDMA
IS95A 1xRTT Cdma2000
Figure 15 Evolution Paths of TDMA, GSM and CDMA
Strategic Alignment of Primary Producers (CDMA & GSM)
Qualcomm and Ericsson (Dominant Player in the GSM Market) had an Intellectual Property deal in 1999, facilitated by the OHG (Operators Harmonization Group). This resulted in the convergence of three paths of CDMA evolution (cdma 2000, WDCDMA and TDD) TDD standards are not yet finalized. WDCDMA was aligned with the GSM and TDMA evolution path.
This aligned the evolution path of CDMA, TDMA and GSM. As part of the agreement, the companies committed to licensing their essential patents for a single CDMA standard, removing all intellectual property restrictions that currently were in force. Ericsson purchased Qualcomm's terrestrial CDMA wireless infrastructure business, including its research and development facilities in San Diego and Boulder, Colorado. In 2001 Qualcomm and Nokia had a similar cross license agreement.
3.2.5 The Future
Due to the efforts of the different standards committee's - the overall wireless industry
seems to have tipped towards the CDMA standard. It is interesting to note that the GSM camp would still retain the value it had created due to the early market penetration, based on strategic alignment with a technically superior standard.
This way, it will be able to use its vast installed base and complimentary assets, without the risk of defection in the future. From the context of flexibility we will analyze the wireless network from the context of a single converged standard.
3.3 Diffusion in the Wireless Industry
As mentioned earlier, the primary determinants of diffusion are very important to establish the probable objective space for flexibility. These determinants would be an indicator of the trends in the industry and thus drive the flexibility dimensions.
The Diffusion in the Wireless Industry can be perceived in at least two dimensions. The first dimension is the traditional voice service, where the industry is currently wooing the "Late Majority". The Determinant for diffusion in this dimension is the support for increased number of subscribers. Wireless network operators want to ensure that they can continue to support their existing subscribers (and continue their subscriber base expansion), before introducing the high bandwidth value added services. From the point of view of the Network operators, Cost of deployment and Spectrum allocation would also guide to a big extent the expansion of the networks.
The second dimension is Value Added Applications, where the wireless industry is in the process of crossing the chasm between the Early Adopters and Early Majority. A key Determinant for diffusion for the wireless industry in this dimension, is the subscriber's need for assessing value added data, while on move (apart from the traditional voice connectivity).Value added data includes localized and personalized data, high bandwidth entertainment data, among others.
3.3.1 The Voice Dimension -Late Majority
Total number of wireless subscribers has grown at a steady rate since 1995(Figure 16 North American Wireless Subscribers) shows the number of subscribers in North America.
160 140 120 100 80- 60-40 20 0 Nu Sul
Elo Nmber O Subscrdbers
(Mi lions) 0 Mark et Peretration (Percent) 1 G5 1B? 1995 iSS5 2000 20012002 200 3nber of bsciers Lal Mjauiy Time
Figure 16 North American Wireless Subscribers
This diffusion, when superimposed on the Technology Adoption Life Cycle Model, currently includes the Early Majority and would be moving towards the Late Majority at the end of 2003 when the projected market penetration is 51 percent. The determinants of diffusion in this dimension are Cost, Capacity and Spectrum allocation, which would determine the economics of optimum service expansion [13].
IN
3.3.2 Cost
The Network operators are very sensitive about the cost of upgrading their networks, where the projected capacity crunch is about 2 years away, based on the current infrastructure. The cost would have a specific impact on the Diffusion of a particular type of network (CDMA, TDMA and GSM). CDMA has a higher initial cost, which would make the GSM, TDMA upgrade option attractive to the carriers in the near term. This makes it imperative to calculate the cost and value of embedding a flexible design option. The cost is part of the "resource attribute of transferring" as shown in Figure 5 OPD Representation of Flexibility: Capacity and Performance Flexibility. The methods to calculate this cost and value are explored in Chapter 5 and Chapter 6.
3.3.3 Capacity
The wireless carriers (network operators) want to ensure that they can continue to support their existing subscribers (and continue their subscriber base expansion), before introducing the high bandwidth value added services. The voice service is a proven
revenue source - data is not yet. This is an important determinant that would affect the
diffusion of wireless network as a whole, where the subscribers are demanding or would demand value added applications (Market Demand).The network capacity in terms of total number of subscribers will directly map into the Capacity dimension of flexibility and is part of the "capacity attribute of transferring" shown in Figure 5 OPD Representation of Flexibility: Capacity and Performance Flexibility. There is a dimension of performance, which will be related to the peak call rate supported by the network,
which is also part of the overall network capacity, and will be part of the "performance attribute of transferring".
3.3.4 Spectrum
The current spectrum restriction per carrier (45 MHz) in particular market limits the
market penetration - and thus diffusion in that market. This is therefore part of the
"resource attribute of transferring" as shown in Figure 5 OPD Representation of Flexibility: Capacity and Performance Flexibility.
3.3.5 Value Added Applications
The value added applications would increase and sustain the subscriber's base.
Some of the applications facilitate increased air time usage, increasing the ARPU (Average Revenue per User).
3.3.5.1 Applications - driving the future
With the industry still looking for the "Killer Application" and innovative startups coming with customized value added applications, to help the network operators capture and retain new market segments once the Chasm [8] between early adopters and early majority is crossed.
Some of the value added applications like Wireless Messaging have expanded the subscriber base to a totally new market segment e.g. the school going teenage segment. These applications are extremely popular in Europe and Asia and are catching up in popularity in the US, where network interoperability issues had prevented the diffusion
of these applications in the past (which have been resolved now). These applications will map into the functional dimension of flexibility.
3.4 Wireless Handset Processors
The next generation wireless handsets are growing increasingly complex. The existing battery technologies have not been able to keep in pace with the advancement of circuit technology and power demand of these handsets. The current trend to temporarily solve this problem is to make the handset more "fuel efficient" using system level energy
conservation methodologies [28]. It is predicted that a 5X improvement in battery life is achievable by carefully applying these methodologies.
A visible trend in the market is the evolution of wireless PDA's and camera phones. The
convergence of the PDA's with cell phones is leading to increased power demands for these complex handheld devices There is also a trend of migration of increasingly complex PC based office and multimedia applications in these handheld devices.
There is a high possibility of increasingly complex mobile applications, becoming popular in the future. The system level energy conservation methodologies involving dynamic frequency and voltage management, pioneered by Intel, might not be sufficient to keep up to the demands of such applications in long run. Strategic alliances between DSP and RISC houses (as seen by the recent alliance between Intel and Analog devices for PXA
800F which targets the GSM/GPRS data application segment) are indicators of
technological trends to address this issue.
In this section, the determinants of diffusion for low power and high performance processors in the wireless segment are explored after analyzing the whole wireless application value chain. This analysis is used to predict the optimal features of such processors (for the next few years), which is critical for early market penetration in a


![Figure 19 Focus of Chapter 4 (adapted from [4])](https://thumb-eu.123doks.com/thumbv2/123doknet/14676633.558130/72.918.146.872.149.501/figure-focus-chapter-adapted.webp)