HAL Id: hal-00655846
https://hal.archives-ouvertes.fr/hal-00655846
Submitted on 2 Jan 2012
HAL is a multi-disciplinary open access archive for the deposit and dissemination of sci-entific research documents, whether they are pub-lished or not. The documents may come from teaching and research institutions in France or abroad, or from public or private research centers.
L’archive ouverte pluridisciplinaire HAL, est destinée au dépôt et à la diffusion de documents scientifiques de niveau recherche, publiés ou non, émanant des établissements d’enseignement et de recherche français ou étrangers, des laboratoires publics ou privés.
The European-Mediterranean Distributed
Accelerometric Data-Base
Antoni Roca, Philippe Gueguen, Stéphanie Godey, Xavier Goula, Teresa
Susagna, Catherine Péquegnat, Carlos Sousa Oliveira, John Clinton, Christos
Pappaioanou, Can Zulficar
To cite this version:
Antoni Roca, Philippe Gueguen, Stéphanie Godey, Xavier Goula, Teresa Susagna, et al.. The
European-Mediterranean Distributed Accelerometric Data-Base. S. Akkar, P. Gülkan, T. van Eck (Eds.). Earthquake Data in Engineering Seismology, Springer, pp.115-128, 2011, Geotechnical, Geo-logical, and Earthquake Engineering, Volume 14, 978-94-007-0151-9. �10.1007/978-94-007-0152-6_9�. �hal-00655846�
The European-Mediterranean distributed
acce-lerometric data-base
Roca, A.(1), Guéguen, P.(2), Godey, S.(3), Goula, X.(1), Susagna, T.(1), Péquegnat C.(2), Oliveira, C.S.(4), Clinton, J.(5), Pappaioanou, C.(6) and Zulfikar, C.(7)
1 Institut Geològic de Catalunya, Barcelona, Spain
2 Laboratoire de Géophysique Interne et Tectonophysique, Grenoble, France 3 European-Mediterranean Seismological Centre, Bruyères-le Châtel, France 4 Instituto Superior Técnico, Lisboa, Portugal
5 Swiss Federal Institute of Technology, Zurich, Switzerland
6 Institute of Engineering, Seismology and Earthquake Engineering, Thessaloniki, Greece 7 Department of Earthquake Engineering, Kandilli Observatory and Earthquake Research Institute, Istanbul, Turkey
Abstract In the absence of an archive for European acceleration data, NERIES
project (2006-2010), among many other topics, aimed at building a distributed data-base of accelerograms to be accessed through a seismic Data Portal (www.seismicportal.eu) open to the scientific and engineering community. After a first survey of the existing accelerometric stations in the Euro-Mediterranean re-gion, to achieve this goal several tasks were developed by the 6 agencies partici-pating in the Project: a detailed characterization of recording instruments and sites of the accelerometric stations; the development of a computer software to deter-mine in a homogenized way a collection of parameter of engineering interest; and the development of a web-portal to manage the access of users to retrieve the pa-rameter values and wave form data. This paper summarizes the different elements of the current operative distributed system for community services on the Euro-pean accelerometric data.
Introduction
At present, European data on earthquake strong motion are available from differ-ent European networks [1, 2, 3, 4,5] and from some compilations [6, 7, 8]. In the absence of an archive for European data, NERIES project [9] among many other topics developed a distributed data-base of accelerograms to provide waveform data, open to the scientific and engineering communities, similarly to what is done in several Worldwide organizations such as COSMOS [10], K-Net [11] and CWB of Taiwan [12].
After a first survey of the existing accelerometric stations in the Euro-Mediterranean region, to achieve this goal several tasks were developed by the 6 agencies participating in the Project: (i) a detailed characterization of the record-ing instrumentation and a brief description of the site properties (geotechnical and installation facilities); (ii) the development of a computer software to determine in a homogenized way a collection of 36 parameter values per component, such as peak, spectral values, duration, and various “intensity” values; (iii) assembling all these parameters together with the seismic event characteristics which originate them; (iv) obtaining an identifier, “UNID” to link each event of each Agency with the EMSC earthquake data bank; (v) assembling the metadata for all the sensors operating at the various networks contributing to the project; and (vi) developing a web-portal to manage the access of users to retrieve the parameter values and wave form data in current seismological and engineering formats (ASCII, SEED, MiniSEED, SAC,…) based on queries dealing with a desired range of parameter values under interest.
The Network Agencies constituting the core implementation group are: Institut Geològic de Catalunya, IGC; Instituto Superior Técnico, IST; Laboratoire de Geóphysique Interne et Tectonophysique, LGIT; Kandilli Observatory and quake Research Institute, KOERI; Institute of Engineering Seismology and Earth-quake Engineering, ITSAK; Swiss Federal Institute of Technology, ETHZ. A total of 25,040 records (components) have been made available, ranging from events of ML1.0 to 7.4 recorded at epicentral distances varying from a few km to over 1000
km. Data, provided from 1995 to today, are recorded with modern digital instru-mentation.
Accelerometric station and event metadata
The first step of the project was to carry out an exhaustive survey of the existing accelerometric networks in the Euro-Mediterranean region, giving an overview of the European situation on accelerometer geographic coverage. This yielded to an inventory of various characteristic data on the operating networks, including status and working procedures, as well as detailed information on the stations specifications. The station metadata includes geographic location, soil condition and instrument technical characteristics among other information.
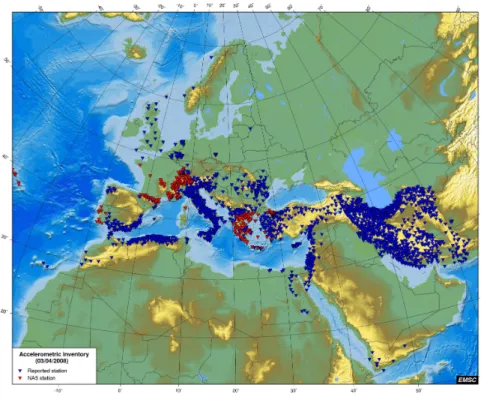
According to this survey a total of 51 networks operate strong motion stations in the Euro-Mediterranean region. Those networks are installed in 39 countries distributed in a large area such as from Yemen to Norway. . As on April 2008, 3695 stations were in operation in the Euro-Mediterranean region, 498 of them being monitored by the 6 Agencies composing the NA5 working group. From the reported stations 52% are installed in buildings and 38% are placed on free-field. A particular attention was given to the stations installed at building basements which represent 86% of those installed in buildings. Digital equipment is used for
78% of the stations. The distribution of accelerometric stations in the Euro-Mediterranean region, with available metadata information, is presented in Figure 1.
Concerning epicentral characteristics of the event recorded by agencies, EMSC has created an identifier, called UNID, to link this event to the EMSC data bank of source parameters. This UNID enables the linkage among all the tables constitut-ing the complete distributed data-base, as it will be described later.
Fig. 1. Distribution of digital and analog accelerometric stations in Euro-Mediterranean
Re-gion (as April 2008).
Standard Processing Procedures: parameter definition and
software description
In addition to the acceleration time series, earthquake engineers usually use vari-ous simplified waveform parameterisations. These can allow simple characterisa-tion of the complex ground mocharacterisa-tion for use in anlysing expected structural re-sponse to the ground motion. Therefore, we provide not only the raw, complete accelerograms, but also the response spectrum and several engineering parameters computed for each record (component). These parameters are used inside the dis-tributed data-base to perform queries on earthquake events and records. To obtain
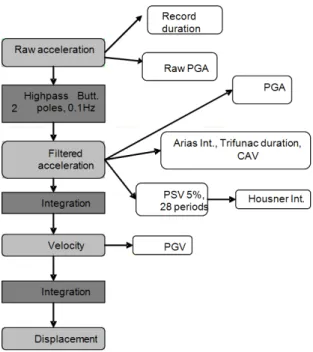
consistency among the parameters of the various data sets it is important to have all them computed in a homogeneous way. Therefore, a standard computation pro-cedure was developed [13] and used by all the contributing accelerometer net-works. A simplified flowchart of this process is shown in Figure 2
Fig. 2. Flowchart for the parameters computation with Software PARAMACC V.8
A more detailed description of the computed engineering parameters [14, 15] and of the computation process is given below.
- Raw acceleration, a(t): acceleration time-history, in cm/s2,
base-line corrected by one degree polynomial approximation fitted by least squares technique.
- Raw PGA: Peak Ground Acceleration, in cm/s2, from raw
accel-eration record a(t).
- High-pass filter (acausal): Butterworth IIR high-pass filter of two poles was implemented, with a cut-off frequency of 0.1 Hz for all re-cords. This value was a compromise to take into account the wide vari-ety of instrument types as well as the difference in resolution among networks, but a way to preserve the homogeneity and to avoid being too restrictive. Filtering was applied in positive time direction as well as in the opposite time direction in order to avoid phase distortion. Data padding has been introduced to avoid low frequency distortion. A number of zeros equivalent to 5% of the time duration has been added, both at the beginning and at the end of signal [16]. No tapering has been applied.
- Filtered acceleration: acceleration time-history obtained after the application of the previously defined filter.
- PGA: Peak Ground Acceleration, in cm/s2, from filtered record. It
is directly obtained from the maximum absolute value of the filtered acceleration time-history.
- AI: Arias Intensity [17], in cm/s. A specific function related to the energy content, calculated as:
- TD: Trifunac duration is the time interval, in seconds, between the 5% and 95% of the Husid function [18]:
- CAV: Cumulative Absolute Velocity, in cm/s, according to the ex-pression:
- PSV (5%): Pseudo-velocity Response Spectrum, in cm/s, com-puted for 28 frequencies logarithmic equally spaced from 0.15 Hz to 39 Hz.
- HI: Housner intensity [19] or response spectrum intensity, in cm. This is the time integral of a 5% damped PSV calculated between 0.1 and 2.5 sec, and gives a measure of the damage potential of the accele-rogram for typical engineered structures.
, with
- Integration: the trapezoidal method (time domain) was used to obtain velocity and displacement time-histories.
- Velocity time history (cm/s): integration of the filtered acceleration time-history - PGV: Peak Ground Velocity, in cm/s. It is directly ob-tained from the maximum absolute value of the calculated velocity time-history, v(t).
- Displacement time history (cm): integrated velocity time history. Note that the cut-off filtering frequency is constant for all the records, irrespec-tive of amplitudes, in order to ensure the homogeneity of the process. As small amplitude records will be contaminated with microseismic noise and long period instability, it was decided that the peak ground displacement (PGD) is not incorpo-rated in the list of computed parameters. Large records would also require a vari-able filter, possibly beyond 10 s, to produce correct displacement estimates. It is beyond the scope of this project to compute automatically PGD in this complex process.
The software PARAMACC was written in Matlab®; the software can be ap-plied automatically to a set of records, and includes an option to visualize the time-histories (acceleration, velocity and displacement) and response spectrum. This last feature is critical for checking the validity of the processing, eliminating corrupted data files. An illustration is presented in Figure 3.
Fig. 3. Visualization mode of a component through the RegisterVisor programme.
First Contributors Dataset
As mentioned before, the core implementation group has contributed with pre-liminary data to the distributed European data-base.
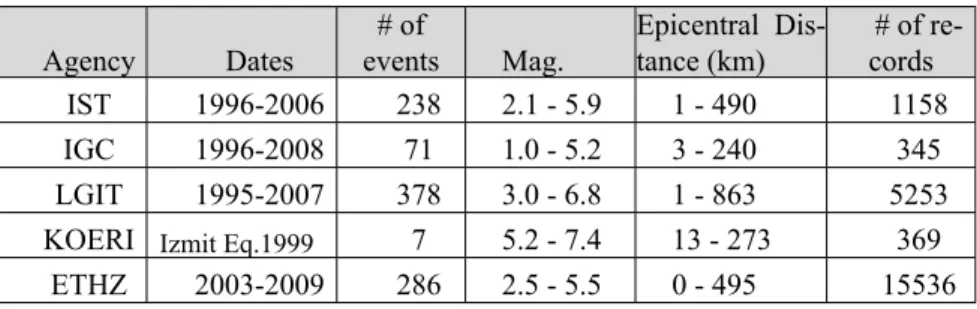
Table 1 shows the number of records (components) processed by each Agency, with reference to the time interval of events and ranges of magnitudes and epicen-tral distances. A total of 25,040 records (components) corresponding to 1,374 events were processed and their parameters analysed.
Table 1. Number of accelerometric records t (as Dec 2009) by Agency, Dates, Magnitude
range and epicentral distance.
Agency Dates # of events Mag. Epicentral Dis-tance (km) # of re-cords IST 1996-2006 238 2.1 - 5.9 1 - 490 1158 IGC 1996-2008 71 1.0 - 5.2 3 - 240 345 LGIT 1995-2007 378 3.0 - 6.8 1 - 863 5253
KOERI Izmit Eq.1999 7 5.2 - 7.4 13 - 273 369
ETHZ 2003-2009 286 2.5 - 5.5 0 - 495 15536
ITSAK 2003-2008 399 2.8 - 6.9 2 - 697 2379 Total 1995-2009 1379 1.0 - 7.4 0 - 863 25040 Data analyzed up to now, certainly not complete, include a number of different situations related to event sizes, hypocenter location, recording stations and dis-tances, and consequently they can be considered a representative sample of the Euro-Mediterranean Region.
All the data will be freely available through the seismic Data Portal and they can always be accessed through each contributing Agency.
A sample of the analyzed data [20] is shown in Figure 4, where PGA’s from accelerograms corresponding to a range of magnitudes between 3 and 4, recorded by RAP and ITSAK are plotted versus epicentral distance. It can be seen the data coherence between the PGA values of the two agencies that provided data sets of very different magnitude range. It can be seen that recording threshold of instru-ments from ITSAK is much higher than those from RAP.
Figure 4. PGA values corresponding to a range of magnitudes between 3 and 4, recorded by
RAP and ITSAK plotted versus epicentral distance.
Definition of waveform data standards and protocols
The European- Mediterranean data-base structure was initially based on the expe-rience of the French Accelerometric data-base [2]. Structure and formats of the tables and core of the database took into account station metadata described in section 1.
Specifications of protocols and formats for waveforms access were defined by the core implementation group. The data server is certainly the less visible part of the system for the data user, but it is essential for collecting, processing and stor-ing the data and information that will allow the dissemination through a sstor-ingle standard system.
Conversion tools from engineering seismology standard formats (ASCII) to seismology standard formats (MiniSEED, SAC) were included in order to increase the dissemination of these data to a larger community. For this reason the acceler-ometric system has been defined (see Figure 5) following this architecture: i) data provider (accelerometric networks), in charge to give access to their data and me-tadata; ii) portal access to the data, for the management of the end-users requests, and iii) the data server, only focused on the processing, the conversion and the download of the data, following the request file transmitted by the accelerometric Portal.
A metadata stream protocol between the seismic Data Portal and data server has been developed. A data request mechanism allows end-users to collect data from the different data-bases already available in Europe, thus creating a distributed archive ( Figure 5), with the features presented in the following sections
Figure 5 Description of the three nodes of the system, between the accelerometric data explorer,
the data providers and the data server [21]
Waveform data
Original primary data stay on each Agency dedicated site for an efficient opera-tivity and a better updating procedure: no central archive was planned, and data can be downloading on request.
Data are waveforms (accelerograms) and engineering parametric data, homo-geneously computed as described in section 3. Moreover, the data are “event
based”, that means that they are explicitly linked to events. Station characteriza-tion is resident at the Acceleracharacteriza-tion Data Explorer on a Stacharacteriza-tion_Table.xls.
Data provider nodes are ftp servers offering protected access to primary wave-forms and partial metadata in two ASCII tables: Events_Table.txt and Parameters_Table.txt.
Data access
Data selectors and data extraction tools implemented at the seismic Data Portal are based in three kinds of criteria: seismological-station parameters (magnitude, distance, soil condition at station, etc.) and engineering parameters (PGA, PSV and other defined in section 3) of the recorded data.
Two different data formats are available, those dedicated to high-level data processing (SEED, MiniSEED, SAC, etc.) and those for applied research (ASCII).
Data in ASCII format will be split in two volumes: the first for accelerograms and the second for parameters (time history parameters and pseudo-velocity re-sponse spectra for 5% damping at 28 frequencies) with a common header.
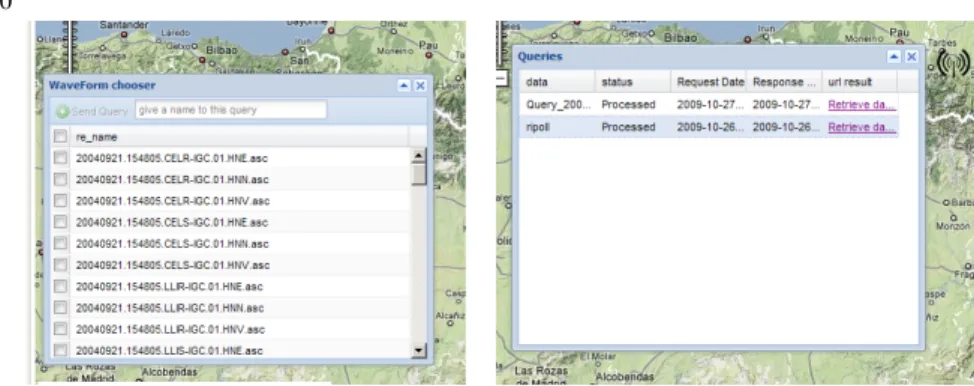
An example of the Acceleration Data Explorer in the seismic Data Portal with the Euro-Med map zoomed in the Pyrenees region, with the epicenters and sta-tions resulting from a request, the list of records available and the status of the download process, in three different windows, is shown in Figure 6.
a)
b) c)
Figure 6: Example of a request to the Acceleration Data Explorer in the seismic Data Portal
with a) the Euro-Med map zoomed in the Pyrenees region, with the epicenters and stations re-sulting from a query “Accelero Search Criteria”. b) The list of records available (“Waveform Chooser “) and c) status of the download process (“Queries”).
Data server
The Station_Table provided by each Agency contains a large number of proper-ties both of the instrument as well as of the site. As far as the instrument, the spe-cific properties such as type of instrument, orientation, sampling, trigger proce-dure, local data access, etc. are included. For site information, the basic geotechni-cal properties and the type of installation facility are given. Poles and Zeros for each instrument will be able to retrieve its transfer function. The data server proc-esses queries and data.
Validation procedure
The following validation procedures were included at various levels by the core implementation group, in order to improve the quality of the entire process:
- At the level of each Agency, besides the increased motivation to better organize the accelerometric data, many inconsistencies were found, from sta-tion properties to event assignments.
- At the level of the entire group, the comparison of data provided by dif-ferent Agencies led to detect outliers, differences in processing data, etc.
- At the level of EMSC, the creation of the “UNID” was a fundamental development widely tested by all participants.
- At the level of the Portal developers, many functionalities were added to render the Portal more friendly-user and extensively tested by the participants.
Long term vision
The number and quality of strong motion accelerometer stations in Europe is in-creasing. A significant number of accelerometers are now being placed in build-ings and other engineered structures such as dams, industrial facilities, bridges and lifelines, in addition to the free-field sites. Moreover, new instruments capabilities are now available, i.e.: weak motion in an extended frequency band, new
tion technologies including real-time communications or high volume data storage in new formats.
Thus, different applications of accelerometric data have been identified, based on: i) different ground motion parametric values; ii) different recording site types; and iii) different recording access, storage systems and formats.
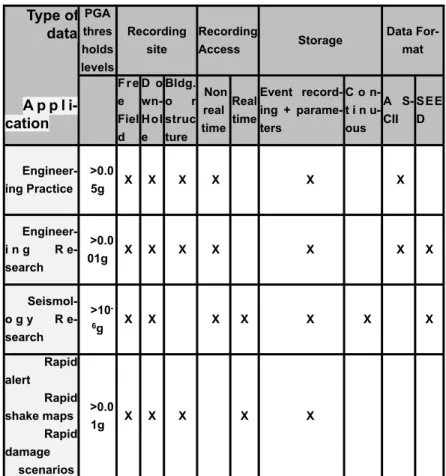
Table 2, summarizes the type of data required by different end-users according to the type of applications.
It is important to take into consideration the different user requirements shown in Table 2 in order to introduce future developments in the Accelerometric data exchange systems toward providing enhanced user oriented service.
We propose to continue the:
Table 2. Summary of the type of data required by different end user applications Type of data A p p l i-cation PGA thres holds levels Recording site Recording Access Storage Data For-mat F r e e Fiel d D o wn-Hol e Bldg. o r struc ture Non real time Real time Event record-ing + parame-ters C o n-t i n u-ous A S-CII SEE D Engineer-ing Practice >0.0 5g X X X X X X Engineer-i n g R e-search >0.0 01g X X X X X X X Seismol-o g y R e-search >10 -6g X X X X X X X Rapid alert Rapid shake maps Rapid damage scenarios >0.0 1g X X X X X
- Gathering user requirements from different communities for improving portal functionalities.
- Continuing efforts to enlarge the current contributing community.
- Securing the future archival of the NA5 datasets and development of a strategy to archive continuous accelerometric data (in real-time).
- Improving station metadata information with site conditions and additional information for accelerometers on structures.
- Creating a formal association of European accelerometric networks. The association would settle institutional agreements, organize periodic meetings among partners, support data interchange protocols, define international rules for network, station codes and formats consensus.
Conclusions
We created in Europe a distributed database of European-Mediterranean accelero-grams. At present, a core implementation group represented by the authors has carried out the developments needed to start the service of providing access to an accelerometric data through a seismic Data Portal. We computed accelerogram parameters from our own databank, with a standard NERIES procedure and put the data freely available. Implementation on the seismic Data Portal (www.seismicportal.eu) has been performed and portal has been validated. Soft-ware and procedures are freely available for candidate agencies to join this dis-tributed data system. Some suggestions for long term sustainability of the system are given emphasizing the end users applications and it is expected that this serv-ice will be continued in time and extended to other agencies.
Acknowledgments This paper has been partially supported by EC Project NERIES, Sixth Framework Programme, Contract number: RII3-CT-2006-026130. Special thanks are due to all author´s Institutions for financial contributions and to Torild Van Eck for reviewing the manu-script.
References
[1] Luzi L, Hailemikael S, Bindi D, Pacor F, Mele F, Sabeta F (2008) ITACA (Italian Accelero-metric Archive): A Web Portal for the Italian Strong-motion Data. Seismological Research Letters, 79: 5.
[2] Péquegnat C, Guéguen P, Hatzfeld D, Langlais M (2008) The French accelerometric network (RAP) and national data center (RAP-NDC) (http://www-rap.obs.ujf-grenoble.fr/). Accessed 27 January 2010.
[4] Akkar S, Çagnan Z, Gülkan P (2009) A predictive ground-motion model for Turkey and its comparisons with recent local and global GMPE´s. 2nd Euro-Mediterranean meeting on ac-celerometric data exchange and archiving. Ankara, 10-12 November.
[5] Vilanova SP, Ferreira MA, Oliveira CS (2009) PAD-1.0 Portuguese Accelerometer Database, CD-Rom, Seismological Research Letters, 80-5:839-844.
[6] Ambraseys NN, Smit P, Berardi R, Rinaldis D, Cotton F, Berge-Thierry C (2000) European Strong-Motion Database. CD-Rom. Collection European Council, Environment and Climate Research Programme, ENV4-CT97-0397. European Database.
[7] Ambraseys, NN, Smit P, Douglas J, Margaris B, Sigbjörnsson R, Ólafson S, Suhadolc P, Costa G (2004) Internet site for European strong motion data. Bolletino di Geofisica Teorica ed Applicata 45, 113-129.
[8] Douglas J, Guéguen P, Chaljub E, Cotton F, Suhadolc P, Costa G, Faeh D, Spühler E, Gosar A, Priolo E, Barnaba C, Paolucci R, Cauzzi C, Eva C (2006) Alpine Accelerometric Data-Base. CDRom.
[9] NERIES Project (2006) Network of Research Infrastructures for European Seismology. (http://www.neries-eu.org/). Accessed 27 January 2010.
[10] Archuleta RJ, Steidl J, Squibb M (2006) The COSMOS Virtual Data Center: a Web Portal for Strong Motion Data Dissemination. Seismological Research Letters, 77-6:651-658. [11] Kinoshita S (2003) Kyoshin Net (K-Net), Japan. In Jennings P, Kisslinger C, Kanamori H,
Lee W (Editors), International Handbook of Earthquake Engineering Seismology, Academic Press, 1049-1056.
[12] Shing TC, Tsai YB, Yeh YT, Lin CC, Wu YM (2003) Strong Motion Instrumentation pro-grams in Taiwan. In Jennings P, Kisslinger C, Kanamori H, Lee W (Editors), International Handbook of Earthquake Engineering Seismology, Academic Press, 1057-1062.
[13] Marsal A, Susagna T, Goula X, Oliveira CS (2008) Implementation of Accelerometric Pa-rameters. Computation and Exchange. NA5-D4 Report, NERIES.
[14] Chen WF, Scawthorn C (2003) Earthquake Engineering Hanbook (New Directions in Civil Engineering). 1512.
[15] Lee W, Kanamori H, Jennings P, Kisslinger C (2002) International Hanbook of Earthquake and Engineering Seismology. Academic Press, International Association of Seismology and Physics of the Earth’s Interior, 1942.
[16] Boore D, Akkar S (2003) Effect of causal and acausal filters on elastic and inelastic response spectra. Earthquake Engineering and Structural Dynamics, 33:1729-1748.
[17] Arias, A (1970) A measure of earthquake intensity. In R.J. Hansen, ed. Seismic Design for Nuclear Power Plants, MIT Press, Cambridge, Massachusetts, 438-483.
[18] Husid R (1973) Terremotos: análisis spectral y características de acelerogramas como base de diseño sísmico. Andres Bello,447.
[19] Housner, GW (1952) Spectrum intensities of strong-motion earthquakes. In Proceedings of Symposium on Earthquake and Blast Effects on Structures. Earthquake Engineering Research Institute, Berkeley, California.
[20] Oliveira CS, Gassol, G, Susagna T, Goula X, Papaioannou C, Guéguen P, Clinton J, Zulfikar C, Godey S (2010) Statistical analysis of European accelerograms parameters homogeneously computed from NERIES Database (submitted to the 14ECEE).
[21] Pequegant C, Jacquot R, Gueguen Ph, Godey S, Frobert L (2010) Distributed archive and single access system for Accelerometric event data: a NERIES initiative (this issue)
![Figure 5 Description of the three nodes of the system, between the accelerometric data explorer, the data providers and the data server [21]](https://thumb-eu.123doks.com/thumbv2/123doknet/14543156.535735/9.892.282.597.667.860/figure-description-nodes-accelerometric-data-explorer-providers-server.webp)