HAL Id: hal-00513270
https://hal.archives-ouvertes.fr/hal-00513270
Submitted on 1 Sep 2010HAL is a multi-disciplinary open access archive for the deposit and dissemination of sci-entific research documents, whether they are pub-lished or not. The documents may come from teaching and research institutions in France or
L’archive ouverte pluridisciplinaire HAL, est destinée au dépôt et à la diffusion de documents scientifiques de niveau recherche, publiés ou non, émanant des établissements d’enseignement et de recherche français ou étrangers, des laboratoires
The construction of a reliable potential for GeO2 from
first-principles
Dario Marrocchelli, Mathieu Salanne, Paul A Madden, Christian Simon,
Pierre Turq
To cite this version:
Dario Marrocchelli, Mathieu Salanne, Paul A Madden, Christian Simon, Pierre Turq. The construction of a reliable potential for GeO2 from first-principles. Molecular Physics, Taylor & Francis, 2009, 107 (04-06), pp.443-452. �10.1080/00268970902845347�. �hal-00513270�
For Peer Review Only
The construction of a reliable potential for GeO2 from first-principles
Journal: Molecular Physics Manuscript ID: TMPH-2009-0036.R1
Manuscript Type: Special Issue Paper - Dr. Jean-Jacques Weis Date Submitted by the
Author: 19-Feb-2009
Complete List of Authors: Marrocchelli, Dario; Edinburgh University
Salanne, Mathieu; Université Pierre et Marie Curie, Laboratoire PECSA
Madden, Paul; University of Oxford
Simon, Christian; Université Pierre et Marie Curie Turq, Pierre; Université Pierre et Marie Curie
Keywords: GeO2, molecular dynamics, infrared spectrum, polarization effects, SiO2
Note: The following files were submitted by the author for peer review, but cannot be converted to PDF. You must view these files (e.g. movies) online.
For Peer Review Only
The construction of a reliable potential for GeO
2from
first-principles
D. Marrocchelli 1, M. Salanne2,3, P.A. Madden 4, C. Simon2,3 and P. Turq2,3 1 School of Chemistry, University of Edinburgh, Edinburgh EH9 3JJ, UK
2 UPMC Univ Paris 06, UMR 7612, LI2C, F-75005, Paris, France 3 CNRS, UMR 7612, LI2C, F-75005, Paris, France and
4 Department of Materials, University of Oxford,
Parks Road, Oxford OX1 3PH, UK
Abstract
The construction of a reliable potential for GeO2, from first-principles, is described. The obtained potential, which includes dipole polarization effects, is able to reproduce all the studied properties (structural, dynamical and vibrational) to a high degree of precision with a single set of parameters. In particular, the infrared spectrum was obtained with the expression proposed for the dielectric function of polarizable ionic solutions by Weis et al. [J.M. Caillol, D. Levesque and J.J. Weis, J. Chem. Phys., 91, 5544 (1989)]. The agreement with the experimental spectrum is very good, with three main bands that are associated to tetrahedral modes of the GeO2 network. Finally, we give a comparison with a simpler pair-additive potential.
1 2 3 4 5 6 7 8 9 10 11 12 13 14 15 16 17 18 19 20 21 22 23 24 25 26 27 28 29 30 31 32 33 34 35 36 37 38 39 40 41 42 43 44 45 46 47 48 49 50 51 52 53 54 55
For Peer Review Only
I. INTRODUCTION
In the vitreous and liquid states, at ambient pressure, germania (GeO2) (a close
struc-tural analog of silica (SiO2)) forms a tetrahedrally coordinated three-dimensional network1.
Because of its lower abundance, its usage in practical applications is much less widespread than for the SiO2. Still, GeO2 is used in several fields, mainly related to optical technologies.
For example, a mixture of SiO2 and GeO2 allows precise control of refractive index in optical
fibres and waveguides. It is of interest to develop simulation methods to allow a detailed examination of the local structure in such mixtures and to predict the infrared spectrum, since this determines the long wavelength limit for their use as optical fibres.
The essential similarity between the structures of glassy GeO2, SiO2 and BeF2 was made
clear by the study of vibrational properties by Galeener and co-workers2 who showed that
the inelastic neutron, infrared and Raman spectra of the different materials were closely related. More recent infrared studies of GeO2 have also been reported3,4. Recently a full set
of partial structure factors were determined in this system by using the method of isotopic substitution in neutron diffraction experiments5,6. The results show that the tetrahedral
network structure is based on corner sharing Ge(O1/2)4 tetrahedra with a Ge-O average
distance of 1.73 ˚A and with a mean inter-tetrahedral Ge-O-Ge angle of 132◦. They also
show that the topological and chemical ordering in the network display two characteristic length scales at distances greater than the nearest neighbour.
Several molecular dynamics (MD) simulations have been undertaken to study the struc-tural and vibrational properties of the disordered phases of GeO2. Classical MD simulations
were performed on glassy and liquid GeO27,8, using pairwise additive potentials with
par-tial charges developed by Oeffner and Elliott (OE) for modeling the α-quartz and rutilelike phases of GeO29. More recently, first-principles molecular dynamics (FPMD) of glassy GeO2
have also been reported10,11. In principle, the amount of empirical information needed to
set up a first-principles calculation is minimal and it would normally be the method of choice to study the physico-chemical properties of condensed phase systems. However, it is computationally very expensive compared to classical molecular dynamics, which is a major drawback when dealing with glassy systems. Classical and FPMD simulations were also compared one with each other in a combined study12for temperatures above 2530 K. In this
study apparent inconsistencies between the properties predicted by the classical simulations
2 1 2 3 4 5 6 7 8 9 10 11 12 13 14 15 16 17 18 19 20 21 22 23 24 25 26 27 28 29 30 31 32 33 34 35 36 37 38 39 40 41 42 43 44 45 46 47 48 49 50 51 52 53 54 55 56 57 58
For Peer Review Only
of different authors are noted. In reality, two different parameter sets were proposed by OE: an original one, which was fitted from an ab initio energy surface, and a so-called rescaled one, which was developed from the previous one in order to give a better reproduction of the vibrational properties. For example, the partial charge of the germanium ion was shifted from 1.5 e in the original potential to 0.94174 e in the rescaled potential. The apparent inconsistencies arise because different classical potentials were being used. Our objective is a single potential which will give a good description of structure and dynamics and allow long simulations on systems of many atoms.
The structure of the simulated system can directly be compared with the neutron / X-ray diffraction experiments. Both classical and FPMD simulation provide structure factors which are in rather good agreement with experiments. For the classical molecular dynam-ics, the most noticeable difference is a shift to high q-values of the first sharp diffraction peak (FSDP), which was observed with both versions of the OE potential7,8. As this peak
is associated to medium range distances5, this means that the Ge-O-Ge bond angle is too
large and the topology of the tetrahedral network is not correctly described. The FPMD simulations provide a diffraction pattern with improved agreement11, but the small size /
timescales explored lead to large statistical uncertainties, mainly in the region of this FSDP. The vibrational properties can also be straightforwardly calculated. The vibrational density of states (VDOS) was estimated from FPMD and classical MD using the rescaled OE po-tential, with an overall reasonable agreement with the available experimental data extracted from inelastic neutron scattering experiments. The infrared absorption spectrum, which originates from the polarization fluctuations associated with motion of the atomic charges, has only been reported from the FPMD simulation. The agreement with experiment2 was
overall good, despite a small shift of the peaks towards lower frequencies.
The dynamical properties which involve structural rearrangements are out of reach of the FPMD. The only studies on GeO2 employ classical MD, and were aimed at determining
the diffusion coefficients in the liquid state7,12. Hawlitzky et al.12 observed important
dif-ferences between their values and those obtained by Micoulaut et al.7; their hypothesis for
rationalizing this discrepancy was inadequate equilibration in the latter. In fact, as noted above, it is due to the use of the two different OE potentials in these studies. Indeed, in simulations performed with the rescaled OE potential the fluidity of the system is enhanced by more than one order of magnitude compared to the results obtained with the original
1 2 3 4 5 6 7 8 9 10 11 12 13 14 15 16 17 18 19 20 21 22 23 24 25 26 27 28 29 30 31 32 33 34 35 36 37 38 39 40 41 42 43 44 45 46 47 48 49 50 51 52 53 54 55
For Peer Review Only
OE potential.
In this work we describe the parameterization of a new classical MD interaction potential for GeO2, by using some techniques we have developed for halides and oxides13,14, which
is entirely based on first-principles electronic structure calculations. In order to provide an accurate, transferable description of the interactions, these potentials include dipole polarization effects and the ions carry full valence charges. The various structural, dynamical and vibrational properties are then compared with the corresponding experimental results. In future work we will use such potentials to study mixtures and the effect of pressure on glassy GeO2
II. INTERACTION POTENTIAL DEVELOPMENT
The interaction model used in this work is related to that used in previous work15,16,
with a couple of minor differences. The model (known as DIPPIM) includes a pair potential, together with an account of the polarization effects which result from the induction of dipoles on the O2− ions. The parameters for these potentials were obtained by force-matching them
to first-principles reference data13. Such an approach was successfully applied in the case
of other oxide materials14. Tangney and Scandolo17 also used a similar interaction model
to study silica, in which all the parameters including partial charges on the ions were fitted against first-principles data. Here we use formal ionic charges (Ge4+, O2−) which should
ensure a better transferability. In the next paragraphs we will give a brief description of the model used, the first-principles reference calculations and the force-matching procedure.
A. The DIPole-Polarizable Ion Model (DIPPIM)
The interatomic potential is constructed from four components: charge-charge, disper-sion, overlap repulsion and polarization. The first three components are purely pairwise additive: Vqq =! i≤j qiqj rij (1) 4 1 2 3 4 5 6 7 8 9 10 11 12 13 14 15 16 17 18 19 20 21 22 23 24 25 26 27 28 29 30 31 32 33 34 35 36 37 38 39 40 41 42 43 44 45 46 47 48 49 50 51 52 53 54 55 56 57 58
For Peer Review Only
where qi is the formal charge on ion i. The dispersion interactions include dipole-dipole and
dipole-quadrupole terms Vdisp=−! i≤j [f ij 6 (rij)C ij 6 r6 ij + f ij 8 (rij)C ij 8 r8 ij ]. (2)
Here C6ij and C8ij are the dipole-dipole and dipole-quadrupole dispersion coefficients, re-spectively, and the fij
n are the Tang-Tonnies dispersion damping function, which describe
short-range corrections to the asymptotic dispersion term. The short range repulsive terms are approximately exponential in the region of physical interionic separations. The full expression used here for the short range repulsion is:
Vrep=! i≤j Aije−aijrij rij +! i≤j Bije−bijrij2, (3)
where the second term is a Gaussian which acts as a steep repulsive wall and accounts for the anion hard core; these extra terms are used in cases where the ions are strongly polarized to avoid instability problems at very small anion-cation separations15. The polarization part
of the potential incorporates dipolar effects only. This reads:
Vpol = ! i,j −"qiµj,αf4ij(rij)− qjµi,αf4ji(rij) # Tα(1)(rij) −! i,j µi,αµj,βTαβ(2)(rij) + ! i 1 2αi | µi | 2 . (4)
Here αi is the polarizability of ion i, µi are the dipoles and T(1), T(2) are the charge-dipole
and dipole-dipole interaction tensors:
Tα(1)(r) =−rα/r3 Tαβ(2)(r) = (3rαrβ− r2δαβ)/r5. (5)
The instantaneous values of these moments are obtained by minimization of this expression with respect to the dipoles of all ions at each MD timestep. This ensures that we regain the condition that the dipole induced by an electrical field E is αE and that the dipole values are mutually consistent. The short-range induction effects on the dipoles are taken into account by the Tang-Toennies damping functions:
fnij(rij) = 1− cije−d ijr ij n ! k=0 (dijr ij)k k! . (6) 1 2 3 4 5 6 7 8 9 10 11 12 13 14 15 16 17 18 19 20 21 22 23 24 25 26 27 28 29 30 31 32 33 34 35 36 37 38 39 40 41 42 43 44 45 46 47 48 49 50 51 52 53 54 55
For Peer Review Only
The parameters dij determine the range at which the overlap of the charge densities affects
the induced dipoles, the parameters cij determine the strength of the ion response to this
effect. It is important to notice that anion-anion damping terms have been taken into account, contrary to what was done in15. The addition of anion-anion damping terms was
found to greatly improve the ability to match the first-principles data.
B. The DFT reference calculations
The parameters in the interaction potential are determined by matching the dipoles and forces on the ions calculated from first-principles on condensed phase ionic configurations13,14. Starting from the empirical pair potential in7, we obtained atomic
config-urations for GeO2 by running short MD simulations on small cells (150 ions); a total of two
liquid configurations were obtained for GeO2; for each of these, the Hellman-Feynman forces
acting on individual ions of the simulation cell were calculated using planewave-DFT code CPMD18. In all the calculations we used norm-conserving pseudopotentials and planewave
energy cut-offs of 1360 eV ; all calculations were performed using the generalized gradient approximation (GGA) according to the Perdew, Burke and Ernzernhof (PBE) scheme. For the calculation of first-principles dipoles, the Kohn-Sham orbitals are localized via a Wan-nier transformation to construct maximally localized WanWan-nier functions (MLWF) and the dipoles determined from the positions of the centres of the Wannier functions associated with each ion19.
C. Fitting procedure
The potential parameters are optimized by fitting the forces and dipoles, obtained with the DIPPIM potentials for the reference configurations, to the respective results from the DFT calculations; the 2 configurations provide a total of about 1800 data points to fit, com-prising three Cartesian force components of each individual ion and three components for the dipoles. While most of the potential parameters are left as free parameters in the fits, there are some exceptions. The O2− polarizability, for instance, was fixed to α
O2− = 11 a.u., i.e.
the value Salmon et al obtained experimentally in5. This value for the oxide polarizability is also compatible with the range of values obtained for this quantity in several magmatic
6 1 2 3 4 5 6 7 8 9 10 11 12 13 14 15 16 17 18 19 20 21 22 23 24 25 26 27 28 29 30 31 32 33 34 35 36 37 38 39 40 41 42 43 44 45 46 47 48 49 50 51 52 53 54 55 56 57 58
For Peer Review Only
melts from first-principles calculations20. One problem in DFT calculations is the
uncon-trolled representation of the dispersion interaction. Although dispersion only contributes a tiny fraction to the total energy, it has a considerable influence on phase transition pressures and on the material density and stress tensor. For this reason, we decided not to include the dispersion parameters in the fits as discussed in13 and to add them afterwards. We used
the parameters in21 for the oxygen terms and rescaled these by the Ge polarizability for the
anion-cation terms. The Gaussian parameters too were added after the fit and then the comparison with the first-principles data was run again to check that its quality remained unchanged.
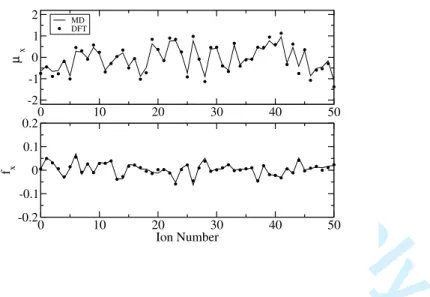
In Figure 1 we report the agreement between the DFT calculated forces and dipoles and those predicted by the fitted potential, for a set of representative ions; the abscissa shows the x component of the forces and dipoles, while the ordinate is simply the ion number. The quality of the representation is quite good and comparable with the one obtained in22;
this can be regarded as a very good result, considering the simplicity of the model (both ion shape deformation effects and quadrupoles are not taken into account in the present model13,14). The parameters obtained for the DIPPIM potential are summarized in Table I.
FIG. 1: Agreement between the DFT calculated dipoles (top panel) and forces (bottom panel) and those predicted by a fitted DIPPIM potential model for a set of 50 representative ions. In each panel the ordinate gives the ion number and the abscissa gives the DFT values of the x component of the forces and dipoles as points and the fitted values as the continuous line.
1 2 3 4 5 6 7 8 9 10 11 12 13 14 15 16 17 18 19 20 21 22 23 24 25 26 27 28 29 30 31 32 33 34 35 36 37 38 39 40 41 42 43 44 45 46 47 48 49 50 51 52 53 54 55
For Peer Review Only
TABLE I: Parameters in the repulsive, polarization and dispersive parts of the DIPPIM potential. All values are in atomic units. The oxide ion polarizability was set to 11 au.
O-O O-Ge Ge-Ge Aij 17.78 40.89 2958 aij 3.893 1.186 5.96 Bij 50000 50000 0 bij 1.1 1.75 / C6ij 44 4 0 C8ij 853 50 0 cij6 1.0 1.0 / cij8 1.0 1.0 / dij6 1.0 1.5 / dij8 1.0 1.5 / dijpol 2.208 1.977 / cijpol 1.770 1.709 /
III. SIMULATION DETAILS
We performed MD simulations in the NV T ensemble through the use of the Nos´e-Hoover chain thermostat method23,24. The simulation cell contained 288 oxide and 144 germanium
ions, and its volume was set to 6856 ˚A3 in order to match the experimental density at 300 K,
which is 3.66 g.cm−3. We used a time step of 1 fs to integrate the equations of motion and the
minimization of the polarization energy was carried out with a conjugate gradient method. The system was studied in both the liquid and amorphous phases.
For the amorphous phase, the system was first equilibrated for 2 ns at the temperature of 4500 K. We have then cooled down the system with a cooling rate of 3.33×10¹¹ K.s−1,
by rescaling the velocities and decreasing the target temperature of the thermostat in order to reduce the temperature by 50 K every 150000 MD steps. Finally, a 5 ns long simulation was undertaken at 300 K, from which we computed all the data presented in this article.
8 1 2 3 4 5 6 7 8 9 10 11 12 13 14 15 16 17 18 19 20 21 22 23 24 25 26 27 28 29 30 31 32 33 34 35 36 37 38 39 40 41 42 43 44 45 46 47 48 49 50 51 52 53 54 55 56 57 58
For Peer Review Only
This procedure was performed with two different potentials, the DIPPIM, and the original OE, which has extensively been used in the literature9. A simulation at 300 K was also
performed with the rescaled OE potential (with one of the configurations obtained from simulations with the original OE potential as a starting configuration) for the study of the vibrational properties.
For the liquid, a series of long simulations with the DIPPIM potential at the temperatures of 3600 K, 3800 K, 4000 K, 4200 K, 4400 K, 4500 K, 4600 K, 4800 K and 5000 K was undertaken. In all the cases, an equilibration run was performed so that the slower species, Ge, moved on average, at least a distance of 5.5˚A; a subsequent run of the same length was made to accumulate enough statistics for the mean-squared displacements curves. At these temperatures, the runs were between 100,000 and 1,000,000 steps. Both the original and rescaled OE potentials were also used within the same simulation conditions at a temperature of 3600 K.
IV. STATIC STRUCTURE
Neutron diffraction experiments with the isotope substitution technique allowed Salmon to determine very precisely the full set of partial radial distribution functions (RDF)5. These
provide a good check of the validity of the potential.
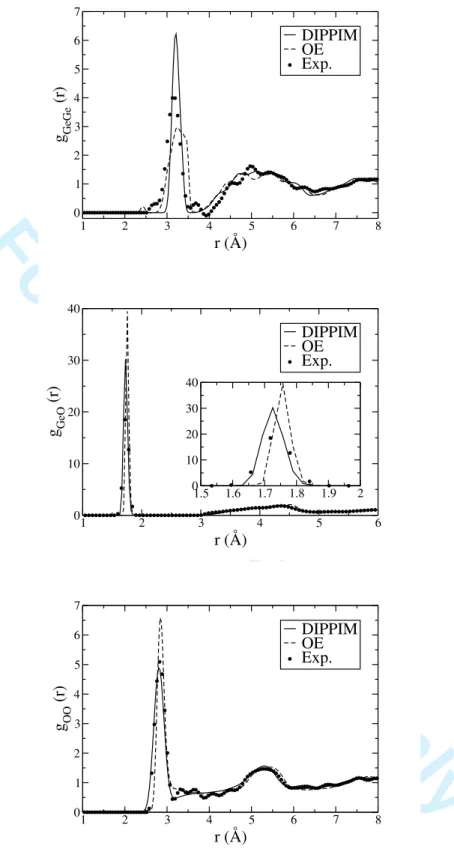
The experimental RDFs are given in figure 2, together with the ones obtained from our simulations at 300 K involving the DIPPIM and the original OE potential; it can be readily observed that our DIPPIM potential gives a closer match with the experimental data than the OE potential, for which all the characteristic first-neighbour distances are slightly overestimated. Concerning the shape of the function, the peaks obtained for the Ge-Ge and Ge-O partials are too sharp but it has be be remembered that other factors, such as system size and cooling rate, also play a role in this aspect of the comparison. The O-O partial RDF is almost in perfect agreement with the experimental one, this is very important since the O2− anions constitute 2/3 of the atoms of the system and their packing arrangement determines the arrangement of the tetrahedral network. The OE potential gives a reasonable description of the static structure (though significantly poorer than the DIPPIM one); one might therefore be tempted to use this potential, due to its simpler form and faster computational time; we will see in the next sections that a reasonable reproduction
1 2 3 4 5 6 7 8 9 10 11 12 13 14 15 16 17 18 19 20 21 22 23 24 25 26 27 28 29 30 31 32 33 34 35 36 37 38 39 40 41 42 43 44 45 46 47 48 49 50 51 52 53 54 55
For Peer Review Only
FIG. 2: Radial distribution functions obtained from the 300 K simulations with the DIPPIM and original OE interaction potentials. These are compared to the experimental ones obtained from neutron diffraction experiments5.
10 1 2 3 4 5 6 7 8 9 10 11 12 13 14 15 16 17 18 19 20 21 22 23 24 25 26 27 28 29 30 31 32 33 34 35 36 37 38 39 40 41 42 43 44 45 46 47 48 49 50 51 52 53 54 55 56 57 58
For Peer Review Only
of the structure might not be sufficient for it to be capable of predicting the dynamical and vibrational properties.
V. DYNAMICS
FIG. 3: Time dependence of the mean squared displacement curves for both the oxygen and germanium ions. The temperatures ranges between 3600 K and 5000 K.
In this section we will calculate diffusion coefficients for the liquid and compare them both with those obtained with the OE potentials and with the experimental values. The diffusion coefficient of species α can be obtained from the slope of the mean squared displacement at long times, i.e.
Dα= lim t→∞ 1 6t $ rα2(t)%, (7) where $ rα2(t)%= 1 Nα Nα ! i=1 $ |ri(t)− ri(0)2 & & > . (8) The mean squared displacement curves were evaluated from a series of long simulations at temperatures between 3600 K and 5000 K; these are shown on a log-log scale on figure 3. No plateau is observed even at the lowest temperature, which shows that the system remains liquid in the range of the study.
The diffusion coefficients were extracted using equation 7; these are reported in figure 4 and compared with those obtained with the OE and rescaled OE potentials. Figure 4 shows
1 2 3 4 5 6 7 8 9 10 11 12 13 14 15 16 17 18 19 20 21 22 23 24 25 26 27 28 29 30 31 32 33 34 35 36 37 38 39 40 41 42 43 44 45 46 47 48 49 50 51 52 53 54 55
For Peer Review Only
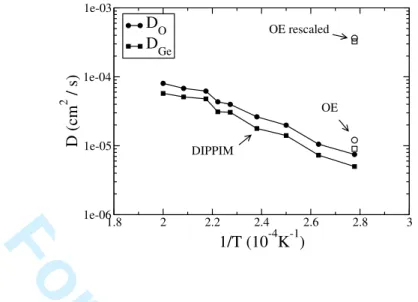
FIG. 4: Diffusion coefficients obtained with a DIPPIM potential at different temperatures; data points obtained with both the original and rescaled OE potentials at 3600 K are also presented.
many interesting features: first of all, our DIPPIM potential gives approximately the same value for the diffusion coefficients as the original OE potential. Hawlitzky et al12 used this
potential to calculate the diffusion coefficients and showed that the obtained values are in good agreement with the experimental ones obtained by converting viscosity data; we can therefore conclude that our DIPPIM potential gives a good agreement with the experimental data as well. A direct comparison with experimental data might be done by using the only published datum (DO = 7×10⁻¹⁰cm2s−1) on the oxygen diffusion constant25, at T =1440 K.
However, such a low diffusion coefficient would involve an impossibly long simulation run. It is also interesting to see that the rescaled OE potential yields too fluid a melt if compared with the original OE and DIPPIM potentials and with experimental data. This potential was used by Micoulaut et al.7 and they indeed obtained diffusion coefficients which were more
than one order of magnitude larger than the values obtained by Hawlitzky et al.12 (who
incorrectly explained this discrepancy in terms of lack of equilibration of the simulations, it is obvious here that the real reason was the difference between the two potentials). The so-called rescaled potential was obtained by taking the normal OE potential and rescaling the ionic charges, the van der Waals coefficient and the repulsive parameters in order to get a better agreement with the experimental vibrational spectrum for the crystal. To do this the parameters which are responsible for the strength of the the O-O and O-Ge short range
12 1 2 3 4 5 6 7 8 9 10 11 12 13 14 15 16 17 18 19 20 21 22 23 24 25 26 27 28 29 30 31 32 33 34 35 36 37 38 39 40 41 42 43 44 45 46 47 48 49 50 51 52 53 54 55 56 57 58
For Peer Review Only
repulsion were lowered by a factor of approximately 2.5; as a consequence, these ions can diffuse much more easily in a softer environment.
VI. INFRARED SPECTRUM
The infrared spectra of ionic melts with polyvalent cations exhibit discrete bands at-tributable to the vibrational motion of the local coordination complexes around the cations. They originate from the polarization fluctuations associated with motion of the ionic charges. The inclusion of polarization effects for the oxide ions in our model may influence the pre-dicted spectrum in two ways26. First, the interactions of the oxide ion dipoles may alter the
local structure of the network and the strength of the bonds, which may introduce a shift of the vibrational frequencies. Second, the induced dipoles will themselves be responsible for absorption, as they too contribute to the total polarization fluctuations.
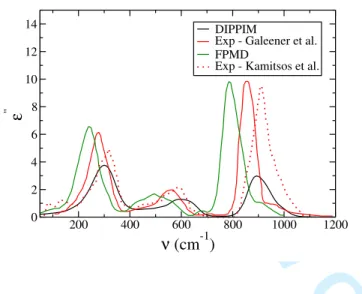
FIG. 5: Imaginary part of the dielectric function, calculated for simulations carried out with the DIPPIM potential, compared to FPMD simulation10 and experimental results2,3.
The absorption coefficient in the presence of these extra moments is calculated from the imaginary part of the total dielectric function [n(ν)α(ν) = 2πν#(%(ν))], which can be determined following Caillol, Levesque and Weis27,28 as
%(ν)− %∞ = β 3%0V " $M(0)2% + 2πıν$M · M%ν (9) +2$M · J%ν + ı 2πν$J · J%ν ' 1 2 3 4 5 6 7 8 9 10 11 12 13 14 15 16 17 18 19 20 21 22 23 24 25 26 27 28 29 30 31 32 33 34 35 36 37 38 39 40 41 42 43 44 45 46 47 48 49 50 51 52 53 54 55
For Peer Review Only
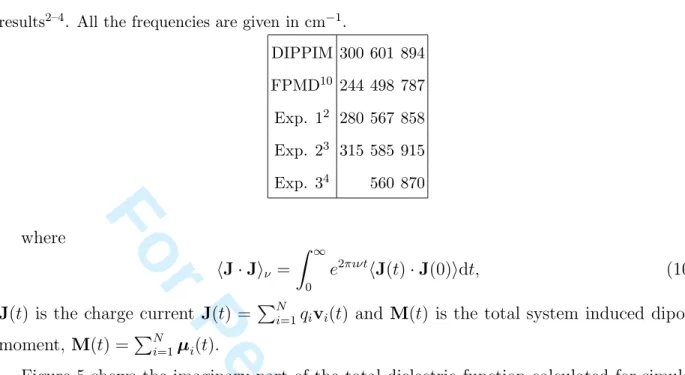
TABLE II: Characteristic frequencies of the imaginary part of the dielectric function as obtained from the DIPPIM model, compared to previous FPMD simulations10,11 and to experimental results2–4. All the frequencies are given in cm−1.
DIPPIM 300 601 894 FPMD10 244 498 787 Exp. 12 280 567 858 Exp. 23 315 585 915 Exp. 34 560 870 where $J · J%ν = ( ∞ 0 e2πıνt$J(t) · J(0)%dt, (10) J(t) is the charge current J(t) = )Ni=1qivi(t) and M(t) is the total system induced dipole
moment, M(t) =)Ni=1µi(t).
Figure 5 shows the imaginary part of the total dielectric function calculated for simula-tions carried out with the DIPPIM potential, compared to the one obtained from FPMD simulations10,11 and from several experiments2,3 (the spectrum proposed by Kamitsos et al.
shows the absorption coefficient, here we transformed it into the dielectric function to facil-itate comparisons). Three main bands are observed on the spectra, in good agreement with the other studies. The corresponding characteristic peak frequencies for the absorption spec-tra are summarized in table II. The agreement is very satisfactory; the frequencies obtained match very closely to the various experimental results (even though these show a significant scatter), while the FPMD simulation seems to systematically underestimate them. The rel-ative intensities of the bands is also in good agreement with experiment, though the highest frequency band at around 894 cm−1 is not intense enough in our spectrum.
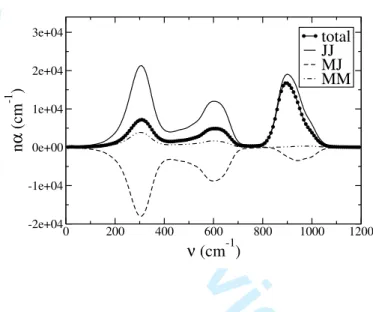
The importance of polarization effects in determining the relative intensities of the bands can be demonstrated by separating the various contributions to the absorption spectrum. In the case of glassy silica26 and beryllium fluoride29, it was observed that the interference
between the induced dipoles and permanent charge contributions to the total polarization, contained in the$M· J%ν cross term, is responsible for the changes of the relative intensities.
Figure 6 shows the decomposition of the absorption spectrum in the case of glassy GeO2.
The two main contributions are the charge fluctuation and the cross term; both show bands
14 1 2 3 4 5 6 7 8 9 10 11 12 13 14 15 16 17 18 19 20 21 22 23 24 25 26 27 28 29 30 31 32 33 34 35 36 37 38 39 40 41 42 43 44 45 46 47 48 49 50 51 52 53 54 55 56 57 58
For Peer Review Only
at the same intensities. Note that the cross-term strongly reduces the intensity of the two low frequency bands relative to that which would be obtained from the charge fluctuations alone, whereas for the high-frequency band the cancellation is much weaker. For the high frequency band the relationship of the charge-charge and cross-terms is different to that found previously for SiO2 and BeF226,29. In the latter cases, the charge-charge and
cross-terms had the same sign, so that the net band intensity was slightly larger than that predicted by the charge-charge term alone. This difference in the behaviour of the calculated spectra might arise from the inclusion of an anion-anion damping term in the polarization part of the interaction potential here, which was not the case for the previous studies.
FIG. 6: Decomposition of the total IR absorption spectrum in its three component parts.
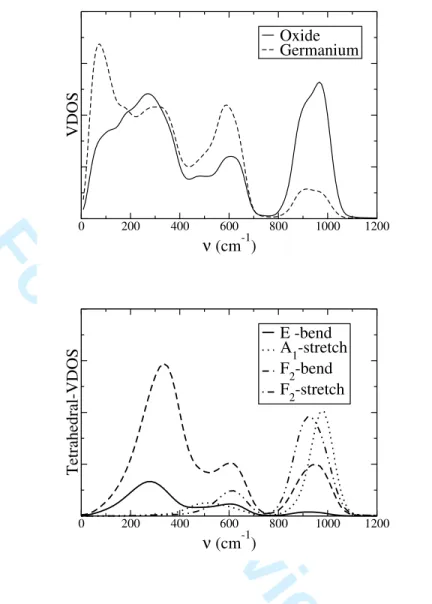
We can now attempt to associate these IR frequencies with the vibrational modes of the system. The upper part of figure 7 shows the vibrational density of states (VDOS) of each ion. Some of these features can be associated to the vibrations of the GeO4 tetrahedra
by comparing them with the tetrahedral-VDOS as obtained from the correlation functions of the velocities of various local tetrahedral symmetry coordinates. The latter would cor-respond to the velocities of GeO4 normal modes, if the tetrahedra were isolated (i.e. not
mechanically linked in a network). For a tetrahedral molecule, vibrational normal coordi-nates ν1 (A1, symmetric stretch), ν2 (E, bend), ν3 (F2, asymmetric stretch) and ν4 (F2,
bend) are expected30. We may obtain velocities associated with the symmetry coordinates
1 2 3 4 5 6 7 8 9 10 11 12 13 14 15 16 17 18 19 20 21 22 23 24 25 26 27 28 29 30 31 32 33 34 35 36 37 38 39 40 41 42 43 44 45 46 47 48 49 50 51 52 53 54 55
For Peer Review Only
of each GeO4 unit. For example, for the symmetric stretching motion
viA= !
iα=1−4
v&iα (11)
where i labels the Ge of a tetrahedral complex, and iα the four oxide anions at the vertices. viα& is the projection of the relative velocity of iα along the i→ iα bond, i.e.
viα& = (viα− vi)· (riα− ri). (12)
Similar expressions may be written down for the velocities of the other symmetry coordinates30. The corresponding DOS is then obtained by a Fourier transform of the
corresponding velocity autocorrelation function:
DOSA(ν) ='
( ∞ 0
e2πıνt$vA
i (t)· viA(0)%dt. (13)
Were the network to vibrate as a collection of isolated tetrahedra, the spectra of each tetrahedral-VDOS would exhibit a single peak corresponding to the characteristic frequency of the corresponding normal mode of vibration. The four tetrahedral-VDOS are shown on the lower part of figure 7, it is clear that it is not the case here. Each spectra consists in the superposition of several bands, which shows the existence of some important coupling between the symmetry coordinates. It is therefore difficult to assign the IR features to the different modes. In particular, all of the three bands observed in the IR spectrum appear in the tetrahedral-VDOS of the bending E and F2 modes. The other F2 modes, which is
associated to some kind of stretching of the tetrahedra, only exhibits the medium and high frequency modes. Finally, the A1 stretching spectrum exhibits two bands at frequencies
centered on the values of 510 and 970 cm−1, which do not appear on the IR spectrum. Such a mode of this symmetry is indeed not expected to be IR active for an isolated tetrahedral molecule, since it corresponds to the symmetric breathing mode. Coming back to the total VDOS of each ion, the low frequency vibrations are not associated to any of the tetrahedral modes. In fact these are due to some slow collective bending of two tetrahedra linked by a bridging oxide anion31, so that they would not appear in the DOS of a single tetrahedron.
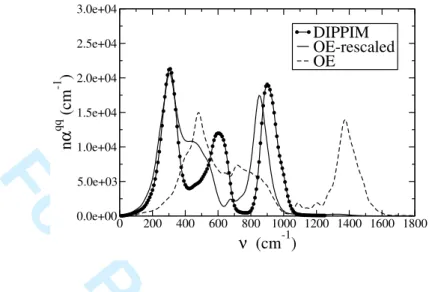
The vibrational properties of the system as obtained with the original and rescaled OE interaction potentials have also been computed. As these potentials do not include any polarization effect, it is only possible to compare the charge-charge current contributions to the IR absorption spectrum with the one obtained with the DIPPIM potential. The
16 1 2 3 4 5 6 7 8 9 10 11 12 13 14 15 16 17 18 19 20 21 22 23 24 25 26 27 28 29 30 31 32 33 34 35 36 37 38 39 40 41 42 43 44 45 46 47 48 49 50 51 52 53 54 55 56 57 58
For Peer Review Only
FIG. 7: The vibrational densities of states, for the DIPPIM, of both type of ions (top panel), and their projections in terms of the A (symmetric stretch), F2 (asymmetric stretch), E (bend), and F2 (bend) modes of the Ge04 tetrahedra (bottom panel).
obtained spectra are given on figure 8. Unsurprisingly, the original OE potential seem to fail completely in describing the vibrational properties of GeO2; this is the reason why the
rescaled OE potential had to be developed. For that potential, the agreement is better, in particular for both the small and high frequency bands. Concerning the medium frequency band, observed at around 604 cm−1 for the DIPPIM potential, it does not appear for the
rescaled OE potential. Instead there appears a shoulder to the small frequency band, for fre-quencies ranging from 400 to 500 cm−1. As these bands were associated to the F2 stretching
1 2 3 4 5 6 7 8 9 10 11 12 13 14 15 16 17 18 19 20 21 22 23 24 25 26 27 28 29 30 31 32 33 34 35 36 37 38 39 40 41 42 43 44 45 46 47 48 49 50 51 52 53 54 55
For Peer Review Only
and bending modes on the tetrahedral-VDOS, this means that this modes are not correctly depicted by the rescaled OE potential.
FIG. 8: Comparison of the charge-charge current contributions to the infrared spectrum obtained with the three different potentials (the two OE curves were rescaled with a factor q2
O/4, where qO is the partial charge carried by the oxide ion in the corresponding potential.
VII. CONCLUSION
In conclusion, the obtained potential seem to reproduce all the studied properties (struc-tural, dynamical and vibrational) to a high degree of precision. Since there was no reference at all to any experimental data in the parameterization of this potential, this represents a strong test of the model reliability. The study of pressurized germania is among our top priorities for future work. The potential is of a similar form to that introduced to describe silicates32; since these potentials have proved to be transferable, we will be able, in the
fu-ture, to focus on GeO2-SiO2 mixtures as well. These mixtures, as already mentioned in the
introduction, attract great interest as they are widely used in optical fibers and waveguides.
Acknowledgements
We thank Philip Salmon for providing his diffraction data. Calculations were carried out at the EaStCHEM computing facility (http://www.eastchem.ac.uk/rcf). DM thanks
18 1 2 3 4 5 6 7 8 9 10 11 12 13 14 15 16 17 18 19 20 21 22 23 24 25 26 27 28 29 30 31 32 33 34 35 36 37 38 39 40 41 42 43 44 45 46 47 48 49 50 51 52 53 54 55 56 57 58
For Peer Review Only
the EPSRC and the CMPC for his PhD funding. This work was carried out under the HPC-EUROPA++ project (project number: 211437), with the support of the European Community - Research Infrastructure Action of the FP7 ”Coordination and support action” Programme.
1 M. Micoulaut, L. Cormier, and G.S. Henderson. The structure of amorphous, crystalline and liquid GeO2. J. Phys.:Condens. Matter, 18:R753–R784, 2006.
2 F.L. Galeener, A.J. Leadbetter, and M.W. Stringfellow. Comparison of the neutron, raman, and infrared vibrational spectra of vitreous sio2, geo2 and bef2. Phys. Rev. B, 27(2):1052–1078, 1983.
3 E.I. Kamitsos, Y.D. Yiannopoulos, M.A. Karakassides, G.D. Chryssikos, and H. Jain. Ra-man and infrared structural investigation of xRb2O.(1 − x)GeO2 glasses. J. Phys. Chem., 100(28):11755–11765, 1996.
4 P.V. Teredesai, D.T. Anderson, N. Hauser, K. Lantzky, and J.L. Yarger. Infrared spectroscopy of germanium dioxide (GeO2) glass at high pressure. Phys. Chem. Glasses, 46(4):345–349, 2005. 5 P.S. Salmon, A.C. Barnes, R.A. Martin, and G.J. Cuello. Glass fragility and atomic ordering
on the intermediate and extended range. Phys. Rev. Lett., 96(23):235502, 2006.
6 P.S. Salmon, A.C. Barnes, R.A. Martin, and G.J. Cuello. Structure of glassy GeO 2. J. Phys.:Condens. Matter, 19(41):415110, 2007.
7 M. Micoulaut, Y. Guissani, and B. Guillot. Simulated structure and thermal properties of glassy and liquid germania. Phys. Rev. E, 73(031504), 2006.
8 J. Peralta, G. Guti´errez, and J. Rogan. Structural and vibrational properties of amorphous GeO2: a molecular dynamics study. J. Phys.:Condens. Matter, 20(14):145215, 2008.
9 R.D. Oeffner and S.R. Elliott. Interatomic potential for germanium dioxide empirically fitted to an ab initio energy surface. Phys. Rev. B, 58(22):14791–14803, 1998.
10 L. Giacomazzi, P. Umari, and A. Pasquarello. Medium-range structural properties of vitreous germania obtained through first-principles analysis of vibrational spectra. Phys. Rev. Lett., 95(7):075505, 2005.
11 L. Giacomazzi, P. Umari, and A. Pasquarello. Vibrational spectra of vitreous germania from first-principles. Phys. Rev. B, 74(15):155208, 2006.
1 2 3 4 5 6 7 8 9 10 11 12 13 14 15 16 17 18 19 20 21 22 23 24 25 26 27 28 29 30 31 32 33 34 35 36 37 38 39 40 41 42 43 44 45 46 47 48 49 50 51 52 53 54 55
For Peer Review Only
12 M. Hawlitzky, J. Horbach, S. Ispas, M. Krack, and K. Binder. Comparative classical and ab initio molecular dynamics study of molten and glassy germanium dioxide. J. Phys.:Condens. Matter, 20(28):285106, 2008.
13 P.A. Madden, R. Heaton, A. Aguado, and S. Jahn. From first-principles to material properties. J. Mol. Struct.:THEOCHEM, 771:9–18, 2006.
14 S. Jahn and P.A. Madden. Modeling Earth materials from crustal to lower mantle conditions: a transferable set of interaction potentials for the CMAS system. Phys. Earth Planet. Inter., 162:129–139, 2007.
15 M.J. Castiglione, M. Wilson, and P.A. Madden. Polarization effects in the simulation of lead (II) fluoride. J. Phys.:Condens. Matter, 11:9009–9024, 1999.
16 M.J. Castiglione and P.A. Madden. Fluoride ion disorder and clustering in superionic pbf 2. J. Phys.: Condens. Matter, 13(44):9963, 2001.
17 P. Tangney and S. Scandolo. An ab initio parametrized interatomic force field for silica. J. Chem. Phys., 117(19): 8898-8904, 2002.
18 The CPMD consortium. CPMD Version 3.x, http://www.cpmd.org. MPI F¨ur Festk¨orperforschung and the IBM Zurich Research Laboratory.
19 A. Aguado, L. Bernasconi, S. Jahn, and P.A. Madden. Multipoles and interaction potentials in ionic materials from planewave-dft calculations. J. Chem. Soc., Faraday Discuss., 124:171–184, 2003.
20 M. Salanne, R. Vuilleumier, P.A. Madden, C. Simon, P. Turq, and B. Guillot. Polarizabilities of individual molecules and ions in liquids from first principles. J. Phys.:Condens. Matter, 20(49):494207, 2008.
21 S.T. Norberg, I. Ahmed, S. Hull, D. Marrocchelli, and P.A. Madden. J. Phys.:Condens. Matter, to be submitted.
22 M. Wilson, S. Jahn, and P.A. Madden. The construction and application of a fully flexible computer simulation model for lithium oxide. J. Phys.:Condens. Matter, 16(27):S2795–S2810, 2004.
23 S. Nos´e. A molecular dynamics method for simulations in the canonical ensemble. Mol. Phys., 52:255–268, 1984.
24 G.J. Martyna, M.L. Klein, and M. Tuckerman. Nos´e-hoover chains: the canonical ensemble via continuous dynamics. J. Chem. Phys., 97(4):2635–2643, 1992.
20 1 2 3 4 5 6 7 8 9 10 11 12 13 14 15 16 17 18 19 20 21 22 23 24 25 26 27 28 29 30 31 32 33 34 35 36 37 38 39 40 41 42 43 44 45 46 47 48 49 50 51 52 53 54 55 56 57 58
For Peer Review Only
25 T. Tokuda and W.D. Kingery. Oxygen diffusion and vaporization rates for liquid and solid germanium dioxide. J. Appl. Phys., 34:2104–2105, 1963.
26 M. Wilson, P.A. Madden, M. Hemmati, and C.A. Angell. Polarization effects, network dynamics, and the infrared spectrum of amorphous sio2. Phys. Rev. Lett., 77(19):4023–4026, 1996. 27 J.M. Caillol, D. Levesque, and J.J. Weis. Electrical properties of polarizable ionic solutions. I.
Theoretical aspects. J. Chem. Phys., 91(9):5544–5554, 1989.
28 J.M. Caillol, D. Levesque, and J.J. Weis. Electrical properties of polarizable ionic solutions. II. Computer simulation results. J. Chem. Phys., 91(9):5555–5566, 1989.
29 R.J. Heaton, R. Brookes, P.A. Madden, M. Salanne, C. Simon, and P. Turq. A first-principles description of liquid BeF2 and its mixtures with LiF: 1. potential development and pure BeF2. J. Phys. Chem. B, 110(23):11454–11460, 2006.
30 E.A. Pavlatou, P.A. Madden, and M. Wilson. The interpretation of vibrational spectra of ionic melts. J. Chem. Phys., 107(24):10446–10457, 1997.
31 K. Trachenko and M.T. Dove. Floppy modes in silica glass under pressure. J. Phys.:Condens. Matter, 14:11431152, 2002 .
32 S. Jahn and P.A. Madden. Structure and dynamics in liquid alumina: simulations with an ab initio interaction potential. J. Non-Cryst. Solids, 353(32–40):3500–3504, 2007.
1 2 3 4 5 6 7 8 9 10 11 12 13 14 15 16 17 18 19 20 21 22 23 24 25 26 27 28 29 30 31 32 33 34 35 36 37 38 39 40 41 42 43 44 45 46 47 48 49 50 51 52 53 54 55