DESIGN OF CENTRAL IRRADIATION FACILITIES FOR THE MITR-II RESEARCH REACTOR
by
PAUL CHRISTOPHER MEAGHER
B.S., Rensselaer Polytechnic Institute 1975
SUBMITTED IN PARTIAL FULFILLMENT OF THE REQUIREMENTS FOR THE
DEGREE OF MASTER OF SCIENCE at the MASSACHUSETTS INSTITUTE OF TECHNOLOGY September, 1976
Signature of Author.. ... ear
En-n--n-Department of-
Sclear
Engin ing,(September 30, 1976) Certified by../.. Accepted by ... Thes_; Supervisor Chairman, Departmental Committee
ARCHIV'ES
L.
4
~7
DESIGN OF CENTRAL IRRADIATION
FACILITIES FOR THE MITR-II RESEARCH REACTOR by
Paul Christopher Meagher
Submitted to the Department of Nuclear Engineering on September 30, 1976 in partial fulfillment of the
requirements for the degree of Master of SCIENCE
ABSTRACT
Design analysis studies have been made for various in-core irradiation
facility designs which are presently used, or proposed for future use
in the MITR-II. The information obtained includes reactivity effects, core flux and power distributions, and estimates of the safety limits and
limiting conditions for operation. A finite-difference, diffusion theory computer code was employed in two and three dimensions, and with three and fifteen group energy schemes. The facilities investigated include the single-element molybdenum sample holder, a proposed double-element irradiation facility and a proposed central irradiation facility design encompassing most of the area of the three central core positions. In
addition, a comparison of the effects of various absorber materials has been made for a core configuration which includes three solid dummies.
Flux levels in the molybdenum holder facility and in the beam ports were calculated for both three and five dummy cores. Flooding the sample tube in these cases was found to increase the safety and operating limits, but not to unacceptable levels for an 8 inch blade height. For the five dummy case, the operating limit in the C-ring was predicted to reach its maximum allowed value at a blade bank height of 13.6 inches. The reactivity effect of flooding was calculated to be 0.19%AK for the five dummy case, in direct agreement with the measured value. Flooging the large sample channel in the double element facility was found to increase the reactivity by 1.56%AK ff and also to cause an unacceptable powerpeaking.
The proposed central irradiation facility is a thermal flux-trap which could produce thermal flux values of up to 2.0 x 10¹⁴ n/cm2sec. Computer
estimates show that flooding this facility's central sample tube would increase this value to 2.5 x 10¹⁴ n/cm2sec, without resulting in an unacceptable
power peak.
Thesis Advisor: D. D. Lanning
3
TABLE OF CONTENTS Page
ABSTRACT 2
LIST OF FIGURES 5
LIST OF TABLES 7
ACKNOWLEDGEMENTS 8
CHAPTER 1 INTRODUCTION 9
CHAPTER 2 CALCULATIONAL METHODS 16
2.1 The Computer Code, CITATION 16
2.2 Cross Section Data 17
2.2.1 Fuel Cross Sections 18
2.2.2 Control Blade Cross Sections 20
2.2.3 Steel and Molybdenum Cross Sections 29
CHAPTER 3 SAFETY LIMIT AND LIMITING CONDITION FOR OPERATION 32
3.1 Safety Limit 32
3.2 Limiting Condition for Operation 34
3.3 Evaluation of the Safety and Operating Limits 35
CHAPTER 4 SINGLE ELEMENT IRRADIATION FACILITIES 44
4.1 Original In-Core Sample Assembly 44
4.2 Molybdenum Sample Holder 46
CHAPTER 5 DOUBLE ELEMENT IRRADIATION FACILITY 54
5.1 Fifteen Group CITATION Study 56
CHAPTER 6 CENTRAL IRRADIATION FACILITY STUDIES 68 6.1 Effect of Various Materials in the Central Facility 69 6.2 Proposed Central Irradiation Facility Design 77
CHAPTER 7 CONCLUSIONS AND RECOMMENDATIONS FOR FURTHER WORK 87
REFERENCES
APPENDIX A
APPENDIX B
APPENDIX C
APPENDIX D
CONTROL BLADE HOMOGENIZATION AND MESH CORRECTION THREE DUMMY CORE CALCULATIONS
THE COMPUTER CODE, LIMITS
SAMPLE CITATION OUTPUT
-96
102 114 121
5
LIST OF FIGURES Page
1-1 Cross Section of the MITR-II Facility 10
1-2 Vertical Cross-section of the MITR-II Core 11
1-3 Horizontal Cross-section of the MITR-II Core 13
1-4 MITR-II Fuel Element 14
2-1 Horizontal Section of the Fixed Absorber Spider 24
with Hafnium Inserts in Place
4-1 Original In-core Sample Assembly Design 45
4-2 Molybdenum Sample Holder Design 47
4-3 Horizontal Section Showing Core Model for 49
Molybdenum Sample Holder
5-1 Horizontal Section of A-ring Core Positions with
Double Element Facility in Place 55
5-2 Two-dimensional Core Model used for Fifteen Group
Steel Sample Calculations 57
5-3 Fast Flux (Radially Averaged Across Steel Sample)
as a Function of Axial Position 60
5-4 Horizontal Section Showing Core Model for Double
Element Irradiation Facility 62
5-5 Fast and Thermal Fluxes along Centerline of
Steel Sample 65
5-6 Fast and Thermal Fluxes across Steel Sample at a
Point Halfway Up Sample 66
6-1 Thermal Flux Along Centerline of Central Irradiation
Facility Filled with Various Materials 74
6-2 Epithermal Flux Along Centerline of Central
6-3 Thermal Flux Plotted Radially from Centerline
of Central Facility for Various Materials 76 6-4 Vertical Cross Section of Proposed Central
Irradiation Facility 78
6-5 Horizontal Cross Section of Proposed Central
Facility with Rectangular Molybdenum Sample Regions 79 6-6 Horizontal Cross Section of Proposed Central
Facility with Cylindrical Molybdenum Sample Regions 86 6-7 Two-dimensional Core Model used for Proposed
Central Facility Calculations 82
6-8 Vertical Section of Proposed Central Facility
Showing Lines of Constant Thermal Flux 85
B-1 Core Power Peaking as a Function of Axial
Position for Element A-2 (plate 1) 107
B-2 Core Power Peaking as a Function of Axial Position
for Element B-15 108
B-3 Core Power Peaking as a Function of Axial Position
for Element C-8 (plate 1) 109
B-4 Thermal Flux as a Function of Axial Position for
Element A-2 110
B-5 Thermal Flux as a Function of Axial Position for
Element C-8 111
B-6 Thermal Flux as a Function of Axial Position for
7
LIST OF TABLES Page
2-1 Energy Structure of the Three and Fifteen Group Cross 19
Section Sets
2-2 Boron-Stainless-Steel Control Blade Composition 27
2-3 Composition of A533 (Type B) Steel Sample 31
3-1 Factors used in Safety and Operating Limit Evaluation 36
3-2 Values of Plenum Flow Disparity (dFP) for Three and Five Dummy Core Configurations
3-3 Comparison of Experimentally Determined and Computer-Generated Values of FR, FA, and Z for a THREE-DUMMY
Core Configuration 39
3-4 Comparison of Experimentally Determined and Computer-Generated (with old Cd Cross Section Data) Values of FR, F , and Z for a FIVE-DUMMY Core Configuration
4-1 Results of Limit Calculations for the Molybdenum Sample 51
Holder
4-2 Results of CITATION Thermal Flux Calculations for the
Molybdenum Sample Holder 53
5-1 Zone Compositions for 15 group Steel Sample Calculation 58
5-2 Results of Three Group Double Element Facility 64
Calculation
6-1 Results of Two-dimensional CITATION Study of Various
Materials in the Central Facility 71
6-2 Results of CITATION Flux Calculations for Various
Materials in the Central Facility 72
6-3 Zone Compositions for 3 group Flux-trap Facility
Calculations 83
7-1 Results of CITATION Flux Calculations for Various
Core Configurations 90
B-1 Results of 3 Dummy+ Core Study
103 B-2 Beam Port Thermal Flux Values Generated by CITATION
ACKNOWLEDGMENTS
The author wishes to thank Dr. D. D. Lanning for his guidance and advice, without which this study could not have been accomplished.
The help of Dr. A. F. Henry, especially in the development of neutron
cross section data, has also been greatly appreciated.
Mr. R. Chin and Dr. G. Allen have taken much of their time to
explain various aspects of the MITR-II, and the techniques used to
study this facility. Their advice and encouragement have been
invaluable. Thanks also go to Rachel Morton for her assistance with
computer codes, and to Cindi Mitaras for her part as typist.
The computations for this report have been done at the MIT
9
CHAPTER I INTRODUCTION
The nuclear reactor facility at the Massachusetts Institute of Technology has been a valuable asset to student instruction and research for many years. Operation began in 1958 with the criticality of the MITR-I core. This design produced a maximum thermal power
of 5 MW with a fully enriched uranium-aluminum alloy fuel, and a
heavy water coolant and moderator. The MITR-I performed well during its planned lifetime and was shutdown in 1974 for a complete core revision.
The new design, called the MITR-II, was developed to provide increased reliability and higher neutron flux levels at the beam ports. Like the MITR-I, the rated thermal power is 5 MW, but the
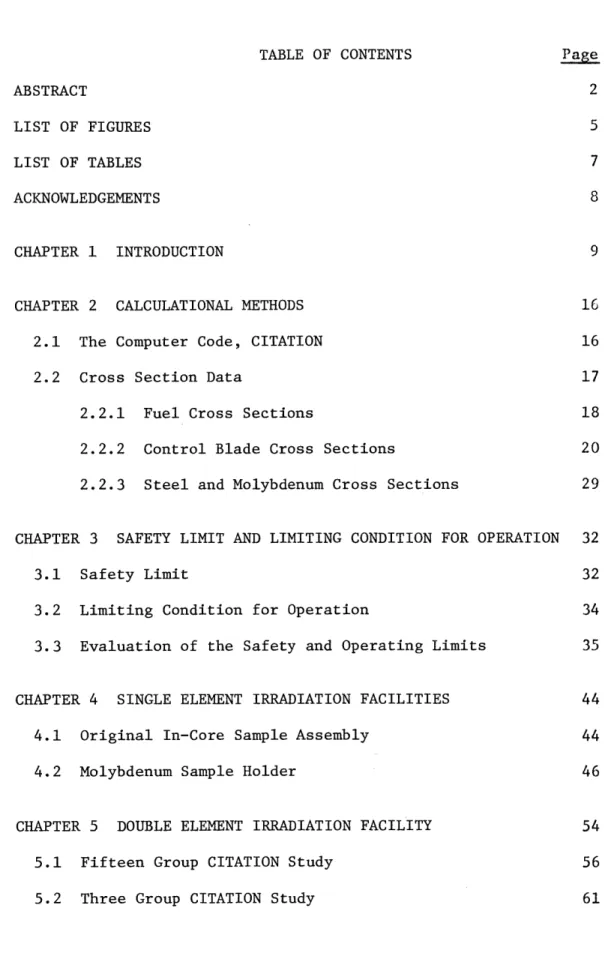
new core is more compact, with a higher power density. A cross section of the facility is shown in Figure 1-1. Light water flows down around the outer edges of the core, and then up through the fuel elements to a large upper plenum. The region surrounding the core tank contains a heavy water reflector which can be dumped as a safety shutdown mechanism. Beam ports extend through the reactor's concrete shielding into the reflector region below the core. These ports allow for sample irradiation in this high flux region or can provide a neutron beam path to instruments located outside the shielding.
Figure 1-2 is a vertical cross section of the MITR-II core.
As shown, fixed neutron absorbers may be positioned in the upper fueled region. These serve to push the maximum reactor power toward
11
FIGURE-1-2. Vertical cross section of the
MITR-II core.
lower
spider
assembly
fixed
absorber
region
core
tank
shim
blade
D
20
the beam ports. In addition, burnup in the upper half of the fuel is reduced. By inverting and reusing once-burned fuel
elements, a longer fuel life can be obtained.
Normal reactivity control is accomplished by the motion of six shim blades and one smaller regulating rod. These absorbers essentially form a ring which shields the core from the surrounding reflector. This orientation can be seen in the horizontal core section of Figure 1-3.
The core itself is hexagonal in cross section, with a 15.0 inch span across the flats. It is composed of up to twenty-seven fuel elements which form three concentric rings. Three positions form the innermost, or A-ring, while the B and C-rings contain nine and fifteen positions, respectively. A single fuel element is pictured in Figure 1-4. Each contains fifteen finned fuel plates held in place by the rhomboid body of the element. The plates consist of an alloy
of thirty-five weight percent uranium (93% enriched) in aluminum,
surrounded by an aluminum cladding.
The MITR-II can be operated with several non-fueled core positions. This allows space for the placement of various experimental facilities
into the core in order to hold materials such as irradiation samples or a neutron source. This research report deals with the evaluation of the experimental facilities which have been used in the MITR-II core. In addition, an investigation is made into the feasibility of several other facilities which have been proposed for future use.
13
core
-hexagonal
fixed absorber region
radial fixed absorber region
- -. Pe I&) Lf-.I' 4
-- -- -- -. - *-- I.L e-
---PA~mJ
LmLe~L
Vcek me' WO
irmn PLATE 5sat ism
z"
VAT t Kv S-OL PLkrC tD4TAIL
FIGURE 1-4. MTTR-II fuel element.
L7-tf"6. 0" Sb
0
0
am ECt-om -b J, MOZZI.L DrT^t%.15
Chapter 2 deals with some of the considerations involved in analyzing in-core facilities and includes the calculational methods required for the neutronic portion of such an analysis. An explanation
and description of the safety limit and limiting condition for operation are contained in Chapter 3. These two technical specification limits place restrictions upon reactor operation in order to avoid power peaking which could produce an adverse effect on fuel cladding
integrity.
Chapters 4, 5 and 6 explain the various facilities studied,
the procedures employed in their evaluation, and the results obtained. Chapter 7 summarizes and draws conclusion about the results, and then goes on to suggest paths which future work might take.
CHAPTER 2
COMPUTATIONAL METHODS
The evaluation and design of an incore assembly for a reactor such as the MITR-II must include consideration of various neutronic effects. For example, the introduction
of too great a volume of water into the core can produce an unacceptable power peaking in adjacent fuel elements. The
effect of an assembly on the thermal neutron flux obtained from the beam ports is also an important factor. In addition, reactivity effects must be investigated in this type of analysis, due to reactor control and safety considerations. Each of
these constraints must be balanced against the desire for attaining the maximum possible neutron flux with the most useful energy spectrum.
In order to perform these evaluations of limiting
conditions and optimum designs, information such as the core power and flux distributions, and K values for various core configurations, must be known. The tool which was most
often used in this research study to find the required information was the computer code CITATION (Ref. 1).
2.1 THE COMPUTER CODE, CITATION
This code is a finite-difference, diffusion theory code which was developed at the Oak Ridge National Laboratory.
17
be used to determine the solution of perturbation and depletion
problems, calculate the adjoint flux, and generate flux-weighted
macroscopic cross sections.
CITATION was run in both the two-dimensional (R,Z) and
three-dimensional (RO,Z) modes, depending upon the core
configurations being modelled and the degree of accuracy
required. This code has the ability, however, of handling
various other geometries.
The neutron energy structure employed for the majority
of the cases was a three group scheme. Fifteen group calculations
were also performed in order to flux-weight fifteen group
cross section sets to a three group structure. The result
of such a "collapse" run is a set of three group macroscopic
cross sections for each different mixture of materials. These
three and fifteen group cross section sets are further described in
the next segment of this chapter.
The core models and finite-difference mesh spacings used
to mockup various core configurations are detailed throughout later chapters.
2.2 CROSS SECTION DATA
The three group cross section set used for MITR-II calculations
was originally developed by Kadak (Reference 2) and Addae (Reference 3).
This set was collapsed from the previously mentioned fifteen group
set which had been modelled after that of Hansen and Roach
difference, diffusion theory code, EXTERMINATOR-II (Reference
5).
The energy structure of the three and fifteen group sets is
listed in Table 2-1.
2.2.1 Fuel Cross Section
In the energy range above 1 ev, the neutron diffusion length is long enough such that the fueled core regions can be considered as homogeneous. In the thermal range, however, the diffusion length is on the same order as the fuel plate thickness. It was therefore necessary to consider the hetero-geneity of the fuel elements in the development of the fuel's thermal cross sections. This was accomplished by iteratively using the transport theory code, THERMOS (Reference
6).
Thefirst step homogenized a single fuel cell (fuel plate and surrounding moderator), while the second went on to homogenize a series of cells into a full element.
Fuel placed in different regions of the core will experience different neutron energy spectrums. This is largely dependent upon nearness to the reactor's reflector. Additional THERMOS calculations were therefore performed by Kadak to obtain homogenized fuel cross sections averaged over the neutron
spectrum radially and axially throughout the core. The resulting thermal cross sections then formed the lowest two groups of the modified Hansen and Roach set, which was
19
TABLE 2-1
ENERGY STRUCTURE OF THE THREE AND FIFTEEN GROUP CROSS-SECTION SETS
Three Group Set: Group
1
2 3
Fifteen Group Set: Group 1 2 3
4
5
6
7
8
9
10 11 12 13 14 15Energy Range (ev)
.00025 - .40
.40 - 3.00 x 10³ 3.00 x 10³ - 10.00 x 10
Energy Range (ev)
3.00 x 10⁶ - 10.00 x 10⁶ 1.4o x 106 - 3.00 x 10⁶ .90 x 106 - 1.40 x 10⁶ .40 x 106 - .90 x 106 .10 x 106 .4ox1o66 17.00 x 10³ -100.00 x 10³ 3.00 x 10³ 17.00 x 10³ .55 x 103 3.00 x 10³ 100 - 550 30 - 100 10 - 30 3 - 10 1 - 3
.4
-00025 1.4
2.2.2 Control Blade Cross Sections
Great care must be taken to ensure the accurate representation
of a strongly absorbing control material in a diffusion theory
calculation. The diffusion theory approximation to the transport
equation breaks down in the presence of such a material. Therefore,
equivalent diffusion theory parameters must be found which
approximate the actual absorption taking place in the control
material. This can be done by the use of blackness theory,
which is detailed in a paper by Henry (Reference 7).
Blackness theory can be readily applied to control blades
which approximate an infinite slab, and in which scattering may
be neglected. The theory first defines blackness coefficients in
terms of the net current and fluxes at either side of the slab:
a(E) +
-(2-1)
(E j+
j-where j and j are the currents at the right and left, respectively.
+ and $~ are the similarly defined fluxes.
The transport equation is then solved inside the slab in order
to find the surface fluxes and currents, producing the following
21 1 - 2E
(Z)
2[l + 3E 4(Z)] (2-2) 1 + 2E(Z)
2[l - 3E 4(Z)]where Z = 2t a(E), and t is the slab's half-thickness. E3 and E are the exponential integrals defined as:
En2Z = 0p nexp[- -]dy (2-3)
(Reference
8
contains tables of these integral functions.)For the thermal range, the functions a(E) and
S(E)
are thenaveraged over the energy spectrum:
E f a(E)* o(E) dE th E fc o (E) dE (2-4) E c {S(E)$o(E)de th E c o o(E) dE
where E is the thermal cut-off energy, and 4o(E) is the flux C
spectrum in the surrounding medium, away from the slab's surface. The value of <a>th provides a measure of the absorption ability of the slab. A value near zero would be very lightly absorbing, while the maximum value of 1/2 would represent a totally black
absorber.
The equivalent diffusion theory parameters, Za and D, are obtained from the spectrum-weighted blackness coefficients by the
use of the following equations:
- <-a><> 1 + /<a>/<>
a 2t 1 -<>/<,>
(2-5)
a
When the blade is composed of layers of different materialsa homogenization correction must be considered. This was the case for the original design of the absorbers in the MITR-II, which
were cadmium clad with aluminum. Values of
Z
and D were founda
for each material region, then combined in a manner which equated the thermal fluxes and currents at each internal interface. The
result of this correction was to produce homogenized equivalent diffusion theory parameters for the blade as a whole.
Before inclusion into a finite-difference code such as CITATION, one additional correction must be made to the Ta and D values. This correction compensates for the effect that the mesh
23
spacing which mocks up the blade region has on the blade's absorption.
The methods used to apply these two corrections were generated
and written into a small computer program by Emrich (Reference 9).
The segment of this program which deals with these corrections was
isolated and modified for the following work. A listing and
description of the required input of the modified code is given
in Appendix A.
The original aluminum-clad, cadmium absorbers of the MITR-II
were used successfully for approximately the first five months of
the core's operation. After this period, swelling of the fixed and
moveable absorbers was noted. It was therefore decided that the
core would be operated for a time without fixed absorbers, and then
eventually be refitted with hafnium fixed absorbers. The six
moveable cadmium blades were replaced one by one with plates of 1.1%
natural boron in stainless-steel. To accurately model prospective
core configurations, it became necessary to develop equivalent diffusion
theory parameters for the hafnium fixed absorbers, and boron-stainless
steel moveable absorbers.
Hafnium Fixed Absorbers
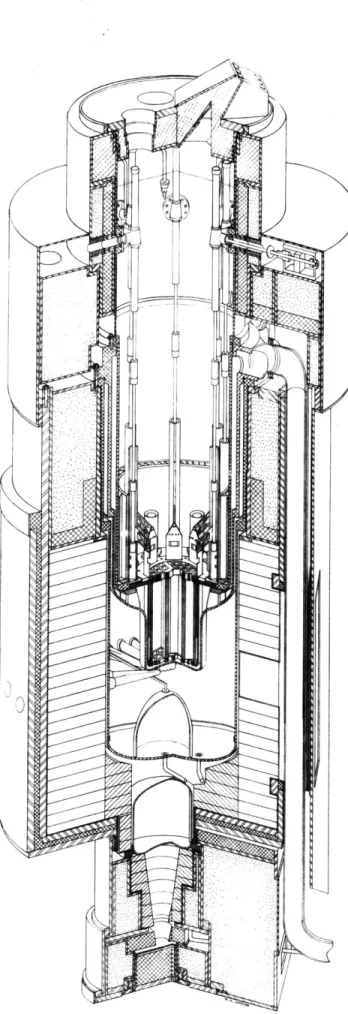
The new fixed absorber design consists of twelve pure hafnium
slab inserts held in position by the central spider assembly, as
shown in Figure 2-1. Each slab is 0.1 inch thick, by 2 inches wide, by 12.3 inches long. With these absorbers in place, the active
(unpoisoned) core height is twelve inches.
Values of <a> th and < >th were determined by employing the
FIGURE 2-1. Horizontal section of the fixed absorber spider with hafnium inserts
in place.
25
spectrum in the thermal range. Z and
I
were then found by use of the modification of Emrich's code which considered homogenizationand mesh-spacing corrections.
It was also necessary to apply blackness theory in the epithermal energy range, due to the significant amount of resonance capture in hafnium. The technique used here was that of Henry, as detailed in Reference
7.
In this work, <c> epi is shown to be given by:<a> . = (2-6)
epi 3 x 10³
3 x 10³
where I = a(E)dE (2-7)
[1 + Y3 (E)]E
The problem was then reduced to that of determining a value for I. To accomplish this, the epithermal energy range was broken up into
three segments. The neutron absorption of each one was considered separately, and the contribution of each segment to the integral (I) was found.
In the first segment, .4 ev to 10 ev, BNL data (Reference 10) was applied to the first of equations (2-2) to obtain the function
a(E). This function was then used to numerically integrate equation (2-7) over the .4 to 10 ev range.
For the second segment, 10 ev to 100 ev, the integration considered absorption due to isolated resonances through the use of Stein's method (Reference 11). The resonance parameters employed
in this analysis by Henry were obtained from Reference 10. Hf
Additionally, a 1/v contribution based on a (.0253ev) = 105 b., a
was included in this segment. In the third segment, from 100 ev to 3 x 10³ ev, only a 1/v cross section was considered.
The individual contributions to I from the three segments were summed to give a total I. The value of <a> epi was determined from equation (2-6), then the homogenization and mesh-spacing corrections were applied to obtain the final values of T and D.
Blackness theory was not required to accurately determine the fast neutron cross sections. A flux-weighting CITATION
collapse run, as described in Section 2.1, was used in this energy range.
Boron-Stainless-Steel Control Blades
The new boron-stainless-steel shim blades are of the same outer dimensions as the old cadmium blades. Internally, each blade consists of two plates separated by a 0.05 inch water gap.
Both plates are composed of 1.1 weight percent natural boron in type 304 stainless steel; Table 2-2 lists the blade's constituents and their densities. In developing the group cross-sections, the elements B, Fe, Cr, Ni, Mn, Si, and C were considered. The others were assumed to have a negligible effect due to their very low
concentrations. The blackness theory technique described in the first part of section 2.2.2 was employed in the thermal range. Simple flux-weighting, by use of a CITATION collapse run, was
27
TABLE 2-2
BORON-STAINLESS STEEL CONTROL BLADE COMPOSITION
Element Weight Percent
B* 1.100 Fe 64.280 Cr 18.450 Ni 13.660 MN 1.750 Si .710 C .040 P .008 S .004
Aluminum-Clad Cadmium Absorbers
The original design of the control materials for the MITR-II consisted of aluminum-clad cadmium for both the fixed and moveable absorbers. The hexagonal fixed absorber, which surrounded the A-ring of elements was composed of a 0.020 inch thich cadmium plate covered with aluminum. The three radial fixed absorbers, and six moveable shim blades
each consisted of a 0.040 inch thick plateof cadmium clad with aluminum.
The group cross sections for the cadmium absorbers were originally developed well before operation of the MITR-II reactor (References 3 & 17). In the epithermal and fast energy ranges, a fifteen group cadmium cross
section set was collapsed into three group form in an EXTERMINATOR-II run. For the thermal range, a modified blackness theory approach was used. When using the cross section set obtained in this manner, it was noted
that CITATION was consistently low in predicting K ff CITATION also underpredicted the thermal flux and power levels of the upper core region, which is the area most affected by the cadmium absorbers. These facts suggested that the cadmium absorption cross sections were too large, causing an unrealistically strong flux depression in the upper core. A new three group cadmium cross section set was therefore generated. For the epithermal and fast energy ranges, a new fifteen group cadmium cross section
set was used in a CITATION collapse code. This procedure produced a
significantly smaller fast neutron absorption cross section, and a slightly smaller epithermal absorption cross section. For the thermal range, the blackness theory method presented at the beginning of section 2.2.2 was
29
It was found that the new three group set produced a K in
closer agreement with experiment than the old set. For a representative case*, the new Keff prediction was low by 1%, as compared with an
underprediction of
4.2%
with the old cross section set. The newset also resulted in more realistic axial power and flux distributions in the core. The thermal flux levels in the beam ports were also affected by the change; the newly calculated flux showed a 12% drop from the old predictions.
Appendix B contains additional comparisons between results
obtained with the old and new cadmium cross section sets, and compares these results with empirically determined data. It also includes the results of a calculation which mocks up an expected future
core configuration of three aluminum dummies in place, and hafnium fixed absorbers at a height of 12 inches.
2.2.3 Steel and Molybdenum Cross Sections
Chapters 4, 5 and 6 are concerned with the analysis of facilities which will allow the in-core irradition of various samples. Two of the materials envisioned for irradiation in these facilities are molybdenum and steel. Molybdenum-98 undergoes a neutron capture reaction which produces the gamma emitter technetium-99m, a nuclide useful in cancer detection. The irradiation of steel samples is useful in the
study of neutron damage on steel's material properties.
*24 fueled elements, 2 aluminum dummies, and old in-core sample assembly in place. Fixed cadmium absorbers at a height of 10
In order to represent these materials in the CITATION code, it was necessary to develop their three group cross-sections. The epithermal and fast cross sections were generated by a CITATION collapse run from a fifteen group set. The thermal cross sections were flux-weighted over the flux spectrum obtained from the THERMOS
code. A533 (Type B) steel, which is used for light water pressure vessels, was the steel sample modeled; its composition is noted in Table 2-3.
31
TABLE 2-3
COMPOSITION OF A533 (TYPE B) STEEL SAMPLE
Element Weight Percent
Fe 97.10 Mn 1.30 Ni .55 Mo .50 C .25 Si .22 P .04 S .04
CHAPTER 3
SAFETY LIMIT AND LIMITING CONDITION FOR OPERATION
The safety limit and limiting condition for operation provide a conservative means of insuring that incipient boiling will not occur at any point in the core. If boiling is prevented, burnout can not occur, and the structural integrity of the fuel
cladding will be maintained.
Derivations of these limits can be found in the MITR-II Safety Analysis Report (Reference 12). The definitions and evaluation procedures which are contained in the following sections have been drawn from the MITR-II Technical Specifications (Reference 13),
and a report by Allen entitled "The Reactor Engineering of the MITR-II Construction and Startup" (Reference 14).
3.1 SAFETY LIMIT
The safety limit is defined as:
Safety Limit FHC F P/FF dF
33
The meanings of the various terms are as follows:
FH - Hot channel enthalpy factor. This term considers uncertainties in reactor power and power density measurement, fuel density, eccentricity, and flow measurement.
FR - Radial peaking factor, the ratio of the power produced in a particular plate to the power produced in the average plate in the core.
FHC - Hot channel factor, the ratio of the power released into the hottest channel to the power released into the average core
channel.
FF - Fraction of the primary coolant which actually cools the fuel.
F - Fraction of the total power generated by the fuel.
dFC - Channel flow disparity. This term considers the maldistribution of flow among the channels of a single element.
dFP - Plenum flow disparity. This considers flow maldistribution among the fuel elements for a particular core configuration.
dF - Flow disparity, the ratio of the coolant flow through the
hot channel to the flow through the average channel in the core.
The safety limit must always be less than or equal to 2.9 at all points in the core.
3.2 LIMITING CONDITION FOR OPERATION
The limiting condition for operation, or operating limit, is defined as follows: - - .466 . [W .2 F FRZF' P F F Operating _ T P R 0 - 1 - A Limit To G d F A where G=F RF A FP 8 ToC F and dd G j F FdF.8 = h A F0, anddF FCFP rn(FFdF)
The terms are defined as follows:
WT - Total coolant flow rate in gallons/minute.
WTo - Two pump coolant flow rate (1800 gallons/minute).
Z - Axial location factor. This is the ratio of the power released into the channel containing the hot spot between the inlet and the hot spot, to the total power released
into the channel.
F ' - Uncertainty factor in determining F Z and in the flow
o R
measurement.
P - Limiting safety system setting of the reactor power (MW).
F A Axial peaking factor, the ratio of the power density in a plate at a certain height to the average power density in the plate.
- Cladding fin effectiveness, ratio of finned plate heat transfer
35
A - Total heat transfer area of the fuel meat (not cladding surface) in ft2.
CP - Coolant heat capacity in BTU/lb-*F.
ho - Normalized heat transfer coefficient for a particular core configuration in BTU/hr-ft2-*F.
F0 - Uncertainty factor in fuel density tolerances and in determining the reactor power, power density, flow, heat
transfer coefficient, and fin effectiveness.
The maximum value of the operating limit in the core must be less than or equal to 3.72 in order to allow operation above a reactor power of 1 KW.
3.3 EVALUATION OF THE SAFETY AND OPERATING LIMITS
The various factors needed to determine the safety and operating limits were evaluated by Allen (Reference 14). Table 3-1 lists these factors for three dummy and five dummy core configurations, and for one and two pump operation. Table 3-2 shows the experimentally determined value of dFP for each fueled position in the three and five dummy cores used in the MITR-II.
In order to find values for the remaining factors (FR, FA, and Z), the power distribution of the core must be known. A CITATION calculation or a plate gamma-scanning procedure can be used to gain this information. Care must be taken however, when CITATION data are used. It has been found that the FR, FA, and Z values predicted by CITATION are, in some
FACTORS USED IN SAFETY AND OPERATING LIMIT EVALUATION Factor FH Ff dfC WT 0 WT/WT (for 2 pump o operation) WT/WT (for 1 pump o operation) F' 0 A
P T(for 2 pump operation)
P T(for 1 pump operation)
C P
h 0
F0
Value for 3-Dummy Core 1.211 1.0
.9487
.887
8.91x10⁵ lbm/hr 1.0.5
1.122 1.9 232.9 ft2 6.0 MW 3.0 MW .9985 BTU/lb-4F 2585 BTU/hr-ft2_oF1.55
Value for 5-Dummy Core 1.211 1.0 .9205
.887
8.91x10⁵ lbm/hr 1.0.5
1.122 1.9 213.5 ft26.o
MW
3.0 MW .9985 BTU/lb0F 2771 BTU/hr-ft2.OF1.55
37
TABLE 3-2
VALUES OF PLENUM FLOW DISPARITY (d ) FOR THREE AND FIVE
DUMMY CORE CONFIGUPKIONS:
3 dummy core - dummies in positions A-1, B-2, and B-8
5 dummy core - dummies in positions A-2, A-3, B-3, B-6 and B-9
Core Position A-1 A-2 A-3 B-1 B-2 B-3 B-4 B-5 B-6 B-7 B-8 B-9 C-1 C-2 C-3
C-4
C-5C-6
C-7 C-8 C-9 C-10 C-il C-12 C-13C-14
C-15Value for 3-Dummy Core
* 1.017
.986
1.o49
*.997
1.007 1.057 1.073 i.o82 * 1.092 .942 .960.981
.977
* *.945
1.011.938
.981
.985
.946
.997
1.025 1.001Value for 5-Dummy Core 1.009 *
1.074
1.049 1.032 1.0581.o84
1.032 *.989
.930.951
.949
* *954
.993
.953
1.019 1.009.944
.944
.972
1.036
*Aluminum dummy location or above-core being taken for these positions.
instances, below the more reliable gamma-scan values. These
underpredictions are most pronounced in areas where local conditions influence a single plate, such as near a water-filled channel.
This is mainly due to the fact that the computer models which are employed can only approximate the true shape of the core power distribution. They can not give detailed power densities at each point in the core, such as
can be obtained by a gamma scan procedure. More detailed CITATION results can be obtained by increasing the number of core mesh points, but if carried too far, the limitations of computer costs and computer
memory size are eventually encountered.
The degree by which CITATION underpredicts the three power distribution factors depends upon the core configuration and core region being considered. Core power data, some of which have been obtained from Reference 14, are listed in Tables 3-3 and 3-4. The first compares experimentally determined
(gamma-scan) values with those obtained from CITATION calculations, for two positions in a three dummy core. For the A-ring, the configuration which is compared includes the old in-core sample assembly (the old
cadmium cross section set was used in the CITATION calculation). For the
C-ring, the three solid aluminum dummy configuration was considered; the
new cadmium cross section set was used here. The second table considers a five dummy core and compares FR values developed from a conservative combination of gamma-scan data and CITATION data, with values from
CITATION data only. "CITATION-only" estimates of FA and Z are compared against gamma-scan values for these factors. Listed for each pair of FyR, FA, and Z values is a prediction factor which is the ratio of the experimental value to the "CITATION-only" value.
39
TABLE 3-3
Comparison of experimentally determined, and computer generated
values of FR, FA, and Z for a THREE-DUMMY core configuration*.
Core Position A-2, next to old in-core sample assembly: FR: gamma-scan valuev+ ue = 2.13 "CITATION-only" value = 1.571 prediction factor = 1.356 Height above fuel bottom (inches) 0 1.1 2.1 6.1 8.0 10.0 14.0 16.0 19.0 24.0 FA Gam-+ Scan 1.573 1.211 1.174 1.329 1.451 1.413 .864 .690 .498 .291 CIT 1.988 1.813 1.685 1.645 1.617 1.335 .738 .570 .388 .263 Pred. Factor .791 .668 .697 .808 .897 1.058 1.171 1.211 1.284 1.106 Gam-Scan+ .000 .068 .122 .345 .463 .594 .796 .866 .946 1.000 z CIT .000 .084 .161 .413 .553 .679 .834 .888 .945 1.000 Pred. Factor 1.000 .810 .758 .835 .837 .875 .954 .975 1.001 1.000 An average of the inner two CITATION channels (for 0=6) was used to obtain
the "CITATION-only" values (old Cd cross sections were used in CITATION run). Core Position C-8, at edge of core:
FR: gamma-scan value+ = 1.527 "CITATION-only" value = 1.341 prediction factor = 1.139 Height above fuel bottom (inches) 0 1.1 2.1 6.1 8.0 10.0 14.0 16.0 19.0 24.0 FA Gam- + Scan 2.200 1.611 1.755 1.846 1.630 1.224 .687 .514 .321 .170 CIT 2.440 2.172 2.028 1.736 1.334 .945 .565 .450 .339 .254 Pred. Factor .902 .742 .865 1.063 1.222 1.295 1.216 1.142 .947 .669 Gam-Scan+ .000 .076 .146 .453 .591 .711 .866 .916 .968 1.000 z CITN .000 .102 .192 .520 .652 .739 .858 .899 .947 1.000 Pred. Factor 1.000 .745 .760 .871 .906 .962 1.009 1.019 1.022 1.000 The outer CITATION channel (0=11) was used to obtain the "CITATION-only"
values (new Cd cross sections were used in CITATION run). (Footnote explanations on following page)
*Dummies in A-1, B-2, and B-8, Cd fixed absorbers at 1 0".
Many of these data are from Reference 14.
+Experimental data from gamma-scanning, blade height = 7.6 inches. ++"CITATION-only" values obtained from computer analysis, blade height
41 TABLE 3-4
Comparison of experimentally determined, and computer-generated (with old Cd cross section data) values of FR, FA, and Z for a
FIVE-DUMMY core configuration*. Core Position A-1, next to solid dummy:
FR: gamma-scan & CITATION value+
R "CITATION-only" value++ prediction factor1 Height above fuel bottom (inches) 0 1.1 2.1 6.1 8.0 10.0 14.0 16.0 19.0 24.0 FA Gam-Scan** 1.250 1.000 .980 1.075 1.085 1.145 1.150 1.035 .730 .715 CIT' 1.709 1.516 1.341 1.027 1.015 1.038 1.023 .953 .831 .727 Pred. Factor .731 .660 .731 1.047 1.069 1.103 1.124 1.086 .878 .983 Gam-Scan** .000 .062 .110 .295 .388 .492 .720 .877 .949 1.000 = 1.430 = 1.250 = 1.144 z CIT-++ .000 .071 .134 .307 .391 .474 .655 .738 .849 1.000 Pred. Factor 1.000 .866 .821 .961 .992 1.038 1.099 1.188 1.118 1.000
(An average of the inner two CITATION channels (for 0=5) was used to obtain
the "CITATION-only" values.)
Core Position C-13, at edge of core: FR: gamma-scan & CITATION value+
R "CITATION-only" value++ prediction factorl Height above fuel bottom (inches) 0 1.1 2.1 6.1 8.0 10.0 14.0 16.0 19.0 24.0 FA Gam-Scan** 1.79 1.35 1.43 1.61 1.58 1.42 .82 .65 .39 .28 CIT 2.238 1.977 1.833 1.576 1.259 .965 .667 .567 .460 .370 Pred. Factor .800 .683 .780 1.022 1.255 1.426 1.229 1.146 .848 .757 Gam-Scan* .000 .067 .126 .382 .510 .636 .825 .887 .953 1.000 = 1.54 = 1.191 = 1.293 z CIT .000 .093 .175 .469 .590 .676 .809 .859 .923 1.000 Pred. Factor 1.000 .720 .720 .814 .910 .966 1.020 1.033 1.033 1.000
(The outer CITATION channel (0 = 5) was used to obtain the "CITATION-only" values.)
of these data are from Reference 14.
**Experimental data from gamma-scanning, blade height = 8.6 inches.
+Values obtained from a conservative combination of gamma-scan and CITATION data.
++"CITATION-only" values obtained from computer analysis, blade height = 8.0 inches. (Old cross section set used.)
'These prediction factors include the conservatism used in combining the gamma-scan and CITATION Information.
43
A larger A-ring prediction factor for FR is seen to result in the
three dummy core as compared to the five dummy core. This is partly
due to the different mesh spacing arrangements employed in modelling these configurations. The widths of the fueled mesh regions which are used in developing the three-dummy factors are approximately three times as large as for the five dummy case. Therefore, the three-dummy
"CITATION-only" value averages further into the cooler region toward the centerline of the element. When this CITATION prediction is compared against the experimental value for the hot plate at the element's edge, a large prediction factor for FR results.
A short code was written to estimate the safety and operating limits
by using computer-generated power density data and the prediction factors
given in Tables 3-3 and 3-4. The CITATION information provides estimates of the three core power distribution factors. These factors are then multiplied by the correct prediction factors (depending upon the core geometry and core location considered) before they are used in the safety and operating liruit equations. Appendix C presents a listing of this code and explains the required input procedure.
CHAPTER 4
SINGLE ELEMENT IRRADIATION FACILITIES
The two initial designs of in-core sample holders were developed to make use of a single core position. This chapter provides a description and evaluation of the original single element assembly designed by Soth (Reference 15), and of the subsequent modification made to this design.
4.1 ORIGINAL IN-CORE SAMPLE ASSEMBLY
The original in-core sample assembly (ICSA) had been designed and constructed before the completion of the reactor modification. This assembly is pictured in Figure 4-1. Its external dimensions are those of a typical fuel element, allowing installation
into any of the twenty-seven core positions. Internally, it consists of a 1.25 inch O.D. sample tube reaching partway down its length, and surrounded by a .425 inch thick annular coolant gap. Below the sample tube is a 1.25 inch diameter coolant channel. The assembly's body is composed of aluminum.
This ICSA was used to hold a neutron source during startup testing of the MITR-II. It was later in place for some of the low power physics tests, including the initial gamma-scanning procedures. During these tests however, it was determined that
the ICSA's water channel was producing an unacceptable power
.1.O. WELD As \
LtEms rot &Ac sm .P aw PsEEA PJNL3s.s 4r0 nori asm. L Pde -A SLA IP / ON NOZZLE -a.#** c-ar
LET ENO y/f W
e,L &S fer JAe&M
P /fNr ,v VI/EW
MeszL. -IS Nor sH*N
Re* C&AIrTi.
U,.
FIGURE 4-1, Original in-core sample assembly design
- A SIP P.,r 0
MOB , S'
- to" "IMf
0"V,
by Allen and is detailed in Reference 14. His work showed that a safety limit of 2.88 was reached. This is very close to, but still below the maximum allowed value of 2.9. However, the operating limit reached a value of 5.07, well above the 3.72 limit allowed for operation above 1 KW. Therefore, the initial ICSA design could not be employed at higher reactor powers. In order to alleviate this power peaking problem, the ICSA was modified into an assembly called the molybdenum sample holder.
4.2 MOLYBDENUM SAMPLE HOLDER
The design of the molybdenum sample holder eliminated much of the coolant volume which the old ICSA contained. This was accomplished by adding aluminum to the assembly's body and lengthening the sample tube to a point slightly below the fuel
bottom. Figure 4-2 shows this new design. The central sample tube
is surrounded by a .05 inch annular coolant gap running the length
of the assembly. An aluminum insert was placed into the upper portion
of the original ICSA's housing to reduce the coolant gap to the
desired size.
Several three-group CITATION calculations were performed to determine if power peaking would be a problem with the molybdenum sample holder design. The reactivity effect of flooding the sample
stop
p,r-w~1
I
-, / '_____ / "4H
1A~M*A~ ~{/ 7, ~ ~-' -_- -- - -j / / i')FOR IWIblER SLEEVE WITL SEe
JWRLALL LI
TOP FUEL HEOULE
OU5T WAE cmuS MR REEOVEb,M'105
Mo rosAE to 70 %* t M0ST UAOE.
'0*d.,Eft OF 55 SDoo ,0ES POSt113ED
ft.6 WE..* iNNE0 Sit"O
EEKoNCE DKR1I-ON PEE 44 5i
-S j - '
- Ash IV ,Vo,
Rt1Dfr .1AW Y/4W
ME DIWIIIG ' KE -'-'I - 5 FOR PASSEMBLI O TOLIS UbT
FIGURE 4-2. Molybdenum sample holder design.
23*
1
4 k ~74/'/,K~. '///~Z' XK6K'7/7A'7/YA~YA/A~-'7 I / I .j ;~P-I
7/,' .//////,///,/////$7,~>& ,' / / I //
'A p P if-, 111 A. &I ",it
r.l.f. WELAP .0VL4L\_ J71pe .pw Axi F. pi's j N -4cr, -A a-TH. Wr SAW rAfw AKEXwas conducted was that of a five dummy core (four solid dummies
plus the sample holder), without fixed absorbers. A three-dimensional (R, 0, Z) core model was used; this mockup was based on work by
Yeung (Reference 16), and is depicted in Figure 4-3. This figure shows a horizontal cross section of the core with the radial and azimuthal mesh spacings. Only one-half of the core is mocked up; a plane of symmetry is assumed through the regulating rod and core centerline. Axially, the fueled region is divided into nine planes. Two more planes are located above these nine to model the structure and coolant located above the fuel. Nine
planes are located below the fuel. The moveable cadmium control blades in this study were mocked up by the use of the original set
of cadmium blade cross sections as described in Section 2.2.2. The reactivity effect of flooding the sample tube was found first. Although the sample assembly would be physically located in either core position A-2 or A-3, it was impossible to represent this situation with the half-core computer model being used.
The sample tube was therefore mocked up as being located halfway between the midpoints of core positions A-2 and A-3. Two CITATION cases were then run with the cadmium control blades'at a height of 8 inches and a core power of 5 MW. The first mocked up a voided sample tube and resulted in a Keff of .9550. In the second run, the void was replaced by water, resulting in a K of .9569.
49
core tank
gcore
10
9
7
3
regulating6
rod
5
shim blade
corner hole#2
Hexagonal fixed absorber region
Radial fixed absorber region
FIGURE
4-3.
Horizontal section showing core model for
The reactivity effect of flooding was therefore estimated to be 0.19% AK. This prediction was confirmed when low power testing
of the assembly took place. The reactivity effect of removing the voided sample tube and leaving a water-filled channel in the center of the assembly was measured to be 0.19% AK, the same as the predicted value.
The technical specification limits for the voided tube mockup were calculated from the CITATION power density output; this
information is listed as case 1 of Table 4-1. It can be seen that for this computer mdckup, the limits are within their allowed ranges. The maximum safety limit of 2.19 occurred in position A-1,
next to the sample assembly, while the maximum operating limit of
3.17 occurred at the edge of the core in position C-13. The prediction factors for a five dummy core (Table 3-4) were used in this analysis.
CITATION calculations were also performed to evaluate the technical specification limits for the sample holder in a flooded condition at two shim blade heights. A slightly different
approach was used in modelling these computer runs. Because of the symmetry condition imposed by the half-core model, the equivalent of one-half of a flooded sample tube was included in both positions A-2 and A-3. The first case run with this core mockup positioned the blades at a height of 8 inches. The second
case was for a 14 inch blade height. The results of these calculations are shown as the second and third cases in Table 4-1.
TABLE 4-1
RESULTS OF LIMIT CALCULATIONS FOR THE MOLYBDENUM SAMPLE HOLDER
Max. Operating Limit
Core K ++
|I
I
heightCase Configuration eff value position value position (inches)
1* 4 dummies & voided sample .9550 2.19 A-1, next to 3.17** C-13, at edge 8
holder, Cd blades at 8" moly holder of core
2* 4 dummies & flooded sample A-1, next to 326** A-1, next to 16 holder, Cd blades at 8" moly holder moly holder
3 4 dummies & flooded sample 1.0314 2.71 C-13, at edge 3.891 C-2, at edge 10
holder, Cd blades at 14" of core of core
+ 2 dummies & flooded sample
holder, B-SS blades at 8", .9938 2.74 moly holder 3.40** moly holder 10 Hf fixed at 12"moyhlemlyodr
*The technical specification limits obtained for these cases have been estimated by use of th prediction factors listed in Table 3-4.
+The technical specification limits obtained for this case have been estimated by use of the prediction factors listed in Table 3-3.
+Different core mockups were used for these cases (except for cases 2 & 3), it is therefore
not strictly appropriate to compare these values.
**For 5MW (2 pump) operation.
1
This value is the predicted 2.5 MW (1 pump) operating limit, the predicted shim blade height at which the 3.72 limit is reached is 13.6 inches.
1 F RR .52 FA 1.84 Z z .51 1.76 1.06 .87 1.58 1.83 .64 1.88 1.35 .56 e H
The "CITATION-only" results generated from these computer calculations showed the safety and operating limits for both cases to be below the
maximum allowed values of 2.9 and 3.72, respectively. However, when the prediction factors from the five dummy core (Table 3-4) are applied to the "CITATION-only" results, the operating limit for the 14-inch case exceeds its maximum allowed value of 3.72. The condition at which the operating limit is predicted to reach 3.72 is with the blades raised
to a height of 13.6 inches.
Cases 1, 2, and 3 were performed for a core containing the molybdenum sample holder, four aluminum dummies, cadmium shim blades, and no fixed absorbers. In order to evaluate the power peaking effect of introducing hafnium fixed absorbers and boron-stainless-steel shim blades, a fourth case was performed. This calculation positioned dummies in positions B-2 and B-8, with a flooded sample assembly in position A-1. The fixed and moveable absorbers were at heights of 12 and 8 inches, respectively, and the reactor power was again set at 5 MW. The coremodel used for this case was based on previous work by Allen (Reference 14) and is similar to the model described earlier in this section. The output of this computer run, along with an updated listing of the CITATION three group cross section
library is provided in Appendix D.
The results of this calculation are shown as case 4 of Table 4-1. The prediction factors employed are from the three dummy configurations
of Table 3-3. Maximum values of each limit occurred in the A-3 position, adjacent to the flooded sample assembly. The safety limit reached a value of 2.74, which is below the maximum allowed limit of 2.9. The
53
largest estimated operating limit was 3.40, which is below its maximum
allowed value of 3.72. (In obtaining these limits, the power densities
of the two inner CITATION channels which border the facility were
averaged.)
Table 4-2 shows the thermal flux levels at two locations for the
four cases considered. The first column lists the flux values at a point
along the core centerline at the height of the beam ports. This indicates
the magnitude of the flux which drives the beam ports. The second column
shows the maximum thermal flux encountered within the sample assemblies.
Table 4-2
Results of CITATION thermal flux calculations for the molybdenum sample holder
Beam Port Max. Sample Assembly
Thermal Flux Thermal Flux
Case Description (n/cm2sec) (n/cm2sec)
1 4 dummies & voided sample 8.5 x 10¹³ 5.4 x 10¹³ holder, Cd blades at 8"
2 4 dummies & flooded sample 8.4 x 10¹³ 7.8 x 10¹³ holder, Cd blades at 8"
3 4 dummies & flooded sample 7.5 x 10¹³ 6.8 x 10¹³ holder, Cd blades at 14"
2 dummies & flooded sample 13 13
4 holder, B-SS blades at 8", 9.3 x 10 8.5 x 10 Hf fixed at 12"
This peak occurs at the bottom of the sample tube for each case.
These results demonstrate the influence that the control materials
exert in pushing the thermal flux toward the bottom of the core. The
maximum flux values at lower core positions are obtained when fixed
CHAPTER 5
DOUBLE ELEMENT IRRADIATION FACILITY
The single element facilities discussed in the previous chapter
allow for the irradiation of samples only up to 1.13 inches in
diameter. Larger samples can be inserted into the beam ports, but
the flux there is lower and much more thermalized than in the core.
A larger facility was therefore investigated which would make use
of two A-ring core positions.
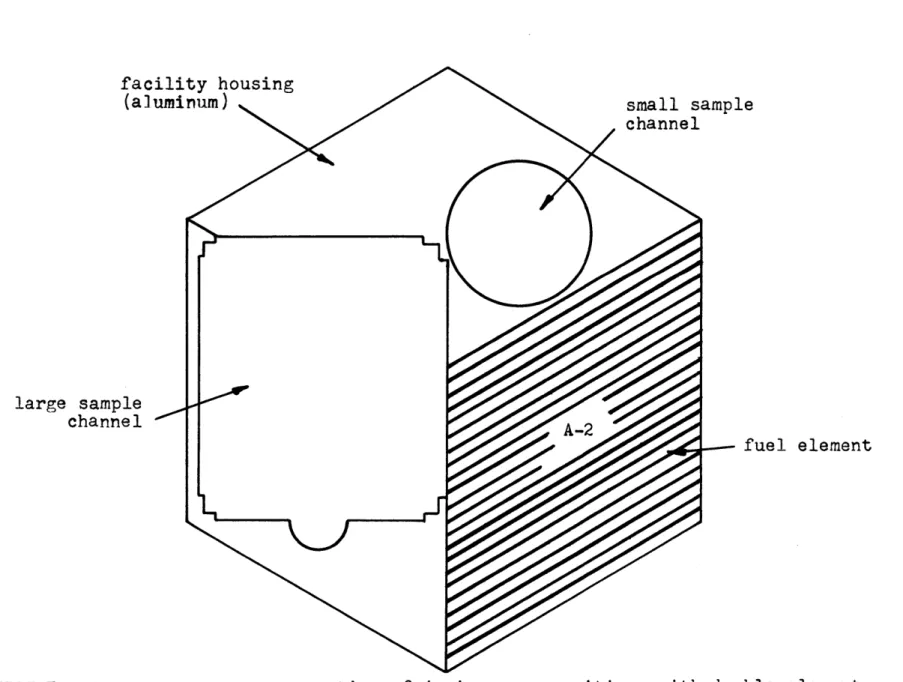
This facility was designed to include a channel for the
irradiation of a large rectangular sample, and a smaller channel
containing a 1.25 inch O.D. sample tube. The layout can be seen in
the horizontal cross section of the A-ring positions as shown in
Figure 5-1. The aluminum body of the facility consists of two
individual pieces. When placed together into adjacent A-ring positions,
they form a large channel that is about 2.2 inches by 2.5 inches in
cross section. The smaller sample channel is entirely contained by one
of the aluminum pieces.
A steel sample is initially envisioned for irradiation in the
large channel as part of a study of radiation damage effects. The
smaller channel will be useful for the irradiation of molybdenum samples.
These two materials were therefore included in the analysis of the
double element facility in regard to reactivity effects, power peaking,
large sample
channel
fuel element
IJ1
Ln
FIGURE
5-1.
Horizontal cross section of A-ring core positions with double element
5.1 FIFTEEN GROUP CITATION STUDY
The fast neutron flux is important to the investigation of
radiation damage. It was therefore decided to perform a fifteen
group study in order to obtain a detailed picture of the high energy
flux spectrum. Two CITATION cases were considered, each using a
two-dimensional (R,Z) core model. The first was a base case in which
the three central elements were replaced by a mixture of 90% aluminum
and 10% water. Fuel was placed in all other core positions. The
second case included a 90% steel and 10% water, cylindrical sample, equal
in cross sectional area to a single fuel element. It was located
along the core centerline and ran the length of the fuel. Hafnium
fixed absorbers were included at a height of 12 inches, and the
boron-stainless-steel moveable blades were placed at 8 inches for
both cases. The mesh spacing and zone compositions employed are shown
in Figure 5-2. Table 5-1 lists the materials contained in each zone.
The base case K was found to be 1.063. With the introduction
of the steel sample, this value fell to 1.051, showing a reactivity
effect of 1.2%AK. The steel sample also produced an 8% drop in the
thermal flux levels near the tips of the beam ports.
The component of the neutron flux above .9 mev is plotted in
Figure 5-3 for the steel sample region. This curve shows the radial
average of the fast flux across the steel sample as a function of axial
position. The peak of 5.2 x 10¹³ n/cm2sec occurs at a point approximately
57
FIGURE
5-2.
Two-dimensional core model used for
fifteen group steel sample calculations.
(not to scale)
TABLE 5-1
ZONE COMPOSITIONS FOR 15 GROUP STEEL SAMPLE CALCULATION
Zone Nuclide Number Nuclide Name Number Density (atoms/cm-b)
1 1 U-235 4.390 x 10 2 U-238 3.359 x 10⁻³ Al 3.183 x 10⁻² 4 H 0 1.545 x 10² 2 2 5 U-235 4.390 x 10 6 U-238 3.359 x 10⁻⁷ Al 3.183 x 10 2 8 H20 1.545 x 10² 3 9 U-235 4.390 x 10 10 U-238 3.359 x 10⁻¹¹ Al 3.183 x 10⁻² 12 H 20 1.545 x 10 2 4 13 Al 3.012 x 10² 14 H20 1.655 x 10² 5 13 Al 1.621 x 10 14 H20 1.645 x 10⁻² 15 D20 3.275 x 10 2 2 6 16 Al 6.023 x 10⁻² 7 17 Al 6.023 x 10o2 8 13 Al 3.012 x 10 2 14 H20 1.655 x 1o2 9 18 C 8.344 x 10⁻² 10 13 Al 3.120 x 10 2 15 D 20 1.654 x 10 2 11-13 14 H20 3.340 x 10⁻² 14 13 Al 4.455 x 10 2 19 Hf 3.188 x 10² 15 14 H 0 3.340 x 10⁻³ 17 Ai 5.421 x 10⁻²