HAL Id: halshs-01484982
https://halshs.archives-ouvertes.fr/halshs-01484982
Preprint submitted on 8 Mar 2017HAL is a multi-disciplinary open access
archive for the deposit and dissemination of sci-entific research documents, whether they are pub-lished or not. The documents may come from teaching and research institutions in France or abroad, or from public or private research centers.
L’archive ouverte pluridisciplinaire HAL, est destinée au dépôt et à la diffusion de documents scientifiques de niveau recherche, publiés ou non, émanant des établissements d’enseignement et de recherche français ou étrangers, des laboratoires publics ou privés.
from 2000 to 2014
Martine Audibert, Robert Kolesar
To cite this version:
Martine Audibert, Robert Kolesar. Post-neonatal Mortality Impacts Following Grants from the Gavi Vaccine Alliance: An Econometric Analysis from 2000 to 2014. 2017. �halshs-01484982�
C E N T R E D'E T U D E S E T D E R E C H E R C H E S S U R L E D E V E L O P P E M E N T I N T E R N A T I O N A L
SÉRIE ÉTUDES ET DOCUMENTS
Post-neonatal Mortality Impacts Following Grants from the Gavi
Vaccine Alliance: An Econometric Analysis from 2000 to 2014
Robert J. Kolesar
Martine Audibert
Études et Documents n° 7
February 2017
To cite this document:
Kolesar R. J., Audibert M. (2017) “Post-neonatal Mortality Impacts Following Grants from the
Gavi Vaccine Alliance: An Econometric Analysis from 2000 to 2014”, Études et Documents, n° 7,
CERDI.
http://cerdi.org/production/show/id/1866/type_production_id/1
CERDI
65 BD. F. MITTERRAND
63000 CLERMONT FERRAND – FRANCE TEL.+33473177400
FAX +33473177428
2
The authors
Robert J. Kolesar, MPH MSc
Health Economist
Edificio N°. 30, Avenida Circunvalación Norte, Distrito Histórico, El Malecón, San Felipe de
Puerto Plata, República Dominicana.
E-mail: robertkolesar@outlook.com
Martine Audibert
Director of Research at CNRS
School of Economics and CERDI, University Clermont Auvergne - CNRS, Clermont-Ferrand,
France.
E-mail:
martine.audibert@uca.fr
Corresponding author: Robert J. Kolesar
This work was supported by the LABEX IDGM+ (ANR-10-LABX-14-01) within the program “Investissements d’Avenir” operated by the French National Research Agency (ANR).
Études et Documents are available online at:
http://www.cerdi.org/ed
Director of Publication: Vianney Dequiedt
Editor: Catherine Araujo Bonjean
Publisher: Mariannick Cornec
ISSN: 2114 - 7957
Disclaimer:
Études et Documents is a working papers series. Working Papers are not refereed, they constitute
research in progress. Responsibility for the contents and opinions expressed in the working papers rests solely with the authors. Comments and suggestions are welcome and should be addressed to the authors.
3
Abstract
We completed a retrospective multivariate panel and longitudinal trend study to evaluate
the effect of Gavi Vaccine Alliance grants on vaccine-preventable disease (VPD)
post-neonatal mortality. Feasible Generalized Least Squares (fGLS) regression analysis was used
to examine the association between VPD post-neonatal mortality rates and Gavi
funding. We also applied segmented regression analysis to assess the structural trend in
VPD post-neonatal mortality rates, the impact of Gavi funding, and trend changes following
Gavi support. We separately tested a composite VPD mortality rate and five
vaccine-preventable mortality rates: pertussis, meningitis, measles, diarrhea, and pneumonia
(lower-respiratory infection) as dependent variables. All 77 countries eligible for Gavi assistance
from 2000 to 2014 were included in the study. To isolate the effect of Gavi funding in our
primary model, we controlled for known and likely predictors of child mortality. Among
other factors, Gavi investment and corruption control/system efficiency are important
elements to reduce vaccine-preventable mortality rates. For every $1 per capita invested by
the Gavi Vaccine Alliance, there are highly statistically significant effects- decreasing the
vaccine-preventable disease post-neonatal mortality rate by 2.535 per 1,000 live births. We
also found Gavi investments to be significantly associated with reductions in four vaccine
preventable
disease-specific
rates:
pertussis,
meningitis,
diarrhea,
and
pneumonia. Furthermore, we found Gavi support to be significantly associated with both
immediate impacts and trend changes on vaccine-preventable mortality rates. We conclude
that Gavi investments in developing country immunization programs have measurably
contributed to reductions in post-neonatal VPD mortality rates. Furthermore, we found
evidence of a longer term catalytic effect of Gavi funding with accelerated reductions in the
trend for post-neonatal meningitis, diarrhea, and pneumonia mortality rates.
Keywords
Vaccines, Immunizations, Developing countries, Financing, Mortality reduction
JEL Codes
I, I1, I00, H, H43
Funding and acknowledgments
This study was initiated as part of an internship with the Gavi Alliance [agreement number
19303]. The sponsor provided comments on the preliminary data analysis. All final data
analysis, interpretation of findings, and preparation of this manuscript was at the full
discretion of the authors. Submission of the article for publication was the sole decision of
the authors.
We thank Hope Johnson from the Gavi Alliance for review and comment on the initial data
analysis.
4 1. Introduction
The United Nations Development Goals aim to end preventable child death by 2030.1 The World Health Organization (WHO) estimates that immunization averts at least two to three million deaths every year in all age groups. 2 Furthermore, vaccinations are among the most cost-effective public health
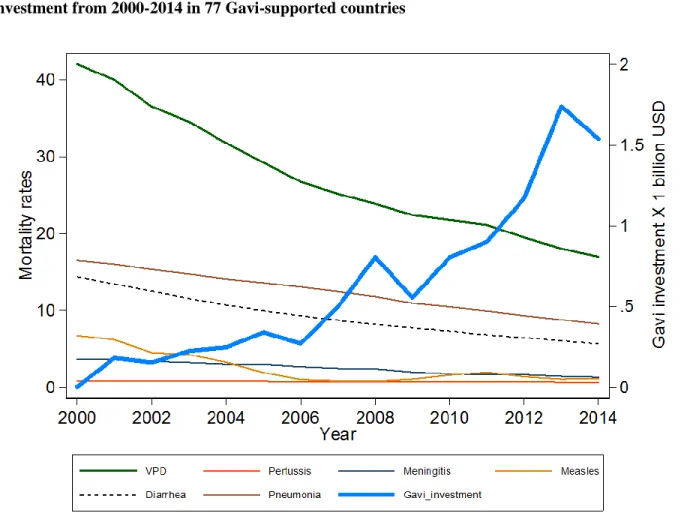
interventions.3,4 The Gavi Vaccine Alliance is an international public-private partnership that aims to create equal access to new and under-used vaccines for children living in the world’s poorest countries. 5 Since its inception in 2000, the Gavi Alliance has become a major health development donor: providing more than $9.43 billion (current US$) to 77 countries from 2000 to 2014. 6 Gavi is a public-private partnership that aims to (1) accelerate equitable uptake and coverage of vaccines; (2) increase effectiveness and efficiency of immunization delivery as an integrated part of strengthened health systems; (3) improve sustainability of national immunization programs; and, (4) shape markets for vaccines and other immunization products.5 Figure 1 illustrates the reduction in post-neonatal (children 1-59 months of age) mortality rates (per 1,000 live births) for Vaccine Preventable Disease (VPD) overall, and its component mortality rates for five specific vaccine-preventable diseases: pertussis, meningitis, measles, diarrhea, and pneumonia among the 77 countries that received any Gavi assistance from 2000 to 2014. The average annual post-neonatal VPD decrease from 2000 to 2014 is 1.67 per 1,000 live births; the average annual GAVI funding increase over the period is $102.4 million.
5
Figure 1. Annual post-neonatal mortality rates for vaccine-preventable diseases and Gavi investment from 2000-2014 in 77 Gavi-supported countries
Data sources: World Health Organization and Institute for Health Metrics and Evaluation
The Gavi Alliance focuses its financial support on the world's poorest countries with national incomes determining eligibility. From 2000 to 2006, the Gross National Income (GNI) per capita eligibility threshold was US$ 1,000 (based on 1998 World Bank data). Seventy-four countries were initially eligible to apply for Gavi support. Since 2000, three additional countries have become eligible for and received support: Timor Leste (2002), Kiribati (2007), and South Sudan (2011). Presently, countries are eligible to apply for Gavi financing when their Gross National Income (GNI) per capita is below or equal to US$ 1,580 on average over the past three years. Among the 77 countries that have received Gavi financial support, 31 are currently classified as low-income economies, 38 as lower-middle income and eight as
6
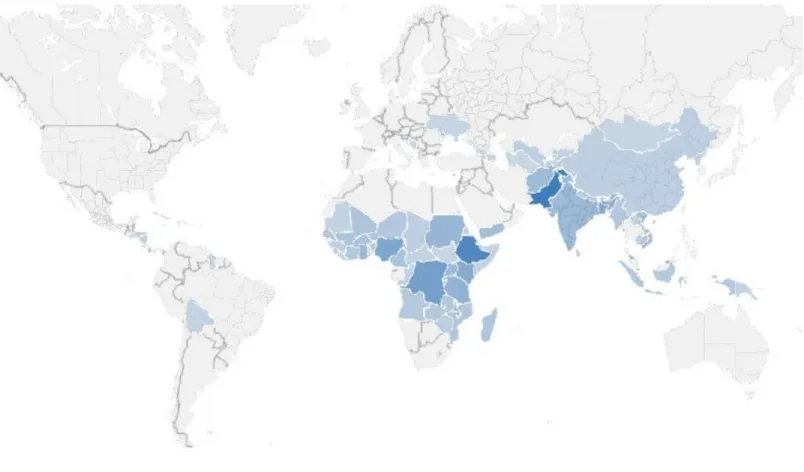
upper-middle income1 (per 2016 World Bank income groupings). Figure 2 illustrates the geographic distribution of countries that have received Gavi financing, color-graded by total disbursements (in 2016 US dollars) from 2000 to 2014.
Figure 2. Countries receiving Gavi funding, color-graded by total disbursements between 2000 and 2014, from lowest (lightest) to highest (darkest)
Data source: Institute for Health Metrics and Evaluation
1 Low-income economies are defined as those with a GNI per capita, calculated using the World Bank Atlas method,
of $1,045 or less in 2014; lower middle-income economies are those with a GNI per capita of more than $1,045 but less than $4,125 and upper-middle-income countries are those with a GNI per capita of $4,125 to $12,736 33.
7
Over the period 2000-2014, the average total disbursement by country is $122.5 million (current US dollars), with range of $713,511 (Kiribati) to $928,030,656 (Pakistan). Ten countries have received a combined total of $4.969 billion representing 53% of total disbursements: Pakistan, Ethiopia, Democratic Republic of the Congo, Nigeria, Bangladesh, Kenya, Tanzania, Sudan, Uganda, and Ghana.
The total average per capita investment by Gavi from 2000 to 2014 is $5.11 with the highest per capita investment being $14.70 (The Gambia) and the lowest being $0.05 (China). Reflective of Gavi’s focus on the world’s poorest, the total average per capita assistance is highest among countries currently
classified as low-income ($6.71), compared to per capita investments in lower-middle income ($4.57) and upper-middle income ($1.47) countries. Figure 3 shows the total Gavi investment per capita from 2000 to 2014 by country. Countries are color-graded by income group with dark blue corresponding to low-income countries, medium blue corresponding to lower-middle low-income countries, and light blue corresponding to upper-middle income countries.
8
Figure 3. Total (2000-2014) average Gavi investment per capita (in current USD) by country, color-graded by income group
9 2. Methods
2.1 Econometric models
We examine the relationship between longitudinal vaccine-preventable post-neonatal mortality rates and Gavi Alliance disbursements among all 77 countries ever eligible to receive Gavi grants. We apply an approach similar to that used by Yan, Korenromp, and Bendavid to evaluate mortality changes after grants from the Global Fund to Fight AIDS, tuberculosis and malaria.7 To enable estimation in the presence of heteroscedasticity and correlated error structure, we used feasible Generalized Least Squares (fGLS) regression for panel data as our primary model. 8,9,10 To isolate the effect of Gavi support in this model, we included known and likely predictors of child mortality described in the literature as control covariates.11,12,13,14,15,16,17 We also applied a segmented regression model for longitudinal data to assess the structural trend, the immediate impact of Gavi funding, and a change in the trend following Gavi support.18
Our primary model includes a time trend variable to separately account for mortality changes over time. We use corruption control score as a proxy variable for system efficiency.
The fGLS regression model is expressed as an equation below.
𝑀𝑜𝑟𝑡𝑎𝑙𝑖𝑡𝑦𝑖𝑡 = 𝛼𝑖+ 𝛽1𝑇𝑖𝑚𝑒𝑖+ 𝛽2𝐺𝑎𝑣𝑖_𝑎𝑠𝑠𝑖𝑠𝑡𝑎𝑛𝑐𝑒_𝑝𝑐𝑖𝑡+ 𝛽3𝐴𝑙𝑙_𝑜𝑡ℎ𝑒𝑟_𝐻𝑒𝑎𝑙𝑡ℎ_𝐸𝑥𝑝𝑒𝑛𝑑𝑖𝑡𝑢𝑟𝑒_𝑝𝑐𝑖𝑡 + 𝛽4𝐴𝑁𝐶_𝑎𝑐𝑐𝑒𝑠𝑠 𝑖𝑡+ 𝛽5𝑊𝑎𝑡𝑒𝑟_𝑎𝑐𝑐𝑒𝑠𝑠𝑖𝑡 + 𝛽6𝑙𝑛_𝐺𝑁𝐼 𝑖𝑡+ 𝛽7𝑃𝑟𝑖𝑚𝑎𝑟𝑦𝑖𝑡+ 𝛽8𝐵𝑖𝑟𝑡ℎ_𝑟𝑎𝑡𝑒 𝑖𝑡+ 𝛽9𝐶𝑜𝑟𝑟𝑢𝑝𝑡𝑖𝑜𝑛𝑖𝑡+ 𝜀𝑖𝑡 𝜀𝑖𝑡 = 𝑢𝑖+ 𝜈𝑖𝑡
Where Mortalityit is the crude post-neonatal mortality rates for country i in year t, Time is a time trend
covariate taking on the value t in the tth year, Gavi_assistance_pcit is the per-capita disbursement from the
10
(lagged), ANC_accessit is the proportion of pregnant women accessing antenatal care at least once,
Water_accessit is the proportion of the rural population with access to water, GNI_pcit is the natural log of
the Gross National Income (GNI) per capita, Primaryit is the proportion of girls attending primary school
and represents maternal education, Birth_rateit is the birth rate, Corruptionit is the corruption control
score. Epsilon is the error term which includes both between-entity error (uit) and within-entity error (vit).
For the segmented regression, post-neonatal mortality data was temporally realigned with Time 0 representing the first year of Gavi funding for each country, regardless of the calendar year. We used Ordinary Least Squares regression with robust standard errors to independently assess the effects immediately following the initiation of Gavi support and the change in the trend for each dependent variable.
2.2 Statistical testing
All statistical analysis was completed using Stata 14.1. For the fGLS regression, we tested the model for heteroscedasticity in panel data using the Likelihood-ratio test (p<0.000). We also detected serial correlation using the Wooldridge test for serial correlation in panel-data models (p-value<0.000). 19 We addressed these issues by using the feasible Generalized Least Squares (fGLS) regression method which enables estimation in the presence of heteroscedasticity and correlated error structure. 20, 21
For the segmented regression, we calculated Durban Watson (dw) statistics to test for the presence of first-order auto-correlation using a 1% level of significance to indicate not to reject the null hypothesis of autocorrelated errors. The results for positive first-order correlation related to the Measles post-neonatal mortality rate as a dependent variable were inconclusive. Likewise, the result was inconclusive for negative first-order correlation relative to Pertussis and diarrhea mortality rates. To err conservatively, we used the Prais-Winsten estimator as the basis for our results for these three dependent variables.
11
2.3 Variations on the model
We completed multiple secondary analyses for sensitivity testing of our results. First, we repeated the primary analysis using standard panel regression with complete case analysis using random effects (to address serial correlation) and robust standard errors (to address heteroscedasticity). This analysis (not shown) yielded similar associations, but less significant results. Second, we explored additional explanatory/control variables, testing the effect of supplementary covariates using a manual backwards stepwise regression process. We tested health workforce density, urban population percent, sanitation coverage, and political stability. We also tested adult HIV prevalence, child malaria, and malnutrition rates in the model as possible factors that could be correlated with increased mortality. This could be due to either increased immuno-vulnerability or the economic burden resulting in reduced access to health services associated with each health condition. We interacted antenatal care (ANC) access with all other health expenditure to control for the effect of health system capacity, in this case capacity to render services available as a function of resources invested. These variables were excluded from the final model due to concerns with excessive data missingness (in the case of health workforce density); or, lack of statistical significance and/or inconsistency across dependent variables. Third, we varied time-lags from 1-year to 2-4 years, with similar results. Fourth, we ran separate regressions on each dependent mortality variable by current country income group. To control for differences potentially associated with a change in income group classification, we included a discrete variable to account for the number of years the country was reclassified to a higher income group. An F-test for nested models indicated that this variable did not contribute information, thus we excluded the variable from the final fGLS model.
12
2.4 Data
The dataset was constructed using publicly accessible information. We retrieved disease-specific mortality data from the World Health Organization (WHO) Global Health Observatory; and, financial data for development assistance for health from the Institute for Health Metrics and Evaluation (IHME).22,23 All other health and development data was retrieved from the World Bank and the University of Gothenburg’s Quality of Government Basic dataset.24,25
We generated a composite Vaccine Preventable Disease (VPD) rate by summing the individual rates for each of the five disease-specific rates. Gavi assistance, all other (non-Gavi) public health expenditure, and Gross National Income (GNI) are all expressed as per capita in 2016 US dollars. In addition, Gavi assistance, all other (non-Gavi) public health expenditure variables were lagged by one-year to account for the delay from the time resources are dispersed to their earliest potential health impact. GNI per capita was transformed to natural log to reduce skewness. In relation to Antenatal care (ANC) access and Girls’ primary completion variables, for countries with at least two data points, missing values between
these points were interpolated as it is reasonable to expect linear changes over relatively short periods.
Table 1 shows the mean and median values for all independent variables included in the primary model. Values are provided for all 77 countries included in the analyses as well as by current income group classification. For comparative purposes the table shows totals for Gavi assistance and all other (non-Gavi) health investment (both per capita) for the period (2000-2014). As noted above, the total average Gavi-assistance per capita is higher among low-income countries. By contrast, all other health
expenditure per capita increases dramatically by income group. ANC access, rural water access, and girls’ primary school completion increase among countries in higher income groups. Girls’ primary
13
late/early and/or repeat grades. By contrast, the birth rate decreases among countries in higher income groups.
In order to minimize the loss of observations resulting from one missing value in a country-year observation, we completed Multiple Imputation using chained equations (MICE) with predictive mean matching to the five nearest neighbors.26,27 This approach enabled the estimation of missing values for six variables: all other health expenditure per capital, ANC access, water access (rural), GNI per capita, girls’
primary school completion, and corruption control. The proportion of missing data that was imputed is shown in Table 1. Missing data for these variables was considered Missing At Random (MAR) as missingness is attributed to multi-year national survey cycles or lack of reporting due to either political instability or system inefficiency. We addressed the later by including political stability and corruption
Table 1. Descriptive characteristics of countries by income group
All countries Low-income Lower-middle income Upper-middle income % imputed
Number of countries 77 31 38 8
Gavi assistance per capita $ 5.11 $ 6.71 $ 4.57 $ 1.47 0%
(mean) $ 4.86 $ 6.62 $ 4.16 $ 0.99
(median)
All other Health Expenditure per capita
(mean) $ 993.06 $ 351.98 $ 1,075.30 $ 3,086.56 3.96%
(median) $ 649.52 $ 374.87 $ 945.42 $ 2,669.88
Antenatal care access 17.40%
(mean) 79.8% 73.8% 82.3% 91.3%
(median) 84.1% 80.8% 88.9% 95.5%
Water access (rural) 2.25%
(mean) 62.4% 54.4% 67.8% 67.1%
(median) 64.1% 52.3% 68.9% 74.5%
Gross National Income per capita 8.31%
(mean) $ 1,108.25 $ 436.76 $ 1,253.73 $ 2,851.38
(median) $ 892.67 $ 422.00 $ 1,047.00 $ 3,182.00
Primary school completion rate (girls) 23.98%
(mean) 83.6% 70.4% 89.3% 103.4% (median) 87.7% 69.6% 95.6% 103.9% Birth rate 0% (mean) 31.66 38.99 28.25 19.43 (median) 35.87 39.68 29.04 14.88 Control of corruption 8% (mean) -0.77 -0.89 -0.70 -0.68 (median) -0.77 -0.88 -0.74 -0.59
14
control (as a proxy for efficiency) covariates in our imputation equation. We also included sanitation coverage in the imputation model to inform estimates of missing data for water access. All other regression equation variables were included in the MI model. We generated 20 imputations with 200 iterations by simulating from a (approximate) Bayesian posterior predictive distribution of the missing data. 9
3. Results
Regression results from the primary model are presented in Table 2. The coefficients represent the direction and magnitude of the change in mortality rates associated with a one-unit increase of the
corresponding independent variable, controlling for all other covariates in the model. P-values are shown in parentheses below each coefficient. In relation to the fGLS regression, we found a significant Gavi effect, reducing the post-neonatal mortality rates for VPD overall; and, four of the five disease-specific rates. For every $1 per capita invested by Gavi, there are highly statistically significant effects (p<0.000) - decreasing the post-neonatal the mortality rate for VPD by 2.535 per 1,000 live births; for meningitis by 0.569; and, for pneumonia by 1.547. We also found a statistically significant (p<0.05) Gavi effect on post-neonatal mortality for pertussis (0.028 rate reduction); and, diarrhea (0.387 rate reduction). No statistically significant relationship was detected between Gavi funding and the measles mortality rate.
15
Table 2. Panel regression results for vaccine-preventable disease (VPD) and disease-specific post-neonatal mortality rates in 77 Gavi-supported countries from 2000-2014
VARIABLES
VPD
Pertussis
Meningitis
Measles
Diarrhea
Pneumonia
Time trend -0.764*** 0.015*** -0.044** -0.172*** -0.389*** -0.234***
(0.000) (0.000) (0.013) (0.006) (0.000) (0.000)
Gavi investment per capita+ -2.535*** -0.028** -0.569*** 0.016 -0.387** -1.547***
(0.009) (0.022) (0.000) (0.965) (0.026) (0.000)
All other health expenditure+ 0.024 -0.000** 0.004* 0.015 0.012*** 0.001
(0.185) (0.044) (0.085) (0.241) (0.000) (0.816)
Antenatal care access -0.177*** -0.005*** -0.024*** -0.031** -0.044*** -0.078***
(0.000) (0.000) (0.000) (0.025) (0.000) (0.000)
Water access (rural) -0.136*** -0.003*** -0.008 -0.031 -0.034*** -0.061***
(0.002) (0.000) (0.220) (0.235) (0.001) (0.000)
GNI per capita (logged) -1.255 -0.044*** -0.641*** -1.107*** 0.279 0.309
(0.223) (0.000) (0.000) (0.009) (0.203) (0.243)
Primary school (girls) -0.168*** -0.001*** -0.018*** -0.029** -0.061*** -0.062***
(0.000) (0.002) (0.000) (0.026) (0.000) (0.000) Birth rate 0.891*** 0.024*** 0.083*** 0.026 0.370*** 0.384*** (0.000) (0.000) (0.000) (0.631) (0.000) (0.000) Corruption control -3.303*** 0.028* -0.199 -0.140 -1.371*** -1.431*** (0.006) (0.051) (0.101) (0.788) (0.000) (0.000) Constant 44.536*** 0.879*** 7.778*** 16.015*** 6.980*** 13.540*** (0.000) (0.000) (0.000) (0.000) (0.002) (0.000) Observations 1,078 1,078 1,078 1,078 1,078 1,078 Countries 77 77 77 77 77 77
We found highly statistically significant (p<0.05) associations between our composite VPD rate and seven of the nine explanatory variables. The time trend and ANC access variables had statistically significant associations across all six dependent mortality rate variables. We found Gavi investment per capita to be significantly associated with reduction for five of the six vaccine-preventable disease mortality rates. We also found significant associations for five mortality rates with increased girls
16
primary school completion. We also found an increase in the birth rate to be significantly associated with an increase in (five of the six) mortality rates.
Finally, we found corruption control (used as a proxy for health system efficiency) to have a highly statistically significant effect on reducing the overall VPD rate as well as for diarrhea and pneumonia mortality rates. A one-point increase in the corruption control score is associated with a reduction in the VPD rate by 3.303 (p<0.006). We did not find any association between Gavi funding and Measles mortality rates.
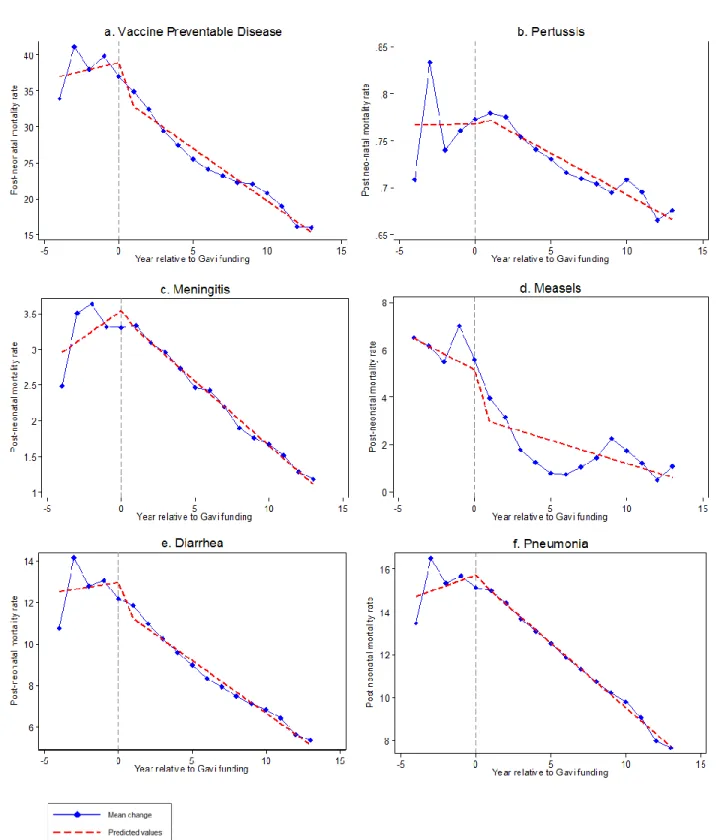
Using segmented regression, we found the VPD mortality rate decreased by 4.624 per 1,000 live births (p<0.018) directly following the initiation of Gavi support with mortality rate reductions for Measles (by 2.0665) and diarrhea (by 1.231). In addition to the immediate effect, we also observed statistically significant reductions in the post-neonatal mortality rate trends for the overall VPD mortality rate of 1.973; and, for three disease-specific rates: Meningitis (by 0.3252), diarrhea (by 0.6197), and pneumonia (by 0.8538). No underlying structural trends were detected. Figure 4 illustrates the mean change and fitted results for overall VPD and disease specific post-neonatal mortality rates relative to the initiation year of Gavi support.
Table 3. Results of segmented linear regression model by Vaccine Preventable Disease rates
Variable VPD Pertussis Meningitis Measles Diarrhea Pneumonia Prais-Winsten Prais-Winsten Prais-Winsten
38.92*** 0.7741*** 0.7675*** 3.5385*** 5.9672*** 5.1769*** 12.9331*** 12.9651*** 15.7139*** (0.000) (0.000) (0.000) (0.000) (0.000) (0.001) (0.000) (0.000) (0.000) 0.4762 0.0056 0.0002 0.1452 -0.0996 -0.3294 0.1756 0.1121 0.2495 (0.409) (0.677) (0.986) (0.278) (0.495) (0.310) (0.687) (0.718) (0.498) -4.624** 0.0059 0.01296 -0.085 -3.2844*** -2.0065* -1.116 -1.231** -0.1448 (0.018) (0.658) (0.335) (0.700) (0.001) (0.071) (0.117) (0.048) (0.777) -1.937*** -0.0143 -0.0082 -0.3252** -0.0526 0.1329 -0.6910 -0.6197* -0.8538** (0.005) (0.296) (0.295) (0.024) (0.774) (0.725) (0.128) (0.059) (0.032)
Durban Watson statistic 2.223 2.76 1.80 1.823 1.378 1.937 2.348 1.587 2.447
(p-values in parentheses) *** p<0.01, ** p<0.05, * p<0.10
Immediate impact on mean mortality rate following Gavi support Structural trend, independent of Gavi support
Change in trend following Gavi support
17
Figure 4. Mean change and fitted results for overall Vaccine Preventable Disease and disease specific post-neonatal mortality rates relative to the initiation of Gavi support
18 4. Discussion
4.1 General
Vaccination is widely recognized as one of the most cost-effective public health interventions. 28 However, the effective administration and delivery of vaccination services, particularly in developing country contexts, can present many challenges. The Gavi Alliance conducts routine monitoring as well as rigorous independent country-specific evaluations to enhance program effectiveness. To our knowledge, this study is the first econometric evaluation of the overall post-neonatal mortality impact of Gavi’s $9.43 billion investment (from 2000 to 2014) among all 77 countries that have received assistance. As
development assistance for health resources are limited, public health program planners, and especially donors, increasingly seek accountability for results and evaluation data for strategic investment decision making. 6
Our findings provide evidence that Gavi investments in developing country immunization programs have measurably contributed to reductions in post-neonatal VPD mortality rates. We note the variation of the strength and magnitude of the relationship between Gavi funding and post-neonatal mortality for each VPD. Particularly, our final model did not detect a statistically significant association for measles. It is important to note that the factors impacting on post-neonatal mortality, particularly measles, diarrhea, and pneumonia are complicated and dynamic. For example, there is evidence linking malaria in pregnancy to Intrauterine Growth Restriction which increases risk of stunting- a proximal risk factor for post-neonatal measles.32 Although we explored the inclusion of several additional explanatory variables in our model (see Variations in the model section), several were not retained. We took the approach of fitting one model to all six dependent variables to improve consistency and comparability of the results. Thus, our final model is not specific to any disease-specific factor, but rather the composite VPD rate and the five disease specific rates. Thus, we hypothesize that the effect differences of any one explanatory variable across the six dependent mortality rate variables may be attributable to disease-specific epidemiological and/or environmental factors that were not captured in our model.
19
The results related to coefficients for other factors associated with child mortality are consistent with other published literature. For example, Cleland and van Ginneken found that for every additional year of a mother’s education corresponds with a 7-9% reduction in child mortality. This is primarily attributable to economic advantages associated with education, but may also be explained by the mother’s increased
use of preventative and curative health services as well as domestic health practices.28 And, reduced fertility can reduce child mortality through increasing the birth interval, thus augmenting birth weight.29,
30, 31
In addition, smaller family size may increase household income per capita, thus enabling improved investment in health and nutrition.
We used the corruption control score as a proxy variable for system efficiency and found significant associations for reduced VPD post-neonatal mortality, and three disease-specific rates. Our results are consistent with Muldoon et al. who found that having a less corrupt government as a protective
determinant for infant, child, and maternal mortality rates. 17 This finding underscores the importance of system issues on service provision.
Finally, our segmented regression model provides evidence that Gavi funding may have a longer term catalytic effect by accelerating trend reductions for three disease-specific post-neonatal rates: meningitis, diarrhea, and pneumonia. This would suggest that, in some cases, Gavi investments have an effect beyond the immediate impact.
4.2 Strengths and limitations
It is important to note that financial support from the Gavi Alliance is highly country specific: countries submit applications and provide technical justification including strategic priorities, country context, and disease epidemiology. To explore the possibility of assessing the association between disease specific
20
funding and the relevant post-neonatal mortality rate we reviewed country and year funding earmarks by vaccine-preventable disease. However, we determined that the number of country observations and level of funding specified for any one specific disease would present significant methodological challenges. In many cases, financial support was provided for health systems strengthening which is intended to have a broader effect. We believe that modeling a composite VPD indicator and all Gavi funding in addition to each disease specific rate by country and year enabled the analysis of a more generalized effect of Gavi funding.
Our analysis did not incorporate data prior to 2000 as mortality rate estimates were not available from the source. The inclusion of additional prior years would have strengthened the segmented regression estimates. In the case of health workforce density, extensive missing data precluded use of these data in our analysis. Furthermore, as we did not find strong evidence of abrupt changes in mean mortality rate trends, our segmented regression model did not incorporate any temporal variables to control for events such as natural disasters or economic crisis.
21
References
1. United Nations. Sustainable Development Goals: 17 Goals to Transform Our World.
http://www.un.org/sustainabledevelopment/health/ (accessed December 5, 2016). 2. World Health Organization/UNICEF. Global Immunization Data, 2015.
http://www.who.int/immunization/monitoring_surveillance/Global_Immunization_Data.pdf. (accessed May 24, 2016).
3. WHO, UNICEF, World Bank. State of the world’s vaccines and immunization, 3rd ed. ; World Health Organization: Geneva, 2009.
4. Horton, S.; Levin, C. Cost-Effectiveness of Interventions for Reproductive, Maternal, Neonatal, and Child Health. In Disease Control Priorities: Improving Health & Reducing Poverty; University of Washington: Seattle, 2016; pp 319-334.
5. Gavi The Vaccine Alliance. About Gavi, the Vaccine Alliance. http://www.gavi.org/about/ (accessed May 27, 2016).
6. Dieleman, J.; Schneider, M.; Haakenstad, A.; Singh, L.; Sadat, N. B. M.; Reynolds, A.; Templin, T.; Hamavid, H.; Chapin, A.; Murray, C. Development assistance for health: past trends, associations, and the future of international financial flows for health. The Lancet 2016, S0140-6736(16)30168-4. 7. Yan, I.; Korenromp, E.; Bendavid, E. Mortality changes after grants from the Global Fund to Fight
AIDS, tuberculosis and malaria: an econometric analysis from 1995 to 2010. BMC Public Health 2015,
15 (977).
8. Kennedy, P. A Guide to Econometrics 6E; Wiley-Blackwell: Carlton, Australia, 2008.
9. Angrist, J.; Pischike, J. Mostly Harmless Econometrics: An Empiricist’s Companion; Princeton University Press, 2009.
10. StataCorp. Stata Longitudinal-data/Panel-data Reference Manual, Release 13,; Stata Press: College Station, Texas, 2013.
11. Kovacs, S. D.; Mullholland, K.; Bosch, J.; Campbell, H.; Forouzanfar, M. H.; Khalil, I.; Lim, S.; Liu, L.; Maley, S. N.; Mathers, C. D.; Matheson, A.; Mokdad, A. H.; O’Brien, K.; Parashar, U.; Schaafsma, T. Deconstructing the differences: A comparison of GBD 2010 and CHERG's approach to estimating the mortality burden of diarrhea, pneumonia, and their etiologies. BMC Infectious Diseases 2015, 15 (16).
12. Alkema, L.; You, D. Child Mortality Estimation: A Comparison of UN IGME and IHME Estimates of Levels and Trends in Under-Five Mortality Rates and Deaths. PLoS Med 2012, 9 (8).
13. Wang, F. More Health Expenditure, Better Economic Performance? Empirical Evidence from OECD Countries. The Journal of Health Care 2015, 1-5.
22
Southern Economic Journal 2008, 75 (1), 188-207.
15. Wang, H. Global, regional, and national levels of neonatal, infant, and under-5 mortality during 1990–2013: a systematic analysis for the Global Burden of Disease Study 2013. Lancet 2014, 384, 957–979.
16. Liu, L.; Johnson, H. L.; Cousens, S.; Perin, J.; Scott, S.; Lawn, J. E.; Rudan, I.; Campbell, H.; Cibulskis, R.; Li, M.; Mathers, C.; Black, R. E. Global, Regional, and National Causes of Child Mortality: An Updated Systematic Analysis for 2010 with Time Trends Since 2000. The Lancet 2012.
17. Muldoon, K. A.; Galway, L. P.; Nakajima, M.; Kanters, S.; Hogg, R. S.; Bendavid, E.; Mills, E. J. Health system determinants of infant, child and maternal mortality: A cross-sectional study of UN member countries. Globalization and Health 2011, 7 (42).
18. Lagarde, M. How to do (or not to do). Assessing the impact of a policy change with routine longitudinal data. Health Policy and Planning 2012, 27, 76-83.
19. Drukker, D. M. Testing for serial correlation in linear panel-data models. The Stata Journal 2003, 3 (2), 168-177.
20. Bartels; Brandom. Beyond “Fixed Versus Random Effects”: A framework for improving substantive
and statistical analysis of panel, time-series cross-sectional, and multilevel data; Stony Brook
University, working paper: Stoney Brook, New York, 2008.
21. Kohler, U.; Kreuter, F. Data Analysis Using Stata, 2nd Edition, p.245; Stata Press, 2009. 22. World Health Organization (WHO). Global Health Observatory data repository.
http://apps.who.int/gho/data/view.main.ghe2002015-CH6?lang=en (accessed June 1, 2016). 23. Institute for Health Metrics and Evaluation (IHME). Global Health Data Exchange.
http://ghdx.healthdata.org/record/development-assistance-health-database-1990-2015 (accessed June 1, 2016).
24. The World Bank. Data, Indicators. http://data.worldbank.org/indicator (accessed June 2016, 1). 25. Dahlberg, S.; Holmberg, S.; Rothstein, B.; Khomenko, A.; Svensson, R. The Quality of Government
Basic Dataset. http://www.qog.pol.gu.se (accessed June 2016, 1).
26. White, I.; Royston, P.; Wood, A. Multiple imputation using chained equations: Issues and guidance for practice.. Statist. Med. 2011, 30, 377-399.
27. StataCorp. Stata Multiple Imputation Reference Manual, Release 13; Stata Press: College Station, Texas , 2013.
28. Cleland, J.; Van Ginneken, J. Maternal Education and Child Survival in Developing Countries: The search for pathways of influence. Social Science and Medicine 1988, 27 (12), 1357-1368.
23
29. Cleland, J.; Berstein, S.; Ezeh, A.; Faundes, A.; Glasier, A.; Innis, J. Family planning: the unfinished agenda. The Lancet 2006, 368 (9549), 1810-1827.
30. Davanzo, J.; Razzaque, A.; Rahman, M.; Hale, L.; Ahmed, K.; Khan, M. A. M. G.; Gausia, K. The Effects
of Birth Spacing on Infant and Child Mortality, Pregnancy Outcomes, and Maternal Morbidity and Mortality in Matlab, Bangladesh; RAND Labor and Population: Washington, D.C., 2004.
31. Rutstein, S. O. Effects of preceding birth intervals on neonatal, infant and under-five years mortality and nutritional status in developing countries: evidence from the demographic and health surveys.
International Journal of Bynecology & Obstetrics 2005, 89 (1), S7-S24.
32. Johns Hopkins. LiST The Lives Saved Tool- software that predicts survival of mothers and children.
http://www.livessavedtool.org/ (accessed May 12, 2016).
33. World Bank. Country and Lending Groups. http://data.worldbank.org/about/country-and-lending-groups (accessed May 24, 2016).
34. United Nations. End Poverty: Millenium Development Goals and Beyond 2015.
https://www.un.org/millenniumgoals/childhealth.shtml (accessed May 27, 2016).
35. World Bank. Country and Lending Groups. http://data.worldbank.org/about/country-and-lending-groups (accessed May 24, 2016).
36. World Health Organization/The United Nations Children's Fund (UNICEF). Ending Preventable Child
Deaths from Pneumonia and Diarrhoea by 2025: The integrated Global Action PLan for Pneumonia and Diarrhoea; World Health Organization: Geneva, 2013.
37. Fischer Walker, C.; Munos, M.; Black, R. Quantifying the indirect effects of key child survival interventions for pneumonia, diarrhoea, and measles. Epidemiology & Infection 2013, 141 (1), 115-131.