Design and Implementation of a Real-Time
Seamless Display
by
Ivan Gonzalez-Gallo
B.S.
Electrical Engineering and Computer Science (1998)
Massachusetts Institute of Technology
Submitted to the Department of Electrical Engineering and
Computer Science
in partial fulfillment of the requirements for the degree of
Master of Engineering in Computer Science
at the
MASSACHUSETTS INSTITUTE OF TE
June 1999
@
Massachusetts Institute of Technology 1999. All rights reserved.
A uthor ... .. .. . .* ., . . . *.. ... ...
Department of Electrical Enginee 9n 9mputer
Science
Ma:V 21, 1999 Certified by...y.. ... : ... r ./ ...Th mas F./Knight, Jr. Senir Research Scientist
Thesis Supervisor
Accepted by .
Design and Implementation of a Real-Time Seamless
Display
by
Ivan Gonzalez-Gallo
Submitted to the Department of Electrical Engineering and Computer Science on May 21, 1999, in partial fulfillment of the
requirements for the degree of
Master of Engineering in Electrical Engineering and Computer Science
Abstract
A new display technology, which combines feedback with high performance
comput-ing to fabricate very high-resolution display devices, was recently developed at the Artificial Intelligence Laboratory of the Massachusetts Institute of Technology. By using different digital photogrammetry and image warping techniques, this new tech-nology enables the projection of a single seamless image across scalable self-calibrating multi-projector displays.
The objective of this thesis is to design and implement, based on this technology, a scalable and large-scale display system capable of showing seamless high-resolution images in real-time. The new system achieves real-time projection and maintains scalability by implementing a hardware-based image warping system capable of pro-cessing single images in parallel. This system was successfully implemented making possible the realization of scalable real-time seamless video walls.
Thesis Supervisor: Thomas F. Knight, Jr. Title: Senior Research Scientist
Acknowledgments
I would like to extend my gratitude to all the people whose time, patience, guidance
and encouragement have made this work possible.
First of all, I would like to thank Prof. Tom Knight, my thesis supervisor, for trusting me with such a challenging project. His knowledge and expertise helped me through the critical design decisions of the project.
I would also like to express my gratitude to Rajeev Surati whose prior work in
the field, advice and unconditional help were extremely valuable for the completion of this project.
I would also like to thank all my friends whose support helped me through all the
difficult times I encountered, especially my best friends Antonio Fuentes and Daniel Chavez for their encouragement and confidence in me, and Edixa Jimenez for her constant support and motivation.
Finally, I would like to thank my mother and my sister, Ana Luisa, for their constant love, support and encouragement. They have always been there for me.
Contents
1 Introduction 15 1.1 O verview . . . . 15 1.2 Background . . . . 16 1.2.1 Different Approaches . . . . 16 1.2.2 Prior Work . . . . 17 1.3 System Description . . . . 18 1.3.1 System Architecture . . . . 19 1.3.2 Prototype System . . . . 20 1.4 Thesis Outline . . . . 22 2 Calibration System 23 2.1 Calibration System: a General Description . . . . 232.2 Calibration System: a Detailed Description . . . . 24
2.2.1 Positional Mapping . . . . 24
2.2.2 Color and Intensity Mapping . . . . 29
3 Display System 33 3.1 Display System: a General Description . . . . 33
3.2 Display System: a Detailed Description . . . . 34
3.2.1 Scanning Module . . . . 38
3.2.3 Im age W arper ... . 42
4 Conclusions and Future Work 45 4.1 Conclusions . . . . 45
4.2 Future work . . . . 47
4.2.1 Larger Prototype System . . . . 47
List of Figures
1-1 Block diagram of system architecture . . . .
1-2 Picture of the screen of the prototype system . . . .
1-3 Picture of the projectors and the camera of the prototype system . .
2-1 Relationship between projector, screen and camera spaces . . . . 2-2 Image of calibration chart consisting of a two dimensional grid of squares
2-3 Picture of landmarks with successful identification of their centroids .
2-4 Image of calibration chart used to determine the projector to space m apping . . . .
2-5 Image of the green channel in the process of being iterated . . . . 3-1 3-2 3-3 3-4 3-5 3-6 3-7 3-8 3-9 3-10 3-11
Block diagram of the display system . . . .
Graphical user interface of the host program Wild-One board with external SVGA output Block diagram of Wild-One board . . . . Block diagram of displaying subsystem . . .
Scanning of a frame . . . . Timing Diagram of SVGA Module . . . . .
Basic configuration of double frame buffer
Block diagram of double frame buffer . . . .
Resampling system . . . . Inverse m ap . . . . board 20 21 21 25 25 27 28 30 . . . . 34 . . . . 35 . . . . 36 . . . . 37 . . . . 38 . . . . 38 . . . . 39 . . . . 41 . . . . 41 . . . . 43 . . . . 43
4-1 Uncorrected image of Chaco Canyon . . . . 46 4-2 Corrected image of Chaco Canyon . . . . 46
List of Tables
Chapter 1
Introduction
1.1
Overview
In today's modern world, digital and visual information has become crucial for every-day life and business. It is important to be able to present a huge amount of visual information using large-scale high-resolution displays.
While electronic technology has evolved enormously and computational power has grown exponentially, the high-quality large-scale display have not followed the same accelerated pace. Scalability, resolution and cost are the main issues in the high-quality display technology. Nowadays there is no technology available in the market that implements large displays capable of projecting seamless high-resolution images in real-time at a reasonable cost.
The realization of such system is the main issue addressed in this thesis. The de-sign and implementation of this system is based on a new display technology recently developed at the Artificial Laboratory of the Massachusetts Institute of Technology. This technology couples feedback with high-performance computing in the implemen-tation of large-scale high-resolution display devices based on overlapping projection. This project extends all the previous work done in the A.I. Lab to a real-time imple-mentation of the system.
The new system achieves real-time projection and maintains scalability by imple-menting a hardware-based image warping system capable of processing single images in parallel.
1.2
Background
In this section, different approaches to solve the problem of creating a scalable dis-play system capable of showing high-resolution seamless images will be explained. In addition, all prior work using the new display technology, on which the system described in this document is based, will be described.
1.2.1
Different Approaches
In the display industry, there exist three well-known and commercially available tech-nologies for the fabrication of large-scale displays: single projector display, discrete-tiling of video cubes, and projector arrays based on manually adjusted edge blending.
By using the single-projector technology, the system presents a perfectly
seam-less high-resolution image. However, this system is not scalable because of the physical limitation of the display. In addition these systems are very expensive devices that also present limitations of resolution, scalability, and brightness.
Instead of depending on a single-projector technology, discrete tiling of video cubes, combines single rear projection systems or video cubes to create large-scale bright high-resolution scalable displays. However, the resultant images are not close to perfect since these systems show visible black seams between each single projection. In addition to this visible drawback, these devices need to be calibrated periodically to eliminate any variation of color and brightness in the images.
Manually calibrated edge-blended projectors arrays are state of the art in
commercially available seamless display systems. The underlying technology of these systems is based on the fact that each projector in the array has an overlapping region
with the adjacent projectors. These systems require calibration in order to make the intensity contributions of all projectors equal to one within the overlapping regions.
Moreover, these systems also need to be calibrated to present brightness and color uniformity across the entire display area. As a result of this calibration the displayed image is completely seamless. However, even if this technology has the capability of creating large-scale displays capable of showing bright seamless high-resolution images, there is a major drawback: these devices are usually very expensive and have extremely high maintenance costs because of the manual calibration required.
In conclusion, using the available technology, it is possible to build large-scale display systems capable to present high-resolution seamless images but their cost is extremely high.
1.2.2
Prior Work
The high price, scalability and quality of the available display technologies was the main motivation to create a new display technology. The Artificial Intelligence Lab-oratory of the Massachusetts Institute of Technology developed this new technol-ogy that made possible the fabrication of self-calibrating scalable displays. This technology[1] combines feedback with high performance computing and digital imag-ing to fabricate a multi-projector high-resolution display.
Photogrammetry, machine vision, feedback, and digital image warping techniques combined to low-cost high-performance are the design keys of this new display technol-ogy that allows to show high-resolution seamless images using an array of projectors. This technology enables the automatic correction of imperfections in alignment, color and other optical distortions created by using multiple projectors.
In summary, the system created using this new display technology consists of a pro-jection system, a feedback system and a processing unit. In order to project perfectly seamless high-resolution images, the display system needs to automatic calibrate it-self. In order to calibrate the system, in other words, to correct and compensate all
visible distortions caused by having multiple overlapping projectors, a camera, used in addition to digital photogrammetry techniques, is utilized as a feedback device to a computer. Usually, there are geometric distortions as well as intensity and color distortions that need to be corrected. Among the geometric distortions, there are perspective distortions, pincushion and barrel distortions from the optics, and align-ment distortions caused by the overlapping of the projectors. On the other hand, intensity and color distortions are generated by the difference in light sources, as well as the extra intensity applied to the overlapping regions by multiple projectors. The processing system in conjunction with the feedback system computes all the predistortions of the display and compensates for them by remapping the position and intensity of each pixel using digital image warping. This remapping enables the display of a single seamless image on the display. The displayed image will be limited to the largest rectangular area covered by the array of projectors and will be uniform in brightness.
However, the major drawback of this system is the incapability of displaying images in real-time. The remapping of the images in order to correct its position and color is very slow. The methods described in this technology can and will be selectively utilized to create the new system described in this document.
1.3
System Description
In this section, a general description of the display system will be presented. This system is capable of displaying seamless high resolution images in real-time. The architecture of this system as well as a description of the prototype system will be described.
When designing this system, the assumption that it is relatively stable in space has been made. In other words, there is no change in the position of the projectors with respect to the screen. With this in mind, the system can be calibrated and the
positional and the intensity/color warping tables, used to correct the distorted image, can be created before the system is used as a display device.
This new scalable display system differs from its antecessor because it is able to display seamless images at real-time. Therefore, the display system is enhanced with hardware-based image warpers in parallel, resulting in a real-time remapping of the images.
1.3.1
System Architecture
The architecture of the real-time seamless display consists of two phases: a calibration phase and a display phase.
In the calibration phase, the objective is to determine the positional warp as well as the color and intensity warp, necessary to correct all the distortions in the image. The calibration phase makes use of a camera as feedback system. First, the calibration system derive a series of mappings between the different spaces: projector space, camera space and image space in order to precisely locate a pixel on the screen of the display system. After that, the calibration uses this computed positional mapping in order to create a color and intensity mapping. Once these mappings are created by the calibration phase of the system, they are combined into a two-dimensional lookup table that is fed into the display phase. The calibration phase will be explained in more detail in Chapter 3.
In the display phase, the source image is warped using the previously computed positional, color and intensity mappings. Once the image is warped, the display phase will be able to show a uniform-colored image across the different projectors with a very high-resolution and no visible seams. The system needs to be able to process the warping and the display of the images in real-time. The result is not only a scalable system able to show high-resolution seamless images but a system that can display them in real-time, in other words, a real scalable real-time seamless video wall. The display phase will be described in more detail in Chapter 4.
The block of diagram of the system architecture is presented in Figure 1-1.
Calibration Phase Display Phase
Figure 1-1: Block diagram of system architecture
1.3.2
Prototype System
The system described in early sections has already been designed and implemented.
A prototype of the display system has been constructed. It consists of an overlapping
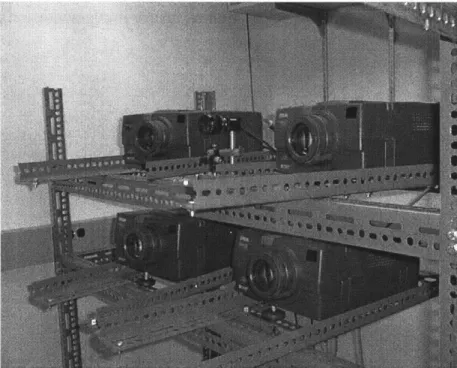
array of two by two projectors which is the actual display system, a camera which is used as feedback system, a single computer which contains the host program and algorithms to implement, and which also contains four boards (one for each projector) that are used as accelerated image warpers specifically designed for this system. In this system, the displayed image can be rear- or front-projected onto the screen. In Figure 1-2, a picture of the prototype screen is shown.
The four projectors used in the prototype are Epson Power-Lite 5000 liquid crystal display projectors. The resolution of each of this projectors is SVGA, in other words, 800x600 pixels with a maximum projection of 450 lumens. With these projectors, the whole system is theoretically capable of displaying images at a resolution of 1600x1200 pixels. In Figure 1-3, a picture of the four projectors and the camera of the prototype
Figure 1-2: Picture of the screen of the prototype system
is shown.
The computer, a Toshiba Equium 7100, is equipped with a Matrox Meteor Frame Grabber card used to digitized the NTSC input coming from the Pulnix TM540 CCD camera. It is also equipped with four Annapolis Microsystems Wild-One cards (one for each projector) where the image warpers are implemented. Each of these Wild-One cards contains a PCI interface, 8 MB of memory, two Xilinx FPGA processing units, and a SVGA output card.
The prototype system contains a host program with a user-interface in order to control the calibration and display phase. This prototype system can be utilized as a building block of larger real-time video walls since it is very scalable.
1.4
Thesis Outline
Chapter 2 presents a description of the calibration system. Chapter 3 describes the design and implementation of the display system. Chapter 4 closes by discussing the conclusions drawn from this project as well as future implementation possibilities.
Chapter 2
Calibration System
In this chapter, a detailed description of the calibration system will be presented. Most of the calibration system will be based on the system already developed at the Artificial Intelligence Laboratory of the Massachusetts Institute of Technology.
2.1
Calibration System: a General Description
The objective of the calibration system is to analyze the positional, color and optical distortions of the display system and compute the positional warp as well as the color and intensity warp to correct all distortions in the image.
For the design of the complete system, the assumption that the system will remain relatively stable in space has been made. In other words, the relative position of the projectors with respect to the screen does not change. With this in mind, the time that the calibration phase takes is not an important issue, since it will only be executed once for a specific arrangement of the system. After the system has been calibrated, it does need to be recalibrated unless the position of the projectors with respect to the screen changes.
The output of the calibration system is a set of mappings that contain information about the necessary positional and color warp necessary to correct all the distortions
in the images. Therefore, once the system is calibrated, the system is ready to continuously display seamless high-resolution images in real-time.
2.2
Calibration System: a Detailed Description
In order to correct the distortions of the image, the calibration of the system consists on obtaining two mappings: a positional mapping and a color/intensity mapping.
2.2.1
Positional Mapping
The positional mapping is necessary for the system to be able to determine the precise location of a pixel on the screen of the display. In order to be able to display a pixel on a exact location of the screen, it is necessary to obtain the relationship between the projector space and the screen space. Since the display system uses a camera as feedback system to observe the screen of the display, the only relationships that can be directly established are the camera space to screen space mapping and the camera space to projector space mapping. Both of these mappings are one-to-one mappings. Therefore, by knowing these relationships, the screen to projector relationship can be indirectly determined. In Figure 2-1, the relationship between the different spaces (camera, screen and projector spaces) is illustrated.
Screen Space to Camera Space Mapping
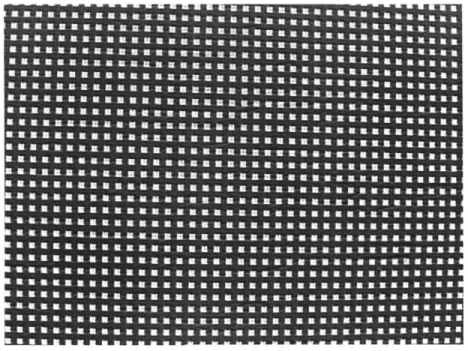
In order to determine the mapping that relates the screen space to the camera space, a calibration chart, consisting of a regular two dimensional grid of equally spaced squares, is utilized. The grid of the calibration chart is composed of squares which are 10mm wide and 20mm apart from each other, and is generated using a plotter. The first step is to take a picture of the grid, as shown in Figure 2-2.
Camera Space C
Figure 2-1: Relationship between projector, screen and camera spaces
Once the picture is taken, it is desired to automatically identify the landmarks and their position. These landmarks are relatively easy to identify since there exists a high contrast between them (the squares) and the background of the calibration chart. Therefore, by using machines vision techniques such as thresholding, connecting, and calculating centroids, the landmarks can be identified and measured with a high accuracy.
The process of thresholding consists in identifying the landmarks by using a certain threshold. The value of the pixels can only range between 0 and 255. The threshold is determined in such a way that all the pixels with values above the threshold are part of the landmarks, and the ones with values below the threshold are part of the background. The result of thresholding is a two-dimensional array of the same dimensions as the image bitmap with values of 1 or 0. If a pixel in this array has a value of 1, the pixel belongs to a landmark and not the background of the calibration chart.
After the image has been thresholded, it has to be passed through a process called
connecting. In this process, the image bitmap and the threshold array are used to
create an array of connected regions. This array of connected regions has also a size equal to that of the image bitmap but it associates neighboring pixels into connected regions. Pixels are connected if they belong to a landmark and if they neighbor each other on one of their four sides. The result of connecting is a two-dimensional array where each region of connected pixels have a unique identifier. Each of these connected regions represent a landmark of the calibration chart.
After connecting the regions representing the landmarks, the next step is
calcu-lating the centroids of each connected region. Each centroid has two coordinates, in
order words, is two-dimensional. Each coordinate of the centroid is calculated by av-eraging the corresponding weighted coordinate of all the pixels belonging to a certain connected region as shown in Equation 2.1. The weighted coordinate of a pixel is just the product of the coordinate and the value of the pixel.
Centroid,= - n
lXj
Centroidx = X-l
n
(2.1)
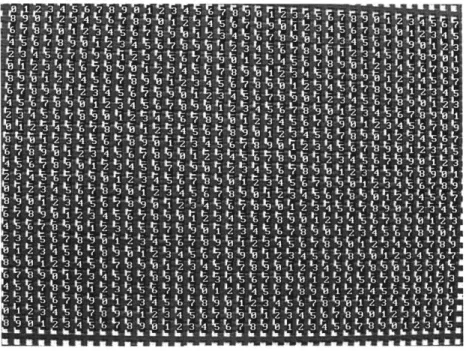
Finally, once the centroids of all the landmarks are determined, as shown in Fig-ure 2-3, the unique identifiers of the landmarks are sorted from left to right and top to bottom. The screen space to camera space mapping can now be composed.
4* 1 4 6 8 4.6. U 2 4a>1* 3 4a J q b _b '7 -8 '9 ' a 'I 'Z -3 '4 15 '16 17 T8 't3 % A, tz 173 1 4 f7 V8 4 t r 34 15 1 #8 1 t1 C2 t3 *4 1 t6 8 U9 '2 t3 'B '9 H rl '2 - 17 V -1) 14 1 6 t? -3 4 '6 '? 3 tj ?2 f- t4 1 t 19 VO fl 1 t3 1 3 '4 '6 14 '6 U9 to ' ZI - 3 14 'S t6 t 19 % ti fZ 3'4 'S 6 ft Z It4 ti t t-, L t t- L_ I I- f- A- I- A-- - - - - - - - -
-Figure 2-3: Picture of landmarks with successful identification of their centroids
Projector Space to Camera Space Mapping
Once the screen space to camera space mapping is determined, the projector space to camera space needs to be derived. It is important to notice that the projector space needs to be within the bounds of the landmarks from the screen to camera picture.
In order to determine the projector space to camera space mapping, the same
k8 U" 1 tt- 4 L Ot 2'45'6 4 7 8 'I"83t 1 3 J' 7 34 -3' 6 '7t 9 ' 2L 4 '6 t 3S 1 '2 1 42 9 ' " 3j 14 4 66t 0' 2 I 3 t4 -t 7' ) 1 42 63 '4 ' 0 2t 4 6S tt7 91'IL 3 1U 4 6 86L 2 ' 13 3 4 6 1 8 4 6 '1 4 ' 7 62t 8' 2 1 3 46 5?) 49 t 1ft3 -4 6 tt2Ut 4 7 1 8 t66 1 ' 3' 3 3 4 8 tj U 4 6 8 ki 16 ' 8 1 Z 39 16 L 8 1 $ 3 5Z - k3 H"1 ' 3 '4 56 U tt2V1418
strategy described earlier is followed: thresholding, connecting of regions and calcu-lating centroids. The only difference is that now the calibration chart is generated
by the projectors instead of being a physical chart in front of the screen. The size of
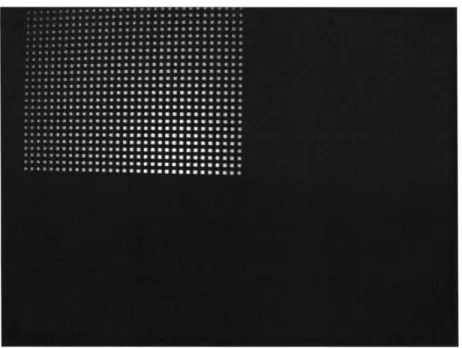
the landmarks is important since they have to be big enough to be detected by the camera and small enough to produce a measurement that leads to a high resolution. In this case, the size of the square was determined to be 10 pixels by 10 pixels, with a separation of 40 pixels eliminated the effect from the light of the neighboring square. In Figure 2-4, an image of the calibration chart is shown.
Figure 2-4: Image of calibration chart used to determine the projector to space map-ping
Once the screen space to camera space mapping and the projector space to camera space have been determined, the noise is filtered by smoothing and resampling each point using a least square polynomial fit. By composing both mappings, the screen space to projector space mapping is derived.
In summary, the positional mapping, the projector space to screen space mapping, can always be derived using the screen to camera and projector to camera mapping
as long as the screen space projected into the camera space covers the whole projector space. By using bilinear approximation, the screen space to projector space can be
derived and represented as a two-dimensional lookup table.
2.2.2
Color and Intensity Mapping
The seams in the displayed image are not only caused by the positional distortion of the system, but also by different color and intensity related distortions. In order to completely eliminate the seams of the displayed image, it is necessary to determine a color and intensity mapping that considers the fact that all projectors are overlapping, that the colors across projectors might not match, and that brightness might not be uniform across the system.
The main objective of establishing a color and intensity mapping is to be able to display a uniformly colored image across the projectors. The mapping will be used to warp or correct the images to be displayed. There exist different approaches to display a uniformly colored image. The method used by the display technique developed at the Artificial Intelligence Laboratory is a practical approach where a feedback system iterates until the image is uniformly colored with the minimum error.
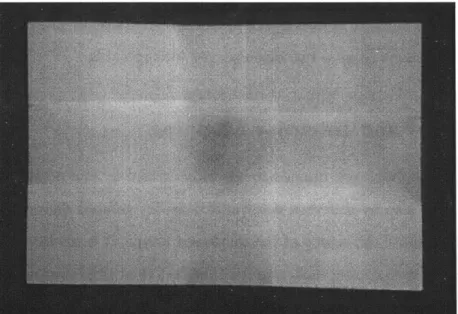
Depending on the projection system, some projectors could have one color wheel, while others could have more. The projectors used in this project have three different color channels, one for each of the primary colors they use: red, green and blue. It is important to notice that to determine more accurately the contribution of each projector, only one channel is iterated at a time, starting with an initial guess. The feedback system, in this case a camera, measures the error of the image and corrects it as much as possible for the next iteration. In Figure 2-5, the green channel is in process of being iterated to correct the intensities. The camera uses color filters (red, green, and blue) to identify the different intensities since the camera used in this project is monochromatic. However, if a color camera was used, the filters would be unnecessary.
Figure 2-5: Image of the green channel in the process of being iterated
Moreover, the overlapping regions present a problem. It is desirable that in these regions the contributions of each projector start decreasing smoothly as they get closer to the edge of its display space. In order to make a smooth transition between overlapping regions, it is necessary to weight the contribution of a projector to a specific point based on the Manhattan pixel distance to its closest edge over the sum of all such distances from each projector contributing to this point, as shown in Equation 2.2.
Contributionrojectork - MarhattarDistace M Project or x Valuepixei (2.2)
Z'
1 ManhattanDistancerojetoriManhattanDistancerojectori = Xpixei - XedgeProjector
The result of the calibrating process is a two-dimensional color and intensity map-ping necessary to create uniformly colored images. However, instead of storing the
mapping for each pixel, the mappings of a set of pixels is stored. The value for a particular pixel can be interpolated from the stored value of the neighboring pixels. Each mapping is composed of the values for six intensities uniformly distributed in the intensity spectrum (0 to 255). For a particular intensity, the value would have to be interpolated from these six values. This mapping can now be used by the im-age warpers to predistort the input imim-ages and display a seamless uniformly colored image.
Chapter 3
Display System
In this chapter, a detailed description of the display or warping system will be pre-sented. The design, implementation, and testing of each of the subsystems of the display system will be throughly described.
3.1
Display System: a General Description
The objective of the display/warping system is to correct and project the source images across the multiple projectors in real-time. The source image is warped, in other words, corrected to compensate for all distortions, using the positional, color and intensity mappings that were previously computed in the calibration phase. The image warping is implemented using FPGA (Field Programmable Gate Array) logic, since it has the flexibility to be reprogrammed.
Once the source image is warped and corrected, the system needs to be able to scan it, convert it to SVGA format (since the projectors used for the prototype are
SVGA compatible), and feed it to the array of projectors in order to display it as a
seamless image in real-time.
It is very important to notice that in order to achieve the warping and display of the system in real-time, parallelism and pipelining techniques are utilized. The
display system is composed of several identical warping subsystems each of which controls a separate projector and works simultaneously and independently.
In Figure 3-1, the block diagram of the display/warping system is presented. A special program is in charge of sending the source images to the display/warping system. In addition, the calibration tool programs the FPGA logic of the different subsystems based on the positional, color and intensity mappings computed in the calibration phase. In the prototype of the system, the special program and the cal-ibration tool are integrated in a single host program. Once the image is fed to the display system, it is divided into the different parallel subsystems. Each subsystem stores the image in a frame buffer, then warps it accordingly, and stores the cor-rected image in another frame buffer, from which the image is scanned and sent to the projectors.
Mapping/Warping Display Scanning
-- - Board 0 | mage O utput'
FPGA Space
- PCIParaiers
Application E > Driver -Board I Calibration
Pixels
Special Program Board 2
Pixels
Demo Virtual Image Space
PCI Board 3
Figure 3-1: Block diagram of the display system
3.2
Display System: a Detailed Description
The display system uses several subsystems, each of which independently controls a separate projector, in order to warp and display in real-time the source images across
the different projectors. In addition to these subsystems the system utilizes a host program as a interface between the computer and the display system.
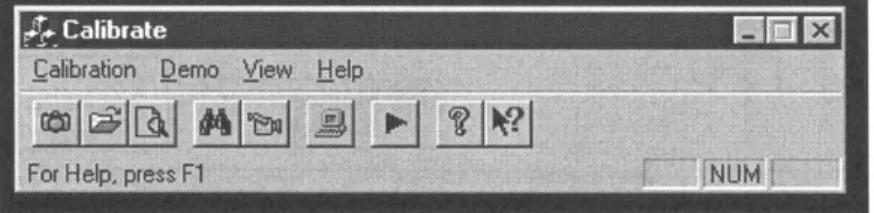
The host program is a application developed in C/C++ that serves as an in-terface between the computer and the different devices of the system. This program controls the calibration phase, producing the positional, color and intensity mappings. In addition, it programs all the FPGA logic of the different subsystems with the nec-essary parameters obtained from the calibration phase, and it performs a demo of the system by sending different source images to the display system. The graphical interface of the host program is presented in Figure 3-2.
I..
...Calbration Demo yew _He
I
For Help, p F NUM '
Figure 3-2: Graphical user interface of the host program
The display subsystems are independent and identical devices which correct and display a distorted source image based on parameters determined in the calibration phase. These subsystems are implemented in hardware to achieve real-time.
The host program on the computer needs to be able to communicate with the each of the subsystems in order to send them the source images to be displayed as well as the calibration parameters needed to execute the warping of the images. The different warping subsystems are connected to the computer through the PCI local bus due to its high data transfer rate. The PCI bus runs at a clock speed of 33 MHz with a 32-bit data bus and a peak bandwidth of 132 MBs, which is up to an order of magnitude greater than that of other PC buses (ISA, EISA or MCA). The subsystems also need to be able to read the pixels in RGB format and to convert this bitmap into a SVGA video signal to be fed into the projectors.
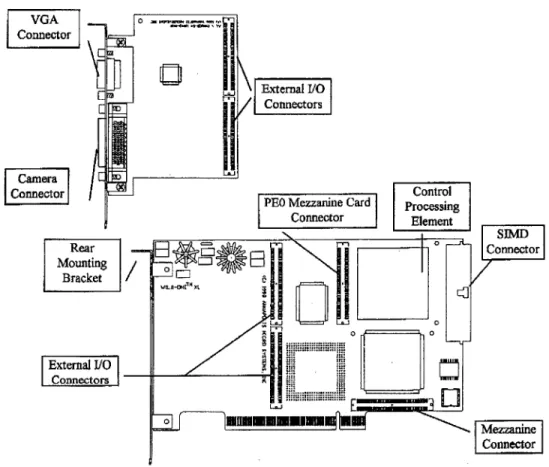
In order to accomplish these goals, each of these display subsystems is implemented using a Wild-One board, manufactured by Annapolis Microsystems. The Wild-One boards provide a hardware-based PCI interface and FPGA processing elements. They can be extended with different external I/O boards, such as a SVGA output board, and mezzanine cards, such as memory modules, as shown in Figure 3-3.
VGA Connector Camera Connector
Rear
Mounting , Bracket wnnJLf~m . Exteral 1/O ConnectorJ Externa I/O ConnectorsFigure 3-3: Wild-One board with external SVGA output board
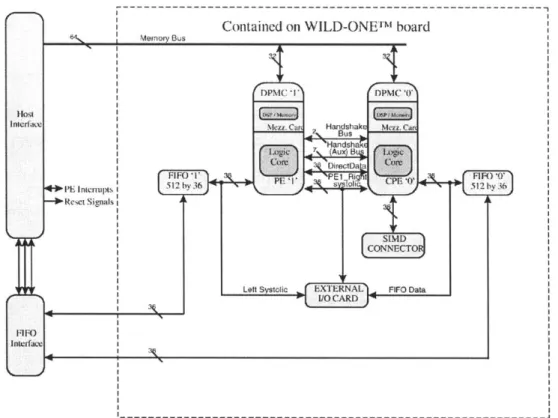
The Wild-One boards provide a very flexible architecture as seen in the block diagram shown in Figure 3-4. Each of the Wild-One cards used in the prototype contains two FPGA processing elements, Xilinx 4085xla devices, with a maximum processor clock frequency of 50MHz. Each of these processing elements (PEs) has direct access to a mezzanine card, in the case of this prototype a memory card, and to a external I/O card, in this case a SVGA output card, through different buses.
The host program can reprogram all of the FPGA logic contained in the processing elements, and send/receive data from the board through the different interfaces. The
FPGA logic in the processing elements is programmed using VHDL tools.
Contained on WILD-ONEIM board
Memory Bus
DPMC T DPMC '0
momt
Mak car . Handshak Mczz Car
Loic -r HA s a
Re~(Aut Susu
Co Q DorectData
(SlMD
CONINECTO
Left Systolic NAL FIFO Data
Figure 3-4: Block diagram of Wild-One board
Each displaying subsystem, as seen in Figure 3-5, is composed of several modules: a scanning module whose main function is to read an image frame pixel by pixel and send it to the video digital to analog converter contained in the SVGA output card with the required SVGA timing parameters, at the refreshing rate; a double frame buffer, whose main function is to store a frame of the uncorrected source image and also a frame of the corrected image which is then scanned by the scanning module; and finally, a image warping module, whose main function is to warp the source image according to the calibration mappings and store the corrected version of the image. Each of these modules will be described in more detail in this chapter.
SVGA Timing Parameters Host Source Image Frame Buffer Image Warper Frame Buffer Scanning Module Video DAC
ProgramCalibration
parameters
Figure 3-5: Block diagram of displaying subsystem
3.2.1
Scanning Module
The main function of the scanning module is to send every frame of the image (pixel
by pixel) to the SVGA output board accompanied with the required SVGA timing
parameters. A frame or image buffer stores a bitmap of the image to be displayed on the screen. Moreover, the projector scans one pixel at a time and displays all the pixels of a frame from top to bottom and left to right of the screen, as shown in
Figure 3-6. In the case of SVGA projectors, as the ones used in the prototype, the resolution of each frame is 800 x 600 pixels.
Beginning of Frame
Vertical Retrace
Horizontal Retrace
600 pixels End of Frame
Figure 3-6: Scanning of a frame
The color resolution that the system supports is true color, in other words, each pixel is composed of 24 bits and can represent one of 16777216 different colors. Each color is in RGB format, which means that 8 bits are dedicated to red color, 8 bits to green and 8 bits to blue.
In order to be able to drive the SVGA projectors, the scanning module needs to convert the RGB image bitmap into an analog SVGA video signal. The SVGA output card facilitates this task since it provides with an interface between the Wild-One card and a SVGA external output connector. Since a video DAC is included in the SVGA output card, the scanning module only needs to generate all timing parameters necessary for a SVGA signal and to scan the RGB data at the correct refreshing rate. The highest refreshing rate supported by the projectors that can be generated with the Wild-One cards is 60Hz. With this vertical refreshing rate, and a
SVGA resolution of 800 x 600 pixels, the pixel clock frequency needs to be 40 MHz.
The processing elements need to drive the SVGA output card with the correct timing parameters. The timing diagram in Figure 3-7 shows the signals necessary to drive a
SVGA video signal with a pixel clock frequency of 40 MHz. In Table 3.1, the different SVGA horizontal and vertical timing parameters are specified.
Reset 4 lines VSync S7 628 lines CSync 1e -2~~~~ liein00eie H---ync- ---800 pixels-Blank
Signal 128 pixels 26 pix
HSync
1056 pixels
Horizontal parameters
Resolution 800 pixels
Front Porch 40 pixels Sync Pulse 128 pixels
Back Porch 58 pixels Vertical parameters
Resolution 600 lines
Front Porch 1 line
Sync Pulse 4 lines Back Porch 23 lines
Table 3.1: SVGA Video Timing Parameters
It is important to notice that even if the vertical refreshing frequency of the projectors is 60Hz, the real frequency at which each frame is updated is much slower. This delay in updating a frame is due to the latency of the warping and memory modules described later.
3.2.2
Double Frame Buffer
A frame buffer is necessary to store the bitmap of the image. However the system
contains a double frame buffer structure. The first frame buffer stores the source image as received, and the second one stores the already warped image. The scanning module reads the image from the second frame buffer to send it to the video digital to analog converter.
The frame buffers are implemented using two SRAM mezzanine cards for each of the Wild-One cards. Each SRAM card contains 4MB of 32-bit data. The SRAM must allow access by the host, the image warper and the scanning or video refreshing circuitry. It is important to notice that the scanning module requires a constant, uninterrupted flow of pixel data be available to the scanning circuitry. The scanning module needs to read a pixel every 25 ns since the pixel clock frequency is 40MHz.
Fig-ure 3-8. However, this configuration presents some problems. The scanner needs to read the image pixels from memory at 40MHz and cannot be interrupted. Since the frame buffer is also accessed by the host computer and the image warper with read and write requests, the processor clock need to be at least twice as fast as the scanner clock. However. the maximum clock frequency for the Wild-One boards is
50 MHz. If this processor clock frequency is used, the frame buffer will not be able to
be accessed with read and write request besides the read requests from the scanning module. Therefore, this configuration cannot be realized.
Frame Buffer Frame Buffer
4 MB 4MB
Computer Din Dout Image Warper - Din Dout Scanner Video DAC
Maximum P rocessor Clock Pixel Clock
50MHz 40MHz
Figure 3-8: Basic configuration of double frame buffer
Since it is essential for the functionality of the display system to read and write to the frame buffers, a special configuration is utilized in the design of this module. The block diagram of the double frame buffer is presented in Figure 3-9.
Frame Buffer Frame Buffer
4 MB 4 MB
Computer Din Dout Image Warper Din Dout - Scanner - Shift Register Video DAC
Scanning Clock| Processor Clock 20MHz Pixel Clock
40MHz 40MHz
Figure 3-9: Block diagram of double frame buffer
This configuration allows the frame buffer to be accessed by the computer, the image warper and the scanning module by only using every other cycle for refreshing the video. This is accomplished by using a 64-bit frame buffer instead of a 32-bit one.
This feature can be realized in the Wild-One card, since both of the mezzanine cards (memory modules) can be accessed simultaneously. Once the frame buffer dispatches and receives 64-bit data, two pixels can be scanned in one clock cycle (each pixel is stored as a 32-bit data) and stored in the shift register in order to be refreshed at the pixel clock frequency. Even when the processor can be clocked at 40MHz, the fact that the scanner reads two pixels at a time, it leaves every other cycle to perform any write or read request from either the computer or the image warper. It is important to keep in mind that the scanning module cannot be interrupted. In this configuration, the shift register is one hundred percent of the time dedicated to refresh the image.
3.2.3
Image Warper
Digital image warping [3] is an image processing technique that deals with the geo-metric transformation of digital images. A geogeo-metric transformation is an operation that redefines the spatial relationship between points in an image. With this in mind, the source image needs to be warped according to the mappings obtained in the cal-ibration phase in order to correct the image and show a seamless and uniform image across the projectors.
In order to display the image correctly, it is necessary to resample the image as shown in Figure 3-10. Resampling is the way of interpolating the continuous input image from a discrete input image, and sampling at a point in the input image related to the output space according to the positional mappings.
There are two types of resampling techniques: forward mapping and inverse map-ping. Inverse mapping proved to be the most suited of these sampling techniques according to the study done at the Artificial Intelligence Laboratory, and therefore, this technique will be utilized in the design of the system. By using inverse mapping, each output pixel is mapped back to the input image, and determined by the pixel near the inverted point in the input, as seen in Figure 3-11.
map-Spatial Transformation
Figure 3-10: Resampling system
A . . A'
B e . B'
r 07 S ,
F'
ping does, and guarantees that all output points are colored even if not all of the input pixels might have been used. Antialiasing filters can be applied in backward resampling to reduce different visual defects caused by aliasing. The opportunities for antialiasing methods when using inverse mapping are numerous since most of them have the same cost of implementation. In this case, bilinear interpolation proved to be a good option based on visual results and cost of implementation.
Chapter 4
Conclusions and Future Work
In this chapter, the conclusions of the thesis as well as some ideas for future work will be presented.
4.1
Conclusions
In this thesis, the successful design of a scalable display subsystem capable of showing seamless high-resolution images in real-time has been presented.
The key idea in the development of such a system is its automatic calibration with the help of a feedback device. The system identifies all the optical, positional and color distortions of the projection device and creates mappings containing this information. Using these mappings, the source images are warped and then displayed in real-time as seamless, uniform, high-resolution images.
By using parallelism techniques as well as a hardware implementation of the image
warpers, the system achieves real-time displaying as well as scalability. The different warping subsystems that display the images across the multiple projectors are all independent and work simultaneously.
The results of the prototype developed are highly remarkable. In Figure 4-1, an uncorrected image is presented. Many positional, color and intensity distortions are
clearly visible. In Figure 4-2, a corrected seamless version of the image is shown. The image shows no distortions and still very high resolution.
Figure 4-1: Uncorrected image of Chaco Canyon
Figure 4-2: Corrected image of Chaco Canyon
seamless displays; and the parallelism and hardware implementation show that it is also possible to display the images in real-time without losing scalability. However, due to problems with the delivery of some of the Wild-One cards, the integration of the different subsystems and its testing is yet to be completed.
4.2
Future work
While this prototype shows that the construction of a scalable real-time seamless display is possible, there is still much work that can be done to improve it. A larger prototype or a system with a higher refreshing frequency could be built.
4.2.1
Larger Prototype System
The implementation of a larger prototype system is something desirable to prove complete scalability. Having a larger prototype might create the need for more than one camera acting as feedback system and also more than one computer. Under these circumstances, a successful operation would require to compose the input coming from multiple cameras which are viewing a single displayed image. Besides composing the inputs of the cameras, the other only issue that may come up is the positional intensity distortion from the different camera lenses. However, it seems that all the issues concerning larger prototype systems might be dealt with at the moment of implementation.
4.2.2
Higher Refreshing Frequency
A system with a higher refreshing frequency is also very desirable in order to create
displays with very high quality and zero flickering. The refreshing frequency could be improved by either using VRAM modules instead of SRAM modules, or utilizing faster FPGA boards.
References
[1] Rajeev J. Surati. Scalable Self-Calibrating Display Technology for Seamless
Large-Scale Displays. PhD thesis, Massachusetts Institute of Technology, 1998.
[2] John Watkinson. The Art of Digital Video. Focal Press, London, 1990.
[3] George Wolberg. Digital Image Warping. IEEE Computer Society Press, Los