HAL Id: cea-01135396
https://hal-cea.archives-ouvertes.fr/cea-01135396
Submitted on 25 Mar 2015
HAL is a multi-disciplinary open access
archive for the deposit and dissemination of
sci-entific research documents, whether they are
pub-lished or not. The documents may come from
teaching and research institutions in France or
abroad, or from public or private research centers.
L’archive ouverte pluridisciplinaire HAL, est
destinée au dépôt et à la diffusion de documents
scientifiques de niveau recherche, publiés ou non,
émanant des établissements d’enseignement et de
recherche français ou étrangers, des laboratoires
publics ou privés.
Herschel PEP/HerMES: the redshift evolution (0
≤ z ≤
4) of dust attenuation and of the total (UV+IR) star
formation rate density
D. Burgarella, V. Buat, C. Gruppioni, O. Cucciati, S. Heinis, S. Berta, M.
Béthermin, J. Bock, A. Cooray, J. S. Dunlop, et al.
To cite this version:
D. Burgarella, V. Buat, C. Gruppioni, O. Cucciati, S. Heinis, et al.. Herschel PEP/HerMES: the
redshift evolution (0
≤ z ≤ 4) of dust attenuation and of the total (UV+IR) star formation rate
density. Astronomy and Astrophysics - A&A, EDP Sciences, 2013, 554, pp.A70.
�10.1051/0004-6361/201321651�. �cea-01135396�
A&A 554, A70 (2013)
DOI:
10.1051/0004-6361/201321651
c ESO 2013Astronomy
&
Astrophysics
Herschel PEP/HerMES: the redshift evolution (0
≤
z
≤
4) of dust
attenuation and of the total (UV+IR) star formation rate density
?
D. Burgarella
1, V. Buat
1, C. Gruppioni
2, O. Cucciati
2, S. Heinis
1, S. Berta
3, M. Béthermin
4, J. Bock
5,6, A. Cooray
7,5,
J. S. Dunlop
8, D. Farrah
9,10, A. Franceschini
11, E. Le Floc’h
4, D. Lutz
3, B. Magnelli
3, R. Nordon
3, S. J. Oliver
9,
M. J. Page
12, P. Popesso
3, F. Pozzi
13, L. Riguccini
4, M. Vaccari
11,14, and M. Viero
51 Aix–Marseille Université, CNRS, LAM (Laboratoire d’Astrophysique de Marseille) UMR 7326, 13388 Marseille, France
e-mail: denis.burgarella@oamp.fr
2 INAF–Osservatorio Astronomico di Bologna, via Ranzani 1, 40127 Bologna, Italy
3 Max-Planck-Institut für Extraterrestrische Physik (MPE), Postfach 1312, 85741 Garching, Germany
4 Laboratoire AIM-Paris-Saclay, CEA/DSM/Irfu – CNRS – Université Paris Diderot, CE-Saclay, pt courrier 131,
91191 Gif-sur-Yvette, France
5 California Institute of Technology, 1200 E. California Blvd., Pasadena, CA 91125, USA 6 Jet Propulsion Laboratory, 4800 Oak Grove Drive, Pasadena, CA 91109, USA
7 Dept. of Physics & Astronomy, University of California, Irvine, CA 92697, USA
8 Institute for Astronomy, University of Edinburgh, Royal Observatory, Blackford Hill, Edinburgh EH9 3HJ, UK 9 Astronomy Centre, Dept. of Physics & Astronomy, University of Sussex, Brighton BN1 9QH, UK
10 Department of Physics, Virginia Tech, Blacksburg, VA 24061, USA
11 Dipartimento di Fisica e Astronomia, Università di Padova, vicolo Osservatorio, 3, 35122 Padova, Italy
12 Mullard Space Science Laboratory, University College London, Holmbury St. Mary, Dorking, Surrey RH5 6NT, UK 13 INAF – Osservatorio Astronomico di Roma, via di Frascati 33, 00040 Monte Porzio Catone, Italy
14 Astrophysics Group, Physics Department, University of the Western Cape, Private Bag X17, 7535 Bellville, Cape Town,
South Africa
Received 5 April 2013/ Accepted 29 April 2013
ABSTRACT
Using new homogeneous luminosity functions (LFs) in the far-ultraviolet (FUV) from VVDS and in the far-infrared (FIR) from Herschel/PEP and Herschel/HerMES, we studied the evolution of the dust attenuation with redshift. With this information, we were able to estimate the redshift evolution of the total (FUV+ FIR) star formation rate density (SFRDTOT). By integrating SFRDTOT, we
followed the mass building and analyzed the redshift evolution of the stellar mass density (SMD). This article aims at providing a complete view of star formation from the local Universe to z ∼ 4 and, using assumptions on earlier star formation history, compares this evolution with previously published data in an attempt to draw a homogeneous picture of the global evolution of star formation in galaxies. Our main conclusions are that: 1) the dust attenuation AFUVis found to increase from z= 0 to z ∼ 1.2 and then starts to
decrease until our last data point at z= 3.6; 2) the estimated SFRD confirms published results to z ∼ 2. At z > 2, we observe either a plateau or a small increase up to z ∼ 3 and then a likely decrease up to z = 3.6; 3) the peak of AFUVis delayed with respect to
the plateau of SFRDTOTand a probable origin might be found in the evolution of the bright ends of the FUV and FIR LFs; 4) using
assumptions (exponential rise and linear rise with time) for the evolution of the star formation density from z= 3.6 to zform= 10, we
integrated SFRDTOTand obtained a good agreement with the published SMDs.
Key words.early Universe – cosmology: observations – galaxies: star formation – infrared: galaxies – galaxies: starburst – ultraviolet: galaxies
1. Introduction
One of the main objectives in astrophysics during the past
15 years has been to follow the cosmic star formation rate
den-sity (SFRD) at ever earlier epochs. But whenever optical data are
used, one must apply a dust correction to the luminosity
densi-ties (LDs) and a calibration into SFRDs (with their associated
uncertainties) to obtain a relevant estimate. Knowing how the
dust attenuation evolves in redshift is therefore mandatory if one
wishes to study the redshift evolution of the SFRD.
For instance,
Takeuchi et al.
(
2005
) estimated the cosmic
evolution of the SFRD from the ultraviolet (FUV) and
far-infrared (FIR
= bolometric IR). They found an increase of the
?
Herschel is an ESA space observatory with science instruments provided by European-led Principal Investigator consortia and with im-portant participation from NASA.
fraction of hidden SFR from 56% locally to 84% at z
= 1. The
LDs show a significant evolution because the FIR LD evolves
faster than the FUV. Their ratio ρ
FIR/ρ
FUVincreases from ∼ 4
(A
FUV∼ 1.3 mag) locally to ∼15 (A
FUV∼ 2.3 mag) at z
= 1.
Cucciati et al.
(
2012
) used the VIMOS-VLT Deep Survey to
show from the FUV only that the mean dust attenuation A
FUVagrees with
Takeuchi et al.
(
2005
) over the range 0 < z < 1.
Then it remains at the same level to z ∼ 2, and declines to ∼ 1
mag at z ∼ 4.
In this article, we use the FUV luminosity functions (LFs)
published in
Cucciati et al.
(
2012
) from the VLT along with
the FIR LFs from Herschel
/PACS and SPIRE data
1of a
1 From two Herschel large programmes: PACS evolutionary probe
(PEP,Lutz et al. 2011) and the Herschel Multi-tiered Extragalactic Survey (HerMES,Oliver et al. 2012).
A&A 554, A70 (2013)
PACS-selected sample (
Gruppioni et al. 2013
) to constrain the
redshift evolution of log
10(L
FIR/L
FUV) (aka IRX) to z ∼ 4 for
the first time directly from FIR data. With this information,
we can estimate the redshift evolution of ρ
FIR/ρ
FUVas well as
ρ
TOT= ρ
FIR+ρ
FUV. Finally, by integrating ρ
TOT, we estimate the
cosmic evolution of the stellar mass density (SMD) with
red-shift.
Throughout this paper we adopt a
ΛCDM cosmology with
(H
0, Ω
m, Ω
Λ)
= (70, 0.3, 0.7), where H
0is in km s
−1Mpc
−1.
All SFR and stellar masses presented assume, or have been
con-verted to, a Salpeter IMF.
2. Luminosity functions
Our analysis at z ∼ 0 is based on the FUV LF from
Wyder
et al.
(
2005
) and the FIR LF from
Takeuchi et al.
(
2005
), and
for 0 < z < 4 on the FUV LF from
Cucciati et al.
(
2012
)
and the FIR LF from
Gruppioni et al.
(
2013
). In the FIR and
at z > 0, the sample was selected in the PACS bands but used the
full Herschel
/PACS + Herschel/SPIRE SED data. The PACS
se-lection means that we can miss sources toward the upper end
of the redshift range. The LFs were evaluated from
homoge-neous datasets in the FUV and the FIR. This minimizes biases
and keeps the same reference indicator throughout cosmic times
with a simple well-defined and controlled selection function.
This is one of the strengths of this work. The FUV LFs were
not corrected for dust attenuation. We defined the LFs as a
num-ber density of galaxies with luminosity in logarithmic intervals,
[log
10L, log
10L
+ d log
10L], where
Φ(L) = dn/d log
10L
and the
luminosity is defined as L ≡ νL
ν. FIR luminosities were defined
as
Φ(L) = Φ
?(
LL?)
1−αexp(−
1 2σ2[log
10(1
+
L L?)]
2).
Observed uncertainties from
Cucciati et al.
(
2012
) and from
Gruppioni et al.
(
2013
) were used whenever available. However,
some of the Schechter parameters were fixed when the LFs were
derived, namely α for the FUV LFs and α plus σ for the FIR LFs.
Both in FUV and in FIR, we assumed uncertainties of 10% up to
z
= 1, 20% up to z = 2 and 40% beyond for these fixed
parame-ters. This level of uncertainty is similar to that of previous works
in FUV (e.g.
Oesch et al. 2010
;
van den Burg et al. 2010
) and in
FIR (
Casey et al. 2012
). We propagated uncertainties by
simulat-ing 2000 realizations drawn from 1σ Gaussian distributions for
each parameter with known uncertainties and from a flat
distri-bution (i.e., equiprobability) for the fixed ones. We assumed that
all fixed values are equiprobable given the weak observational
constraints. Finally, we interpolated the FUV and FIR Schechter
parameters on the same redshift grid between z
= 0 and z = 3.6.
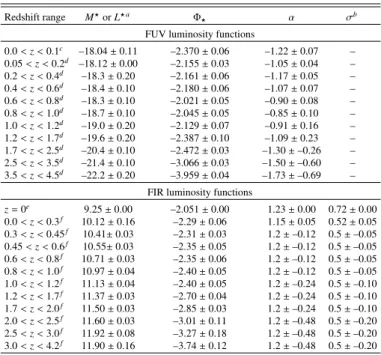
Table
1
and Fig.
1
show the redshift variation of the
LFs in FIR. The known di
fference in the FIR and FUV LFs
(e.g.
Takeuchi et al. 2005
) are clearly illustrated here: bright
FIR galaxies are more numerous than bright FUV galaxies at
log
10(L[L
]) > 10. In the FUV, except in the highest redshift
bins, L
?and
Φ
?remain approximately constant while the
faint-end slope evolves. The FIR faint faint-end slope is not
observation-ally constrained at high z, and
Gruppioni et al.
(
2013
) fixed it
to α
= 1.2. However, L
?and
Φ
?were allowed to change with
redshift. These di
fferent evolutions of the FUV and FIR LFs are
reflected in Fig.
1
and explain the evolution of the cosmic SFRD
and dust attenuation.
3. Dust attenuation traced by the FIR-to-FUV
LD ratio
Figure
2
presents the dust attenuation in the FUV vs. z and
the ratio of the FIR-to-FUV LDs integrated in the range
Table 1. Schechter parameter for FUV and FIR luminosity functions.
Redshift range M?or L?a Φ? α σb
FUV luminosity functions
0.0 < z < 0.1c –18.04 ± 0.11 –2.370 ± 0.06 –1.22 ± 0.07 – 0.05 < z < 0.2d –18.12 ± 0.00 –2.155 ± 0.03 –1.05 ± 0.04 – 0.2 < z < 0.4d –18.3 ± 0.20 –2.161 ± 0.06 –1.17 ± 0.05 – 0.4 < z < 0.6d –18.4 ± 0.10 –2.180 ± 0.06 –1.07 ± 0.07 – 0.6 < z < 0.8d –18.3 ± 0.10 –2.021 ± 0.05 –0.90 ± 0.08 – 0.8 < z < 1.0d –18.7 ± 0.10 –2.045 ± 0.05 –0.85 ± 0.10 – 1.0 < z < 1.2d –19.0 ± 0.20 –2.129 ± 0.07 –0.91 ± 0.16 – 1.2 < z < 1.7d –19.6 ± 0.20 –2.387 ± 0.10 –1.09 ± 0.23 – 1.7 < z < 2.5d –20.4 ± 0.10 –2.472 ± 0.03 –1.30 ± –0.26 – 2.5 < z < 3.5d –21.4 ± 0.10 –3.066 ± 0.03 –1.50 ± –0.60 – 3.5 < z < 4.5d –22.2 ± 0.20 –3.959 ± 0.04 –1.73 ± –0.69 –
FIR luminosity functions
z= 0e 9.25 ± 0.00 –2.051 ± 0.00 1.23 ± 0.00 0.72 ± 0.00 0.0 < z < 0.3f 10.12 ± 0.16 –2.29 ± 0.06 1.15 ± 0.05 0.52 ± 0.05 0.3 < z < 0.45f 10.41± 0.03 –2.31 ± 0.03 1.2 ± –0.12 0.5 ± –0.05 0.45 < z < 0.6f 10.55± 0.03 –2.35 ± 0.05 1.2 ± –0.12 0.5 ± –0.05 0.6 < z < 0.8f 10.71 ± 0.03 –2.35 ± 0.06 1.2 ± –0.12 0.5 ± –0.05 0.8 < z < 1.0f 10.97 ± 0.04 –2.40 ± 0.05 1.2 ± –0.12 0.5 ± –0.05 1.0 < z < 1.2f 11.13 ± 0.04 –2.40 ± 0.05 1.2 ± –0.24 0.5 ± –0.10 1.2 < z < 1.7f 11.37 ± 0.03 –2.70 ± 0.04 1.2 ± –0.24 0.5 ± –0.10 1.7 < z < 2.0f 11.50 ± 0.03 –2.85 ± 0.03 1.2 ± –0.24 0.5 ± –0.10 2.0 < z < 2.5f 11.60 ± 0.03 –3.01 ± 0.11 1.2 ± –0.48 0.5 ± –0.20 2.5 < z < 3.0f 11.92 ± 0.08 –3.27 ± 0.18 1.2 ± –0.48 0.5 ± –0.20 3.0 < z < 4.2f 11.90 ± 0.16 –3.74 ± 0.12 1.2 ± –0.48 0.5 ± –0.20
Notes. The top panel lists the FUV LFs, the bottom panel the FIR LFs. For all parameters with an uncertainty set to 0.00, we assumed a 20% or error.(a)L?[L
] for FIR LFs or M?[AB mag] for FUV LFs;(b)σ only
needed for FIR LFs;(c)fromWyder et al.(2005);(d)fromTakeuchi et al.
(2005);(e)Cucciati et al.(2012);( f )Gruppioni et al.(2013).
7 8 9 10 11 12 13 14
log
10(
L/L
¯)
10-8 10-7 10-6 10-5 10-4 10-3 10-2 10-1 100Φ
[
M
pc
− 3de
x
− 1]
IR z=0 IR 0.0<z<0.3 IR 0.3<z<0.45 IR 0.45<z<0.6 IR 0.6<z<0.8 IR 0.8<z<1.0 IR 1.0<z<1.2 IR 1.2<z<1.7 IR 1.7<z<2.0 IR 2.0<z<2.5 IR 2.5<z<3.0 IR 3.0<z<4.2 UV 0.00<z<0.1 UV 0.05<z<0.2 UV 0.2<z<0.4 UV 0.4<z<0.6 UV 0.6<z<0.8 UV 0.8<z<1.0 UV 1.0<z<1.2 UV 1.2<z<1.7 UV 1.7<z<2.5 UV 2.5<z<3.5 UV 3.5<z<4.5Fig. 1.Redshift evolution of the FIR (red,Gruppioni et al. 2013) and FUV (blue,Cucciati et al. 2012) LFs. Note that the FUV LFs are uncor-rected for dust attenuation. The LFs at every other redshift are plotted in bold. The others are fainter to facilitate reading the figure. The LFs are plotted within the limits of integration.
log
10(L[L
])
= [7, 14] in the FUV (i.e. L
minFUV= 1.65 × 10
−4L
?z=3,
Bouwens et al. 2009
) and [8, 14] in the FIR. The FUV dust
attenuation is estimated from the IRX and converted to A
FUVusing
Burgarella et al.
(
2005
)
2. The redshift evolution of A
FUVagrees with
Cucciati et al.
(
2012
). Note that
Cucciati et al.
(
2012
)
estimated A
FUVthrough an analysis of individual SEDs up to
2 The conversion from IRX to A
FUV fromBurgarella et al.(2005) is
valid at log10(LFIR/LFUV) > −1.2: AFUV= −0.028 [log10LFIR/LFUV]3+
0.392[log10LFIR/LFUV]2+ 1.094[log10LFIR/LFUV]+ 0.546.