Data-Driven Customer Segmentation and
Personalized Information Provision in Public Transit
by
Abhishek Arunasis Basu
B.Tech., Civil Engineering
Indian Institute of Technology Madras (2015)
Submitted to the Department of Civil and Environmental Engineering
in partial fulfillment of the requirements for the degree of
Master of Science in Transportation
at the
MASSACHUSETTS INSTITUTE OF TECHNOLOGY
June 2018
Massachusetts Institute of Technology 2018. All rights reserved.
Signature redacted
A u th or ...
...
Department of Civil and Environmental Engineering
Certified by...Signature
redacted
May 17, 2018
Jinhua Zhao
Edwar{H. a / Joyce Linde Associate Professor of
Transportation and City Planning
Signature redacted
Thesis Supervisor
C ertified by ... ...
Haris N. Koutsopoulos
Professor of Civil and Environmental Engineering
Northeastern University
Thesis Supervisor
Certified by...
Signature redacted
...
Rabi G. Mishalani
Visiting Professoyp Dep~grgent of Urban Studies and Planning
Accepted by...Signature
redactedThesis
Supervisor
MASSACHUSETTS INSE
Jesse Kroll
OF TECHNOLOGY
Professor of Civil and Environmental Engineering
JUL
26
2018
Chair, Graduate Program Committee
Data-Driven Customer Segmentation and Personalized
Information Provision in Public Transit
by
Abhishek Arunasis Basu
Submitted to the Department of Civil and Environmental Engineering on May 17, 2018, in partial fulfillment of the
requirements for the degree of Master of Science in Transportation
Abstract
To ensure customer satisfaction, a transit agency must strive to understand and cater to its users' needs. The goal of this research is to develop a framework that could help the transit agency to better understand its users and their behaviors. Segmentation of the market for transit users is the first step, since it allows for the understanding of heterogeneity in their characteristics and their varying requirements, at a granular level as opposed to an aggregate one. In this study, we create a framework, which uses smart card data, to identify customer segments.
The framework developed in this study includes a segmentation scheme that cre-ates segments based on the spatial and temporal characteristics of the travel behavior of customers. Data from Hong Kong's MTR system were used to demonstrate the practical application of the developed segmentation methodology. In doing so, a thorough analysis was conducted to interpret the specifics of the identified segments.
The segmentation scheme created in this study is capable of catering to meaning-ful applications that could serve both the agency and the users of the transit system. A few applications explored in the context of this study include the use of the cus-tomer segmentation framework for the provision of personalized information. It was demonstrated how targeted information could be provided to users who may likely be affected by a particular service disruption event. In addition, the segmentation framework was used to understand the impact of changes in the network, through a before-and-after analysis where the impact on customer travel patterns due to the provision of service on the newly opened South Island Line is adopted as a case study. Lastly, a predictive transit smart card attrition model was developed by using the features created for the purpose of segmentation. The framework for segmentation developed in this study was found to be useful for multiple applications. Furthermore, the framework is flexible and, therefore, could be generalized for use to address other
applications and across other agencies. Thesis Supervisor: Jinhua Zhao
Title: Edward H. and Joyce Linde Associate Professor of Transportation and City Planning
Thesis Supervisor: Haris N. Koutsopoulos
Title: Professor of Civil and Environmental Engineering Northeastern University
Thesis Supervisor: Rabi G. Mishalani
Acknowledgments
I wish to express my gratitude towards my advisors, Prof. Jinhua Zhao, Prof. Haris Koutsopoulos and Prof. Rabi Mishalani for their guidance, support and encourage-ment throughout this research. I am eternally grateful to you for your time, and I cannot express, in words, how much you've contributed to my growth.
I would also like to thank the staff at MTR, especially Pandora Leung, Felix Ng and Henry Lo for providing every possible support during this research, and ensuring our visits to Hong Kong were comfortable and fruitful.
I'd like to thank my friends on the MTR project, Kenji, Tianyou and Mike, for our interesting discussions. I'd like to thank Gabriel and Zhan for their generous support. I'd also like to thank all my colleagues in the Transit Lab, Andy, Eli, Leo, Yiwen, Jian; and my friends from IIT.
Thank you mom and dad, for your support. This thesis would not have been possible without you.
Contents
1 Introduction
1.1 Background and Motivation . . . .
1.2 Research objectives . . . .
1.3 Thesis organization . . . .
2 Literature review
2.1 Customer segmentation . . . .
2.1.1 Market segmentation in public transit . . .
2.2 Information provision . . . . 2.3 Customer attrition . . . . 2.4 Lessons learnt . . . . 3 Methodology 3.1 Introduction . . . . 3.1.1 Characteristics of applications . . . .
3.1.2 Description of overall approach . . . .
3.1.3 Structure of segmentation . . . .
3.2 Short-term segments . . . .
3.2.1 Features for short-term segmentation . . .
3.2.2 Creation of short-term segments . . . .
3.2.3 Temporal stability of short-term segments
3.3 Long-term segments . . . .
3.3.1 Features for long-term segmentation . . . .
17 17 20 21 23 . . . . 24 . . . . 24 . . . . 28 . . . . 31 . . . . 34 37 . . . . 37 . . . . 38 . . . . 39 . . . . 40 . . . . 41 . . . . 42 . . . . 43 . . . . 45 . . . . 47 . . . . 47
3.3.2 3.3.3 3.3.4
Creation of long-term segments . . . .
Temporal stability of long-term segments . . . .
Segments based on similar spatial spread . . . . 4 Customer segmentation: results and analysis
4.1 MTR overview . . . .
4.2 Data used in the study . . . .
4.2.1 Data used for creating short-term segments .
4.2.2 Data used for creating long-term segments .
4.3 Short-term segments . . . .
4.3.1 Correlation among features and PCA . . . .
4.3.2 Determining the optimal number of clusters
4.3.3 Temporal segments . . . .
4.3.4 Spatial segments . . . .
4.3.5 Temporal stability of short-term segments
4.4 Long-term segments . . . .
4.4.1 Correlation among features and PCA . . . .
4.4.2 Determining the optimal number of clusters
4.4.3 Four-segment configuration . . . .
4.4.4 Eight-segment configuration . . . .
4.4.5 Temporal stability of long-term segments . .
4.4.6 Selection of configuration for further study .
4.4.7 Shifts among segments . . . .
4.4.8 Home station changes . . . .
4.4.9 Extending results to other years . . . .
4.4.10 Spatial-spread based segments . . . . 5 Personalized information provision
5.1 O verview . . . .
5.2 Framework . . . .
5.3 Targeted information provision during incidents . . . .
52 52 52 57 57 . . . . 58 . . . . 58 . . . . 58 . . . . 59 . . . . 59 . . . . 61 . . . . 63 . . . . 70 . . . . 79 . . . . 80 . . . . 80 . . . . 83 . . . . 83 . . . . 92 . . . . 102 . . . . 104 . . . . 105 . . . . 109 . . . . 109 . . . . 111 117 117 119 122
5.3.1 Exam ple I . . . .
5.3.2 Example II ... ...
5.3.3 Post hoc analysis . . . .
5.4 D iscussion . . . . 6 Before-and-after analysis: South Island Line
6.1 Overview of the South Island Line (SIL) . . .
6.2 Analysis Framework . . . .
6.3 Insights from short-term segments . . . . 6.4 Insights from long-term segments . . . .
6.5 Insights from home station inference . . . . .
6.6 Insights based on short-term features . . . . . 6.7 D iscussion . . . . 7 Smart card attrition
7.1 Attrition in the context of this study . . . . .
7.2 Problem formulation . . . .
7.3 Predicting attrition . . . .
7.3.1 Month-specific attrition model . . . . .
7.3.2 Unified attrition model . . . .
7.4 Potential pitfalls . . . . . . . . 124 . . . . 126 . . . . 127 . . . . 130 135 135 136 138 139 143 151 153 155 . . . . 155 . . . . 157 . . . . 160 . . . . 161 . . . . 166 . . . . 167 8 Conclusion 8.1 Sum m ary . . . . 8.2 Contributions . . . .
8.3 Limitations and avenues for future research . . . .
A MTR Network
B Descriptive statistics and density plots of long-term features
171 171 172 173 175 179
List of Figures
3-1 Applications supported by the segmentation scheme . . . . 38
3-2 Customers who are assigned each type of segment . . . . 41
3-3 Spatial zones defined in this study . . . . 44
4-1 Correlation among the temporal features . . . . 60
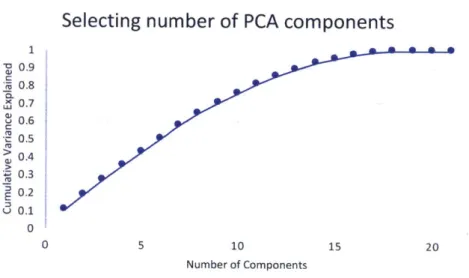
4-2 Cumulative variance explained versus the number of PCA components selected (temporal features) . . . . 60
4-3 Correlation among the spatial features . . . . 61
4-4 Cumulative variance explained versus the number of PCA components selected (spatial features) . . . . 62
4-5 Value of DB index versus number of clusters (temporal segments) . . 62
4-6 Value of DB index versus number of clusters (spatial segments) . . . 63
4-7 Plot of TP values for each temporal segment . . . . 70
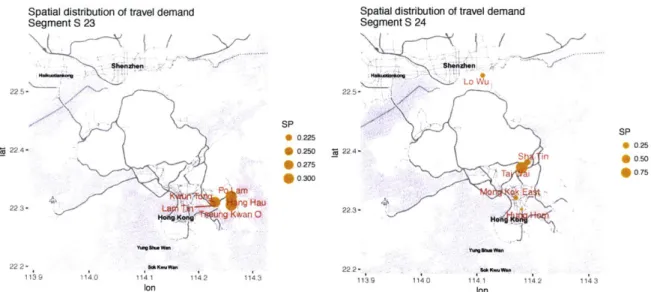
4-8 Plot of SP values of the five most important stations for each spatial segm ent . . . . 79
4-9 Correlation among the long-term features . . . . 82
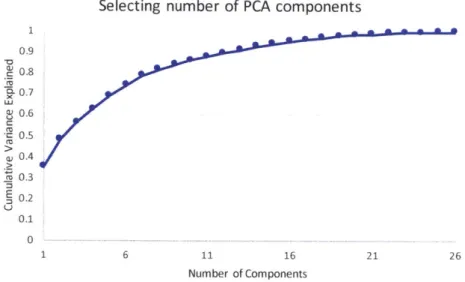
4-10 Cumulative variance explained versus the number of PCA components selected (long-term features) . . . . 83
4-11 Value of DB index versus number of clusters (long-term segments) . . 84
4-12 Distribution of feature values for the four-segment solution . . . . 88
4-13 Number of users in each segment for four-segment configuration . . . 89
4-14 Distribution of feature values for the eight-segment solution . . . . . 97
4-16 Average time of completion of first trip of day (and the deviation) for
each segm ent . . . . 105
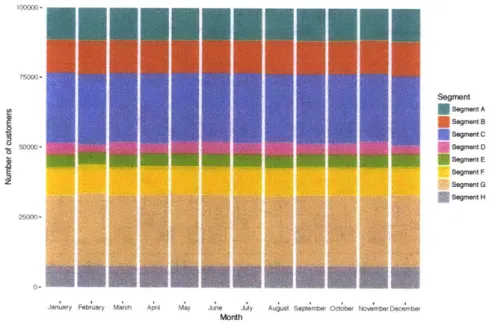
4-17 Number of customers in each long-term segment across months in the year 2015 . . . . 106
4-18 Aggregate number of shifts as a percentage of the sample (100,000 users) 107 4-19 Shifts among the long-term segments in the year 2015 . . . . 114
4-20 Distribution of users based on the number of changes in the inferred hom e station . . . . 115
4-21 Distribution of users based on the number of unique home stations, in the year 2015 ... ... 115
4-22 Number of customers in each long-term segment across months in the year 2016 . . . . 116
4-23 Representative medoids for the spatial-spread segments . . . . 116
5-1 Screenshots of MTR's smartphone application (Source: MTR) . . . . 120
5-2 The overall personalized information provision system . . . . 121
5-3 Distribution of long-term users who were affected due to the incident 129 5-4 Comparison of mean distance of users who return to incident location to users who do not . . . 129
5-5 Dashboard to select users who would be provided targeted information in the event of an incident . . . . 132
5-6 Dashboard for customer metrics (segmentation features) . . . . 133
6-1 MTR network map with the South Island Line marked . . . . 136
6-2 Utilization of stations on the SIL for trips by long-term users . . . . . 137
6-3 November 2016 temporal short-term segments for long-term users who utilize SIL in M arch 2017 . . . . 140
6-4 November 2016 spatial short-term segments for long-term users who utilize SIL in M arch 2017 . . . 141
6-5 Long-term segments for long-term users (November 2016 and March 2017) . . . . 144
6-6 Shifts (transitions) within long-term segments (November 2016 and
March 2017) split based on low or high usage of SIL . . . 145
6-7 Proportion of users versus number of trips, split by whether their in-ferred home station lies on SIL . . . . 146
6-8 Number of customers versus inferred home station of users in November 2016 split by whether their inferred home station lies on SIL in March 2017 (Station codes in Table A.1) . . . . 147
6-9 Most frequent inferred home stations (November 2016) . . . . 147
6-10 Shifts (transitions) within long-term segments (November 2016 and March 2017) split based on whether inferred home station lies on SIL or not ... .. ... 148
6-11 Average SP values for long-term users (November 2016 and March 2017)149 6-12 Average TP values for long-term users (November 2016 and March 2017)150 6-13 Difference in average SP values . . . . 152
6-14 Difference in average TP values . . . . 152
7-1 Two long-term user cards (2015) which show reduction in usage in 2016 158 7-2 Number of long-term user cards which attrition in each month . . . . 160
7-3 Decision tree solution for March 2016 data . . . . 161
7-4 Decision tree solution for April 2016 data . . . . 161
7-5 Decision tree solution for May 2016 data . . . . 162
7-6 Decision tree solution for June 2016 data . . . . 162
7-7 ROC curve for the logit model . . . . 164
7-8 Cross-validation curve for penalized logistic regression model . . . . . 166
A-1 MTR network map (Source: MTR, Fall 2017) . . . . 177
THIS PAGE INTENTIONALLY LEFT BLANK
List of Tables
4.1 Temporal stability of temporal segments as measured against October
2016 data (base data: May 2016) . . . . 80
4.2 Temporal stability of spatial segments as measured against October 2016 data (base data: May 2016) . . . . 81
4.3 Four-segment configuration: segment-wise average feature values . . . 84
4.4 Eight-segment configuration: segment-wise average feature values . . 93
4.5 Temporal stability of four-segment solution (January to May and Jan-uary to October) . . . . 103
4.6 Temporal stability of eight-segment solution (January to May and Jan-uary to October) . . . . 103
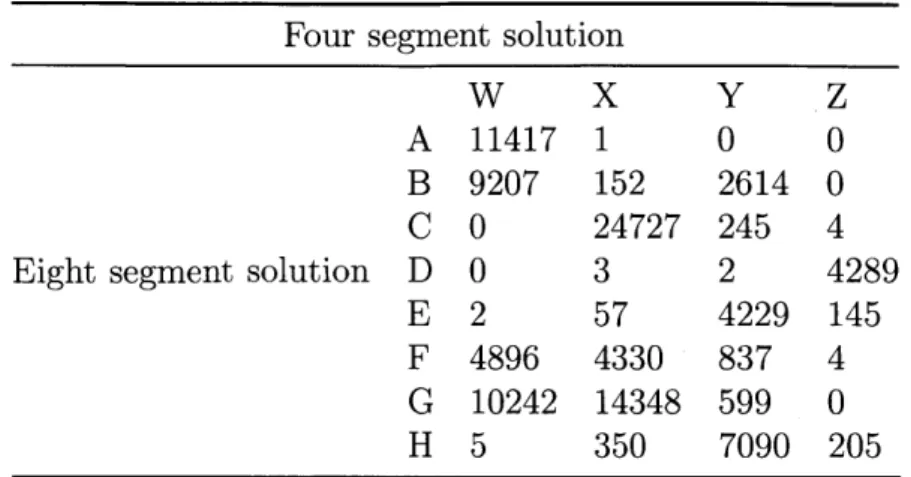
4.7 Cross tabulation of membership among the four-segment and eight-segm ent solutions . . . . 104
4.8 Number of home station changes versus number of unique home stations110 4.9 Temporal stability of the eight-segment solution in the year 2016 . . .111
6.1 Spatial-spread based segment shifts for users whose home station is not on the SIL in the month of March 2017 . . . . 149
6.2 Spatial-spread based segment shifts for users whose home station is on the SIL in the month of March 2017 . . . . 150
7.1 Results for monthly models . . . . 163
7.2 Logit model estimation results . . . . 163
7.3 Results for unified model . . . . 164
MTR station names and codes (Source: MTR) . . . . 176 Descriptive statistics for the features selected for long-term segmentation180 A.1
Chapter 1
Introduction
1.1
Background and Motivation
Pervasive adoption of "smart" systems (sensing, monitoring, information and control) has ushered in an era that has witnessed an unprecedented rise in data collection. The public transportation industry is among many industries that have been able to tap in to this data boom, with considerable share of data partly gathered through the use transit smart cards, which are well on their way towards becoming the ubiquitous fare payment mechanism (Pelletier et al., 2011) across transit agencies. Apart from serving as a seamless mechanism of fare payment, the rise in the use of smart cards in public transportation has led to the availability of disaggregate data on users' travel patterns. Given the enormity of such data now available to transit agencies across the globe, and the fact that the amount of data available to agencies is expected to grow in the near future, it is important to question how these data might be utilized for the betterment of transit systems and their customers.
This 'opportunistic' data collected from transit smart card systems could help in transforming the practice of public transportation planning, service design and op-erations. While the data collected may be shallow in terms of not including demo-graphic and socio-economic information about smart card users, when compared to traditional sources of data collected through self-report surveys which are expensive, labor intensive, and time-consuming to administer and as a result of very small
sam-ple sizes is cross-sectional in nature, they provide the benefit of being available for a large proportion of travelers and over a continuous and long time period. There-fore, as long as the user interacts with fare gates using smart card as their mode of payment, their activity within the transit network would be known to the agency. While self-reporting surveys-whether manually or electronically administered-will continue to have an valuable role in gathering important information about travelers, in the era of automated data, sources such as smart card systems will continue to increase in use as such systems are adopted by agencies and users.
The data collected from smart cards could provide valuable insights into the typical travel patterns of individual users and would allow for aggregation to unravel the dominant travel patterns. These dominant travel patterns, in turn, could be used to identify the customer segments that use the system. As we see in Chapter 2, the use of smart card data towards this goal is backed by past studies which have confirmed that these data could be utilized to identify differences in travel behavior among users of the transit system. More specifically, clustering users based on similar travel be-havior to identify user segments could provide useful insights to the transit agency. Studies have also shown that smart card data could be potentially used to support other applications as well. For instance, as is demonstrated in this thesis, insights obtained from smart card data could be used to provide personalized information in the context of transit, study the impacts of changes in service, and investigate changes in usage over time.
This research develops to create a framework to aid transit agencies to understand the different customer groups that use its service. By analyzing the difference in spatial and temporal travel behavior among customers, and by then grouping or clustering together customers that exhibit similar travel behaviors, the transit agency can bet-ter understand the characbet-teristics of typical users of the transit system. Through this understanding, the transit agency can gain insight into the specific needs of the customer groups, and can then strive to cater to the needs of these customer groups, thereby paving the way to better customer satisfaction. As elaborated in Chapter 2, research backs the potential of segmentation in identifying customer groups in order
to provide them with targeted services. Moreover, studies also show that such seg-mentation of customers is feasible by utilizing transit smart card data.
Given the abundance of availability of transit smart card data, and given the fact that the collection of such data comes from the use of smart cards as fare payment media, it makes sense to utilize them to create customer segments. While smart card data could be used to understand the spatial and temporal characteristics of the travel pattern of users, and distinguish among them, it is necessary to recognize that the quantity of data available for customers varies. Naturally, there are considerable differences among infrequent users and frequent users of the service. The segmenta-tion of customers, therefore, could benefit by addisegmenta-tionally distinguishing customers on the basis of varying levels of data availability pertaining to them. Doing so helps in enhancing the insights gleaned from the various types of customers that utilize the service.
After the identification of customer segments, the transit agency can distinguish among these customer segments to tailor specific services based on perceived needs of these segments. Moreover, the shifts among these segments, especially in response to changes such as fare changes and network expansions. could help the agency analyze the impact of its decisions. Such impacts of changes need not be restricted to solely service-related factors and could be extrinsic to the system, for instance changes in characteristics of other modes. Such shifts could provide the agency insights into how customer segments, grouped together on the basis of similar spatial and temporal characteristics, behave in response to a change.
Real-time information for transit users is useful and provides multiple benefits. With the availability of automated sources of data, transit agencies have been able to pro-vide real-time information to users, often at no additional cost. However, the trend across industries, shows the necessity to target this information to users who may need that particular type of information. The knowledge of customer segments that use the service could be used, therefore, to target this information towards users that need it the most. Such targeting could be viewed as an effort towards personaliza-tion and, therefore, customer segmentapersonaliza-tion could form the basis of such personalized
information provision to customers.
1.2
Research objectives
The primary goal of this research is to develop a framework that could help the transit agency to better understand its users. Segmentation of the market for transit users is the first step, since it allows for the understanding of heterogeneity in their travel characteristics and helps in inferring their varying needs, at a granular level as opposed to system-level aggregate analysis. The framework shall be created by using transit smart card data and should be capable of catering to meaningful applications that could serve both the transit agency and the users of the transit system.
The secondary goal of this research is to utilize the customer segmentation framework for the following,
" Provision of personalized information provision in the context of transit. Doing so includes the following:
- Creating a mechanism which uses the customer segmentation framework
as a building block for provision of targeted information.
- Exploring its applicability for information provision during service
disrup-tions.
* Developing a procedure for analyzing the heterogeneity in the impact of changes (intrinsic to the transit service or extrinsic) on different customer groups. Doing so includes the following:
- Using components of the customer segmentation framework to show its
applicability for analyzing corresponding ridership changes to obtain in-sights.
- Demonstrate the process by using a relevant case study as an illustrative
Data from MTR's smart card system, the Octopus card, were utilized in this study. It is important to point out that while data from a specific agency was used to illustrate the efficacy of the framework developed here, the framework developed is highly generalizable to other agencies that use smart card mode of payment, with requisite adjustments which we claim are relatively minor.
1.3
Thesis organization
The rest of this thesis is organized as follows. Chapter 2 explores past research conducted in the field of market segmentation, and more specifically in the domain of public transit. It also discusses literature in the topics of information provision and customer attrition. Chapter 3, covers the key methodological techniques which have been utilized in this study, to identify customer segments among transit users using Hong Kong's MTR system. Following this, the data utilized in this study and the results of customer segmentation are presented in Chapter 4. The rest of the chapters, barring the last, each look at the applications that the segmentation scheme developed in this study could potentially serve. Chapter 5 looks at personalized information provision to transit users and discusses some novel ways in which targeted information could be provided to users to try and ensure that it is relevant to the user. Chapter 6 discusses how the customer segmentation could aid in the analysis of before-and-after studies and explores a specific case of network expansion as an illustrative example.
Chapter 7 describes the creation of a predictive attrition model that could potentially
aid the agency to predict smart cards which may exhibit reduction in usage in the near future. Finally, Chapter 8 summarizes the main findings in this study, and discusses some of the limitations and possible future research directions.
Chapter 2
Literature review
Smart cards offer numerous benefits, which could be classified into strategic, tactical and operational (Pelletier et al., 2011). Therefore, these benefits can range from aid-ing in day-to-day operations, to long-term network plannaid-ing. Broadly, these smart card systems could be either tap-in only or tap-in and tap-out. For observing and analyzing the travel patterns, the latter system is arguably more convenient since it contains information about the user's exact destination station and exit times, and therefore doesn't require inference as pre-step for downstream analysis. MTR's sys-tem is tap-in and tap-out, with most interchange stations, barring a few, connected internally and don't require tapping out from one station to tap in at the next sta-tion during transfers in the journey. While this provides convenience to its users, it doesn't provide information about the exact route chosen by passengers in cases where multiple routes exist between the origin and destination stations. It should be noted that, smart card data alone lacks information on trip purpose, and other personal attributed of the card user. Such information could be requested from the user on a voluntary basis, and could help to enrich the analysis (Utsunomiya et al., 2006). The rest of this chapter is arranged as follows: section 2.1 discusses customer segmentation and its application in public transit, section 2.2 discusses information provision, and finally section 2.3 discusses past research in customer attrition. Finally, section 2.4 summarizes the key take aways from the literature reviewed, as relevant for this study.
2.1
Customer segmentation
Smith, who introduced the concept of market segmentation, stated "Market segmen-tation involves viewing a heterogeneous market as a number of smaller homogeneous markets, in response to differing preferences, attributable to desires of consumers for more precise satisfaction of their wants". Such partitioning of a market can help in understanding the specialized needs of each homogeneous sub group, so that their needs are catered to specifically (Wedel and Kamakura, 2013). With this definition, we now explore previous attempts at understanding travel behavior of transit users and transit market segmentation in the subsequent subsection.
2.1.1
Market segmentation in public transit
Public transit agencies usually have a set of differentiated fares for certain age groups and socioeconomic classes. For instance, the MTR has special concessionary cards for students, senior citizens, etc. Similarly, by choosing to purchase a fare pass, cus-tomers self-select themselves into categories of users who perceive their transit needs to be in line with the benefits offered by that particular fare pass. While such spe-cialized classes help in dividing transit users into broad categories, the users within these categories do not necessarily have a homogeneous spatial and temporal travel pattern. This is understandable since the goals of such classification may not be to identify users with similar mobility needs, although it is possible that the different card categories display some differences, for instance, Nishiuchi et al. (2013) analyzed variations in passenger's travel patterns (spatial and temporal variability) using a month's smart card data collected from Kochi City, Japan (bus and tram network), and their analysis revealed that different journey behavior was observed for different card categories. Similar rule based segmentation could also be useful for analysis, for instance, in looking at the variability of passenger's perception of transit per-formance, Tyrinopoulos and Antoniou (2008) considered segmenting the population between male and female respondents and found that it provided greater insight in the analysis. A study by Morency et al. (2006), proposed measures that describe the
variability of travel behavior of transit users and used k-means to identify days that were similar in terms of boarding times. It was concluded that smart card data had the ability to reveal regularity aspects of travel behavior. Therefore, such segmenta-tion could potentially be useful for other types of analysis.
Traditionally, transit users have been be divided into two broad segments-captive users and choice users. Krizek and El-Geneidy (2007) emphasized that the broad divi-sion into captive and choice users was inadequate since it did not consider non-transit riders, and therefore the study used data from two surveys-one for current users, and one for non-users. Principal component factor analysis was utilized to understand how the questions in the survey were related to each other, and k-means cluster anal-ysis was conducted using factor analanal-ysis as the basis ("reduced-form data"), and this revealed that there existed eight types of commuters who possessed varying prefer-ences. It suggested that users of the system could be divided into regular and irregular users, and further, transit users could be divided into captive and choice riders, while transit non-users could be divided into auto captives and potential riders. Therefore, in this study, regularity of commuting habits was considered along with mode captiv-ity to gain a deeper insight into the transit market. Jacques et al. (2013) were critical of the prevailing approach citing the ambiguity associated with the terms "captive" and "choice", and that their conflicting interpretations could lead to negative policy implications. Moreover, they highlighted the fact that such classification focused on availability of choice rather than the practicality or enjoyability of certain modes over others. A large scale survey was conducted to uncover market segments that were applicable to four modes of transportation, which included active modes apart from private auto and public transit. A two-step cluster analysis, using k-means, was per-formed for each mode, given that there were both continuous and categorical variables, and 21 mode-based clusters were obtained, which were finally combined to form four market segments-true captivity, dedication, utilitarianism and convenience, which was presented as an alternative approach to transport market segmentation. Shiftan et al. (2008) used Utah Transit Authority's (UTA) household survey and a method-ology based on structured equation modeling (SEM) for identifying potential transit
markets based on traveler attitudes. Eight segments of customers were obtained, and the factors used were sensitivity of time, need for fixed schedule and willingness to use transit. van Lierop and El-Geneidy (2017) attempted to find market segments across two Canadian transit providers, by aiming to consider the needs and desires of customers. By utilizing five years of customer survey data, nine market segments were obtained across different modes. Principal component factor analysis was uti-lized to understand how the survey questions were interrelated, and was used as a method to group questions that explained the variability in the data, and questions which had insignificant factor loadings were dropped, thereby reducing the number of variables considered for the cluster analysis. K-means was adopted for clustering which revealed the different segments within each modal category. They found three main categories as captive, choice and captive-by-choice users.
Kieu et al. (2015) considered the problem of transit customer segmentation by using transit smart card data for public transport users in Queensland, Australia. They identified segments using a priori market segmentation approach, and divided users into four clusters based on temporal and spatial regularity and used the Density-Based Spatial Clustering of Applications with Noise (DBSCAN) algorithm to mine travel regularity of each user. The four segments of passengers defined in this study were-regular OD passengers, habitual time passengers, transit commuters and irreg-ular passengers. It was found that a majority of the smart card users were irregirreg-ular users-those who did not follow any travel pattern, since these users rarely travel using public transit. Ma et al. (2013) used smart card data for data mining and un-derstanding travel patterns of transit users in Beijing, China. The transit riders' trip chains were constructed followed by employing DBSCAN for detecting transit rider's historical travel patterns. Following this, clustering and rough set theory was used to classify travel pattern regularity. Li et al. (2008) devised a hierarchical graph-based similarity measurement framework, that ingested GPS log data input to model each individual's location history, which was then utilized for measuring similarity among users. The results were validated through the survey volunteers to rate other users in terms of similarity (based on their own understanding). Tao et al. (2014) used
smart card data in Brisbane, Australia, to examine the spatial-temporal dynamics of urban PT passenger travel behavior, by extracting bus service patterns, reconstruct-ing travel trajectories and creatreconstruct-ing bus passenger flow comaps. These flow comaps were found to be effective in revealing the major travel pathways of passengers, and could be utilized to observe the spatial shift in their travel patterns. Ma et al. (2017) aimed to identify transit commuting patterns by using transit smart card data. With a month's smart card data, the spatio-temporal regularity was measured The results of the study were validated through a survey deployed on social media, and suggested that the proposed framework could reduce the necessity of longitudinal surveys and travel diaries.
Finding the ideal variables or features which could help describe the spatial and tem-poral characteristics of the user's travel pattern is an essential step towards finding segments of users. Morency et al. (2007) discussed measures of spatial and temporal variability of transit use. The indicators of spatial variability included enumeration of bus stops used for boarding and the frequency of use of bus stops. The indicators of temporal variability included using data mining techniques to identify typical board-ing patterns and the proportion of zero-boardboard-ing days. Ortega-Tong (2013) classified London's public transport users using smart card data, and the features used to de-scribe travel pattern were broadly grouped into those describing temporal variability, spatial variability, activity pattern variability, sociodemographic characteristics and public transport mode choice. Halvorsen (2015) used MTR's smart card data to clas-sify users and created features that described the spatial, temporal and frequency characteristics of users. Goulet-Langlois et al. (2016) did not aggregate variables, and instead created a longitudinal representation of user's activity sequence. Ghaemi et al. (2017) tried to uncover temporal behavior of users in their monthly trips, and used smart card data from Gatineau, Canada for their analysis. They proposed a vi-sual method for analysis of temporal user behavior, which involved reducing the high dimensional data into a lower space (semi-circle projection), and then utilized the ag-glomerative hierarchical clustering algorithm. The lower dimensional space provided the benefit of being interpretable.
A limitation of utilizing only one source of data-smart card data-is that the user's activities outside the public transit system are largely unknown. In the present study, since only data pertaining to MTR's subway system was available, user's travel on other modes such as buses remained unknown. We postulate that if other sources of data were available at the time of this research, better insight into user's travel patterns could be revealed. To support the above claim, consider research by Kusak-abe and Asakura (2014), who proposed the fusion of person trip survey data with smart card data, which helped in estimating behavioral attribute of trips utilizing smart card data. Validation showed that the trip purpose of a majority of trips were correctly identified using the methodology proposed. The analysis also revealed the relationship between trip purpose and trip frequency, which helped to show how trip purposes affected the total number of trips. Moreover, the authors claimed that their methodology could be used for the estimation of actual origins and destinations, and that the proposed method could be used for continuous monitoring thereby allowing the agency to assume the cause of behavioral changes, especially due to changes in policy/fare revisions, etc.
2.2
Information provision
Apart from advantages in fleet management, the availability of real-time data has led to another major change in public transit, which is the development of real-time transit information systems. The investments in these systems are motivated by the expectation that it would improve passenger's experience thereby leading to an in-crease in usage of public transit. Zhang et al. (2008) explored the impact of real-time information on the behavior and psychology of travelers by utilizing a panel survey data. It was found that real-time information was associated with a feeling of safety and an overall level of satisfaction. In a study by Brakewood et al. (2014), the impact of real-time information on bus riders in Tampa, Florida was explored. They found that among the advantages that real-time information provided-it led to significant decrease in level of anxiety and depression, and increase in level of productivity and
safety during daytime. Tang and Thakuriah (2011) found that there was a reciprocal relationship between attitudes and behavioral intentions, and therefore that attitudes may be altered after users experience real-time information provision systems.
Initial mechanisms for providing real-time information to transit users consisted of bus stop displays. Although the potential of information provision systems may be limited, nevertheless, it could lead to a better transit experience. Dziekan and Kot-tenhoff (2007), looked at the impact of at stop real-time information systems, and devised a framework to evaluate the effects of such information systems. Following this, two evaluation studies were discussed, with one showing that real-time informa-tion led to a drop in perceived wait times, and that passengers were found to adjust their walk speed based upon the information presented on the display. Grotenhuis et al. (2007) found that in case of integrated multi modal travel information in public transport, there was a distinction in the desired type of information at each stage of travel. In the pre-trip stage, the desired information pertained to the planning part of journey using public transit, wayside IMTI was desired when it helped the passenger to catch the correct vehicle and on-board travelers were concerned about their connections. Chow et al. (2014) looked at the impact of real-time passenger information signs in rail stations at the MBTA, and found that people reduced their overestimation of wait times by 50%, and that there were minor increases in ridership at stations with real-time information (after controlling for other variables).
By moving on to smartphones for providing this information, apart from the benefits associated with ease of access of information, the agency benefits from the cost savings associated with on-stop signage, however on the flip side this decision may alienate users who do not possess a smartphone, or other devices that are capable of providing adequate interface to receive this information. However, in the context of Hong Kong, most subway stations already have such signage, and around 74% of the population already have access to smartphones, a percentage that is expected to be close to 80%
in the next four to six years 1 Therefore, it is reasonable to expect the agency to shift
'Statista. (n.d.). Smartphone penetration rate as share of the population in Hong Kong
from 2015 to 2022*. In Statista - The Statistics Portal. Retrieved May 2, 2018, from
and concentrate its efforts on ensuring that the smartphone application is effective and caters to their customer's needs. Watkins et al. (2011) stated that one way to alleviate the reliability concerns associated with public transit (from the user's per-spective) was to provide real-time information to users. They developed a real-time information provision platform called OneBusAway in King's country metro. This platform could be accessed via website, telephone, text-messaging and smartphone applications. A survey was conducted by the researchers, and the analysis revealed that the availability of real-time information decreased the perceived wait time by about 13%. Moreover, it was also found that real-time information also help reduce the actual wait time. Therefore, a major advantage of mobile real-time information is that it is available to passengers before they reach the stop. In Gooze et al. (2013), the authors investigated the impact of data accuracy in the real-time transit infor-mation provision system OneBusAway on rider experience. They conducted a survey, similar to their previous survey three years earlier, but which now included questions to understand the user's accuracy expectations and their error reporting experience. The median error tolerance was found to be 4 to 6 minutes, however it was found that different population segments displayed varying expectations of prediction accuracy. It was found that there was a strong relationship between ridership frequency and accuracy expectations. In comparison to the previous survey, it was found that a greater number of users reported taking more public transit trips due to the real-time information available to them, and more users relied on the application as their main source of schedule and route information.
Tang and Thakuriah (2012) tried to quantify the ridership effect of the CTA Bus Tracker, which is a real-time bus information system, after controlling for other vari-ables by using repeated observation data (longitudinal). They found that the Bus Tracker service did lead to an increase in bus ridership. Further analysis also showed that there were temporal variations in ridership gains among routes. Therefore, this was an attempt to provide empirical evidence of the ridership gains associated with the availability of real-time information. Carrel et al. (2013) surveyed users of San Francisco's public transit users, and one of the results of their study was that issues
with real-time information system did not appear to force transit riders to leave, unless these issues occurred more frequently than other service problems and hypoth-esized that this could be due to the fact that the real-time information system was branded by the system manufacturer as opposed to the transit agency, or it may be due to users becoming accustomed to such errors. Brakewood et al. (2015) looked at the impact of real-time information on bus ridership in New York City. The study claimed that New York City had the advantage of simultaneous launch of real-time information on multiple interfaces, high levels of technology adoption and a market-ing campaign to increase awareness about the real-time information system. Results showed that the longest routes experienced a significant increase in ridership. The topic of providing personalized transport information has been looked into before in Lathia et al. (2013), where the authors used fare card data in London, to first iden-tify travel behavior heterogeneity among users, and then computed personalized trip time estimates. Personalization in other domains is widespread such as e-commerce (Linden et al., 2003) and news (Das et al., 2007), and therefore it is reasonable to expect that personalization would impact the way information is provided to public transit users in the future.
2.3
Customer attrition
While most profit-driven private companies focus heavily on customer attrition/churn analysis, such discussion in the domain of public transit is relatively rare. Webb (2010) looked at customer loyalty in the public transportation context. This study used data from CTA's 2008 customer experience survey, which consisted of a mix of choice and captive riders among survey respondents with varying accessibility, and covered as-pects of customer satisfaction and loyalty in its questionnaire. Factor analysis and structured equation modeling (SEM) were utilized to understand the relationships between customer loyalty and its drivers. A major finding in this study, was that loyalty forms differently among different customer groups and that it was necessary to cater to these groups individually to improve their experience in order to increase
their loyalty.
We recognize that attracting and retaining customers are part of the positive cycle that leads to increase in transit ridership, with each component being equally impor-tant. While agencies focus more on attracting new customers (Webb, 2010), retaining customers should not be neglected. Through customer segmentation, the broad char-acteristics of these segments can be identified, and analyzing customer who are leaving the system could help in retaining customers and increasing loyalty, which could in turn have positive spillover effects, both in terms of increasing ridership further (word of mouth advertising) as well as curbing externalities (pollution, congestion, etc.) as-sociated with the use of modes such as private auto. High rate of (avoidable) attrition might also tarnish the image of the service, effectively preventing other users from using it. Although a discussion of causal factors that lead to attrition may be beyond the scope of the present research, given the study's reliance solely on smart card data, it may be useful to study whether a predictive model could be built such that it could identify users (or smart cards) who may leave the system (or drastically reduce their usage) in the near future.
Therefore, in this regard, lessons from other industries provide an interesting insight into creating predictive models for customer attrition or churn. Unlike the problem of identifying customer segments, the problem of churn prediction falls in the category of supervised machine learning since by using past dataset for training the model, customers could be labeled as churners and non-churners based on their present us-age. Au (2013) highlighted the potential of methods such as tree-based methods and neural network based methods (multilayer perceptron) and Bin et al. (2007) adopted decision tree for prediction of churn. Hung et al. (2006) looked at the application of data mining techniques to telecom churn management. It was found that both a de-cision tree and neural network techniques could perform well and accurately predict churn. The data utilized for building the model included customer demographics, billing information, call detail records, contract/service status and service change log. Segmentation was incorporated as well into the churn prediction, but it was noted that since the churn rate was extremely small, the data size was insufficient (since
there were very few churners in some segments). Lemmens and Croux (2006) used bagging and boosting classification trees to predict churn for a telecom firm. It was noted that bagging and boosting provided substantially better performance than bi-nary logit model. It was also noted that the model could be trained with a "balanced" sample and then the classifier could be corrected for the balanced sampling scheme. Xie et al. (2009) looked at customer churn prediction using improved balanced
ran-dom forests (IBRF) in the banking industry. The proposed technique
(IBRF)
had theadvantage of penalizing more heavily the misclassification of the minority class, while iteratively learning the best features. The experimental results showed its superiority over random forest algorithms.
A common issue related to churn is the imbalance in the dataset, since the num-ber of customers who leave the system is often a small fraction of the total (churn is a rare event). This may cause common predictive techniques to have a subopti-mal performance. One technique in literature that looks at tackling such imbalanced datasets is Synthetic Minority Over-sampling Technique (SMOTE) which shows that a combination of over-sampling the minority class and under-sampling the majority class can lead to better classifier performance in the ROC space, than simply under-sampling the majority class (Chawla et al., 2002). Burez and Van den Poel (2009) discussed handling class imbalance in customer churn prediction. They evaluated the efficacy of advanced sampling techniques such as CUBE, and concluded that it did not increase the predictive performance, and that this finding was in line with similar work done elsewhere. They also concluded that weighted random forests may work well and that it should be compared to logistic regression. It was also found that undersampling worked well, but undersampling such that there were as many churn-ers as non-churnchurn-ers in the training set was not necessary. Moreover, AUC and lift were found to be good evaluation metrics. It also noted that boosting was a robust classifier but never outperformed any other technique.
Based on the above studies, we may infer that information on the user is required to truly predict customer attrition. Although a causal analysis of attrition may not be feasible by solely using transit smart cards without information on the actual user, it
may be possible to predict card attrition. The agency could then try to identify and target these users specifically and try to understand the circumstances underlying attrition, and whether it is avoidable or not. If it is the former, then the agency could strive to obtain better feedback on where it needs to improve and if possible, try to convince the customer that requisite action would be taken swiftly. While direct com-munication between the transit customer and transit rider has been far-fetched in the past (cost and labor considerations), with improved communication interfaces with the customer (as discussed earlier in the chapter) may make two-way communication a possibility. Webb (2010) also pointed towards the necessity of conducting surveys regularly and consistently in order to obtain time series data which could allow for comparison between the customer's intent to reuse the service versus their actual us-age. While it was recognized that asking customers for their smart card information was necessary for the above step (to match with survey results), it should be pointed out that findings from the previous section on information provision also hint towards the fact that such a step would be beneficial.
2.4
Lessons learnt
In their study, Lai and Chen (2011) explored the behavioral intentions of public transit passengers by utilizing passenger survey data from KMRT, Taiwan. This was deemed necessary since customer loyalty is necessary for long-term financial performance. It was found that passenger loyalty relied on passenger satisfaction, and that while better quality transit services were essential, increased passenger involvement was also significantly important. It was suggested that a more market-oriented approach than a traditional supply oriented approach was necessary, for instance by utilizing advertisements as a pull strategy, customer's perception of the value offered by transit could be improved, which could lead to better satisfaction. In their study, Kieu et al. (2015) concluded that understanding each passenger type was vital towards transit strategic planning, and that before the transit agency considers attracting new customers, they should first focus on existing customers and encourage them to
adopt public transit as their primary mode. Moreover, it emphasized that transit agencies could 'pay special interest' to irregular users who were regular users before, and try to understand the underlying reasons for such shift in travel behavior. It was also stated that the passenger segmentation methodology has helped transit operators to 'well-suited' specific information and services.
From the literature surveyed, it was concluded that:
" Understanding the customer's specific needs is essential, and segmentation is one way to distinguish among customers with varying needs.
" Better understanding could help in providing targeted services to these users which could improve customer loyalty and satisfaction.
* Providing information to these users is one demand side strategy which could be a low cost alternative to ensure a better customer satisfaction.
" By ensuring higher satisfaction, through the above, the agency could ensure that they do not leave the PT system
With this understanding, we present a novel framework for customer segmentation in Chapter 3 and interpret these segments (Chapter 4). A discussion of various
Chapter 3
Methodology
3.1
Introduction
To ensure a better experience and to meet customer's needs, a transit agency needs to strive to understand its customers. Traditional tools such as surveys have been used in the past to quantitatively and qualitatively capture a transit customer's needs. The data-driven customer segmentation methodology being presented in this study provides a low-cost alternative, albeit with some limitations, to traditional tools for understanding the transit customer which often involve manual surveys. Since it re-lies solely on transit smart-card data for creation of segments, the cost of collecting this data is minimal. Another major advantage of utilizing smart-card data is that it captures the longitudinal aspect of a user's travel pattern, and these insights could help in identifying shifts in behavior. Moreover, in this study, the process of dis-covering segments from automated data sources such as smart cards may itself be automated, whereby the segmentation mechanism can ingest new data to generate results which may be interpreted based on the specific features chosen for clustering. The segmentation being presented in this study aims to facilitate various applications which are described in the following subsection.
3.1.1 Characteristics of applications
The customer segmentation presented in this study aims to capture a user's spatial and temporal travel pattern so that the agency could then provide targeted services based on their specific characteristics (and inferred needs). This study attempts to create a segmentation scheme that could be utilized across several applications. Some specific applications discussed in this study include personalized information provision, before-and-after analysis and predicting card attrition. Although these are some of the applications that would be demonstrated, we believe there are several other applications which could also benefit from the segmentation scheme presented in this study, and these applications are shown in Figure 3-1.
For the segmentation scheme to serve such diverse applications, the structure should
Advertisin Prnedtation
Figure 3-1: Applications supported by the segmentation scheme
be able to capture the details of each user's specific spatial and temporal travel characteristics. In this study, we only utilized smart card data for user's trips made
using MTR's service, and no other data source apart from this was used. While a lot of past studies have either looked at extremely disaggregate level or have resorted to
type of structure could benefit multiple applications which could have varying levels of data requirements, and hence the applications driven by this framework could serve users of both types: those who have travel infrequently on the service, and frequent users of the service.
3.1.2
Description of overall approach
We develop a customer segmentation scheme that could provide the transit agency an in-depth knowledge of its customers. While creating this, the aim is to:
" Identify customer segments that are representative of typical users who use MTR's service, based on similar spatial and temporal characteristics, which in turn are captured through features defined in this study.
" The customer segments obtained should be interpretable with the help of fea-tures used to define these, and should be distinguishable based on the feafea-tures used to create these.
" The features used for creating these segments should be interpretable themselves and should offer value to be used on their own, or in conjunction with the segments, in meaningful applications.
" The customer segments should be able to facilitate multiple downstream appli-cations as defined in the scope of this research.
" The segments obtained should be stable over a period of time for comparisons to be drawn across time periods. Hence, while individual customers might shift across segments, the segments themselves should not disappear.
After the framework is developed, it would be used for:
e Understanding the customer better by utilizing the insights gained from the segments they belong to.
* Used as a building block for the provision of targeted information with the explicit aim to increase the relevance of the information and the implicit aim to improve customer's experience.
" Understanding, quantitatively, how incidents might impact different customer groups.
* Observing shifts in customer segments, especially in the event of an extrinsic or intrinsic change.
" Trying to predict smart card attrition.
With the above specification, we now describe the structure of segmentation adopted in this study in the following subsection.
3.1.3
Structure of segmentation
Based on the characteristics of the segmentation considered, a two-tiered segmenta-tion scheme was created in this study. The idea was to capture a given user's general travel attributes such as the stations and times of their trips in the first tier, and
to summarize detailed characteristics of their trips-such as the distance they travel on average, and the number of unique locations they visit, etc.-in the second tier. Therefore the overall segmentation structure could be divided into two broad parts: short-term segments (tier 1) and long-term segments (tier 2). All users who travel in a certain month may be assigned a short-term segment, although to avoid issues aris-ing due to window effects, only users who have traveled at least once in the previous month are assigned a short-term segment. Long-term segments are assigned only to ('long-term') users who have traveled for a long period of time (over a year) and are frequent users of the service (use MTR's service on at least half of the weekdays in a month). In this study, we focus only on weekday travel pattern, and claim that a similar methodology would be applicable for the analysis of weekend travel patterns. The eligibility of allocation of segments to users based on their service usage has been shown in Figure 3-2.
All customers
Short-term segments
Long-term segments
All users, of select card types, who travel at least once in monthi Users who have traveled at least once in month i-I
Users who have traveled on at least half the weekdays in each month in the past year
Figure 3-2: Customers who are assigned each type of segment
The rationale for the two-tiered structure is that while the agency might possess lim-ited travel data on infrequent users, nevertheless these users could be characterized based on the the locations and the times when they travel (general characteristics). However, when it comes to looking at their detailed characteristics, there might not be enough data on these users to conclusively determine these characteristics (sta-bility problems). Therefore, by splitting the segmentation structure into two tiers, we ensure that each user, regardless of their usage, is assigned a customer segment which is sufficient for at least a few applications. To expand on this further, consider the provision of automated information updates to users in the event of a disruption in service. For this, the general characteristics of the user's travel pattern may be sufficient to determine if they might be potential beneficiaries of this information. Whereas, for determining if a customer is going to leave the system, more informa-tion, in the form of detailed characteristics of their trips might be necessary.
Note: Henceforth, the terms Group and Segment would be used interchangeably to
refer to clusters obtained in this study. The cluster name assigned to a certain cluster may also be used to refer to the same.
3.2
Short-term segments
As mentioned previously, the purpose of short-term segmentation is to study the