HAL Id: hal-00301374
https://hal.archives-ouvertes.fr/hal-00301374
Submitted on 14 Nov 2003HAL is a multi-disciplinary open access
archive for the deposit and dissemination of sci-entific research documents, whether they are pub-lished or not. The documents may come from teaching and research institutions in France or abroad, or from public or private research centers.
L’archive ouverte pluridisciplinaire HAL, est destinée au dépôt et à la diffusion de documents scientifiques de niveau recherche, publiés ou non, émanant des établissements d’enseignement et de recherche français ou étrangers, des laboratoires publics ou privés.
Problems regarding the tropospheric O3 residual
method and its interpretation in Fishman et al. (2003)
A. D. J. de Laat, I. Aben
To cite this version:
A. D. J. de Laat, I. Aben. Problems regarding the tropospheric O3 residual method and its interpreta-tion in Fishman et al. (2003). Atmospheric Chemistry and Physics Discussions, European Geosciences Union, 2003, 3 (6), pp.5777-5802. �hal-00301374�
ACPD
3, 5777–5802, 2003 Problems regarding the tropospheric O3 residual method A. T. J. de Laat and I. Aben Title Page Abstract Introduction Conclusions References Tables Figures J I J I Back CloseFull Screen / Esc
Print Version Interactive Discussion
© EGU 2003
Atmos. Chem. Phys. Discuss., 3, 5777–5802, 2003 www.atmos-chem-phys.org/acpd/3/5777/
© European Geosciences Union 2003
Atmospheric Chemistry and Physics Discussions
Problems regarding the tropospheric O
3
residual method and its interpretation in
Fishman et al. (2003)
A. T. J. de Laat and I. Aben
National Institute for Space Research (SRON) Utrecht, The Netherlands Received: 15 September 2003 – Accepted: 11 November 2003 – Published: 14 November 2003
ACPD
3, 5777–5802, 2003 Problems regarding the tropospheric O3 residual method A. T. J. de Laat and I. Aben Title Page Abstract Introduction Conclusions References Tables Figures J I J I Back CloseFull Screen / Esc
Print Version Interactive Discussion
© EGU 2003 Abstract
In this article we will show that the Total Ozone Residuals (TOR) method as presented by Fishman et al. (2003) contains an erroneous assumption, due to which the TOR as presented in this article reflects mainly a tropospheric O3 climatology (Logan, 1999), scaled to the layer between the surface and the tropopause height, rather than a satel-5
lite measured TOR. We will show that it is possible to obtain a tropospheric O3column that is very similar to what is being presented in Fishman et al. (2003), solely based on the Logan (1999) tropospheric O3 climatology and an estimate for the tropopause heights without using satellite data. Furthermore, we will show that one of the inter-pretations of observed O3variability (high TOR values over Southeast Asia) is not the 10
result of pollution, but primarily of tropopause height variations. We suggest adjusting the method in such a way that the final retrieved TOR product becomes independent of the actual values of the Logan (1999) O3 climatology. The proposed adjustments are also more in line with the original methodology suggested by Fishman and Balok (1999) in a previous paper. We furthermore show that the assumption that the strato-15
spheric O3column is nearly constant within a 5-day period is not always valid. This can introduce errors in the final TOR product, although we recognize that these errors may become small when averaging the TOR product over longer periods of time. However, we feel that a detailed study on this assumption is also needed.
1. Introduction 20
Over the last decade or so several methods have been developed to estimate the tro-pospheric O3content from satellite observations (for example Hudson and Thompson, 1996; Kim et al., 1996; Ziemke et al., 1998; Fishman and Balok, 1999; Newchurch et al., 2003; Fishman et al., 2003). Observing tropospheric O3 from space is di ffi-cult, because the largest part of the total ozone column is found in the stratosphere, 25
ACPD
3, 5777–5802, 2003 Problems regarding the tropospheric O3 residual method A. T. J. de Laat and I. Aben Title Page Abstract Introduction Conclusions References Tables Figures J I J I Back CloseFull Screen / Esc
Print Version Interactive Discussion
© EGU 2003
the O3 that (backscattered) sunlight has encountered along its path through the at-mosphere is located in the stratosphere. As a result, most of the O3 information in the backscattered sunlight is stratospheric, not tropospheric, and any retrieval from the backscattered sunlight has a reduced sensitivity to the troposphere (Hasekamp and Landgraf, 2002). In addition, clouds often obscure the observation of tropospheric O3 5
at ultra-violet and visible wavelengths. One commonly applied method is to use one instrument which measures total O3columns and another instrument which measures stratospheric O3 profiles. Subtracting the stratospheric part from the total O3 column yields (at least in principle) a residual which is the tropospheric part This is also the methodology followed by Fishman et al. (2003).
10
In this article we focus on two aspects of the retrieval of Total O3 Residuals (TOR, also known as Total Tropospheric O3 Columns or TTOC) as recently presented by Fishman et al. (2003). In Sect. 2 we show that the method applied to derive TOR columns should be interpreted as the monthly Logan (1999) climatology with daily varying tropopause heights, with the differences between the daily TOMS total O3 col-15
umn and the once-per-5-days SBUV total O3 column superimposed on it. In Sect. 3 we show that we can derive similar results as found in Fishman et al. (2003) using the Logan (1999) climatology and the tropopause height variations without making any use of satellite data. In Sect. 4 we also show that the interpretation of what is claimed in Fishman et al. (2003) as pollution observed over northern India and China during 20
northern hemisphere summer is in fact predominantly the tropopause height variation between summer and winter. In Sect. 5 we suggest a slight adjustment that makes the TOR column dependent on the vertical distribution of O3in the Logan (1999) climatol-ogy rather than on the actual O3values of the climatology. The suggested adjustment is also more in line with a previous publication on this topic (Fishman and Balok, 2003). 25
In Sect. 6 we investigate the assumption in the Fishman et al. (2003) method that the stratospheric O3column is nearly constant for a given 5-day period. We show that the stratospheric O3variability for a 5-day period is too large to be ignored. We end with a summary, discussion and recommendation section (Sect. 7).
ACPD
3, 5777–5802, 2003 Problems regarding the tropospheric O3 residual method A. T. J. de Laat and I. Aben Title Page Abstract Introduction Conclusions References Tables Figures J I J I Back CloseFull Screen / Esc
Print Version Interactive Discussion
© EGU 2003 2. Calculation of TOR
The method described in Fishman et al. (2003) uses Total Ozone Monitoring Satellite (TOMS, 2003) measurements of the total O3 column and Solar Backscattered Ultra-Violet instrument (SBUV, 2003) stratospheric O3 profile measurements (Bhartia et al., 1996). Basically, the method subtracts the stratospheric O3 column from the total O3 5
column. The tropopause height for determining the separation between stratosphere and troposphere is obtained from NCEP 6-hourly gridded (2.5◦×2.5◦) climate model analysis. One of the problems of this method is that an SBUV vertical O3 profile mea-surement for a particular site is available only once every 5 days. TOMS total O3 columns are available globally on a daily basis. In the Fishman et al. (2003) method it 10
is therefore assumed that the total stratospheric O3 column amount does not change over a 5 day period. In Sect. 6 we will discuss this assumption further.
The SBUV O3 profile consists of 12 subcolumns between 0.3–1013 hPa. Sub-columns that could be (partly) tropospheric are layers 1 (1013–253 hPa, 0–10 km), layer 2 (253–127 hPa 10–14.5 km) and layer 3 (127–63.3 hPa 14.5–19 km)). The accu-15
racy of the TOR product depends very much on the error and accuracy of the SBUV profile. According to Bhartia et al. (1996), the SBUV O3 profile is independent from the a priori information between 1–20 hPa (30–50 km). Outside of this region only the total column amounts (1–0.3 hPa and 20–1013 hPa) can be considered to be rel-atively free of a priori assumptions. Bhartia et al. (1996) concluded that the SBUV 20
retrieval algorithm placed enhanced amounts of tropospheric ozone into the lower tro-posphere. Validation showed that only the SBUV total column between the surface and 20–30 hPa were in agreement with non-SBUV observed columns (Bhartia et al., 1996; Ziemke et al., 1998). Validation of the SBUV tropospheric O3 column layers showed that the tropospheric sub-columns do not agree with observations from radiosonde pro-25
files (Fishman and Balok, 1999). The O3 column in layer 1 is too low; the O3 column in layer 3 is too high while the O3 column in layer 2 is comparable to the observed radiosonde O3 column. Moreover, Fishman and Balok (1999) claim that the total
in-ACPD
3, 5777–5802, 2003 Problems regarding the tropospheric O3 residual method A. T. J. de Laat and I. Aben Title Page Abstract Introduction Conclusions References Tables Figures J I J I Back CloseFull Screen / Esc
Print Version Interactive Discussion
© EGU 2003
tegrated monthly mean O3 column over the 1012–63.3 hPa layer is in agreement with the observed columns. Note that this upper boundary of 63.3 hPa is different from the 20–30 hPa as mentioned in Bhartia et al. (1996) and Ziemke et al. (1998). Fishman et al. (1999, 2003) therefore suggests that the “tropospheric” SBUV O3 profile should be corrected using the Logan (1999) climatology. The assumption is that, although the 5
Logan (1999) climatology may not provide the correct O3concentrations and columns at a given location, the vertical distribution in both space and time are represented rea-sonably well by the climatology. The climatology can then be used to redistribute the O3 column values in the lowest three SBUV layers while keeping the total SBUV O3 amount of the lowest three layers fixed.
10
The correction as defined and formulated in Fishman et al. (2003) is as follows (see Fig. 6 in Fishman et al. (2003) and according to ACPD interactive comment 3-S386). The retrieval method starts by obtaining the lowest part of twelve SBUV O3 subcolumns:
Layer 1 : Column A (1000−253 hPa) 15
Layer 2 : Column B (253−126 hPa) (1)
Layer 3 : Column C (126−63 hPa).
Next, the Logan (1999) tropospheric O3 climatology is partitioned into sub-columns that correspond closely to the SBUV sub-layers between 1000 and 100 hPa (the Logan (1999) climatology provides data up to 100 hPa):
20
Column X (1000−250 hPa)
Column Y (250−125 hPa) (2)
Column Z (125−100 hPa).
Additional information is needed to extend the Logan (1999) climatology up to 63.3 hPa so that it matches with the lowest three SBUV layers (layers A, B, C in Eq. 1).
ACPD
3, 5777–5802, 2003 Problems regarding the tropospheric O3 residual method A. T. J. de Laat and I. Aben Title Page Abstract Introduction Conclusions References Tables Figures J I J I Back CloseFull Screen / Esc
Print Version Interactive Discussion
© EGU 2003
Fishman et al. (2003) assume that the sum of the O3 in the three layers from the SBUV measurement is correct (in accordance with the findings of Fishman and Balok, 1999). The approach then followed is that the difference between the SBUV columns (A+B+C) and Logan columns (X+Y+Z) is added to the Logan (1999) climatology to represent the “missing” climatology between 100-63 hPa. The “new” column Z∗(125– 5
63 hPa) is defined by Fishman et al. (2003) as:
Z∗=Z+∆Z=Z+(A+B+C)−(X+Y+Z)=(A+B+C)−(X+Y). (3)
Next, the ratio of climatological layers (X+Y+Z∗) to the sum of the lowest three SBUV layers (A+B+C) is calculated. This ratio is then used to scale the climatological total O3between 1000–63 hPa to the observed (SBUV) total O3for these layers. The coe ffi-10
cients R1, R2, R3represent the ratios of the three layers in the extended Logan (1999) climatology and are referred to as the correction ratios of layers 1, 2 and 3.
R1=X/(X+Y+Z∗)=X/(X+Y+(A+B+C)−(X+Y))=X/(A+B + C)
R2=Y/(X+Y+Z∗)=Y/(A+B+C) (4)
R3=Z∗/(X+Y+Z∗)=((A+B+C)−(X+Y))/(A+B+C). 15
The coefficients R1, R2and R3are then multiplied to provide the new layers A∗, B∗and C∗:
A∗=R1×(A+B+C)=X
B∗=R2×(A+B+C)=Y (5)
C∗=R3×(A+B+C)=(A+B+C)−(X+Y). 20
Note that as a result of putting the entire difference between the SBUV total column (A+B+C) and the Logan (1999) climatology (X+Y+Z) in the missing part of the clima-tology∆Z (=(A+B+C)-(X+Y+Z)), layers X and Y remain unchanged. Consequently,
ACPD
3, 5777–5802, 2003 Problems regarding the tropospheric O3 residual method A. T. J. de Laat and I. Aben Title Page Abstract Introduction Conclusions References Tables Figures J I J I Back CloseFull Screen / Esc
Print Version Interactive Discussion
© EGU 2003
the new layers A∗and B∗are equal to X and Y, respectively, which are the quantities in the original Logan (1999) climatology. The SBUV measured (A+B+C) sub-columns are thus not effectively redistributed according to the Logan (1999) climatology, which we believe is what the authors aimed for (in accordance with Fishman and Balok, 1999). The new quantities A∗, B∗ and C∗ are used to calculate the SBUV stratospheric O3 5
column (SBUVSOC):
SBUVSOC=SBUVTOC−cC∗−bB∗−A∗ (6)
in which the coefficients b and c denote the fractions of layers B∗ and C∗ that are located below the tropopause, obtained from NCEP reanalysis data. The tropospheric O3residual then becomes:
10
TOR=TOMSTOC−SBUVSOC=TOMSTOC−SBUVTOC+cC∗+bB∗+A∗. (7) If we now substitute Eq. (5) in Eq. (7) we get:
TOR=TOMSTOC−SBUVTOC+cC∗+bY+X. (8)
Equation (8) has some important consequences. First we assume that the tropopause is located below 125 hPa (which is almost always the case outside of the tropics), so 15
that coefficient c becomes zero:
TOR=TOMSTOC−SBUVTOC+bY+X. (9a)
Equation (9a) consists of two parts. The value bY+X is nothing more then the Logan (1999) climatology below the altitude at which the tropopause is located. Superim-posed on this climatology are the daily variations in total O3 (TOMS), assuming that 20
TOMS and SBUV measure the same total O3columns and because SBUV and TOMS measurements have different sampling times (once per five days/daily). If we assume that the differences in total O3 columns occur randomly (see Sect. 6), then the di ffer-ences in total O3columns due to the different sampling times would become negligible averaged over a longer period of time (i.e. if the number of samples is large enough). 25
ACPD
3, 5777–5802, 2003 Problems regarding the tropospheric O3 residual method A. T. J. de Laat and I. Aben Title Page Abstract Introduction Conclusions References Tables Figures J I J I Back CloseFull Screen / Esc
Print Version Interactive Discussion
© EGU 2003
As a result, seasonal averages (and probably also monthly averages) primarily reflect changes in the O3climatology and tropopause heights.
Alternatively, the tropopause can be located between 125 hPa (15 km) and 63 hPa (19 km). In that case coefficient b becomes one and if we substitute the expression for C∗ from Eq. (5) in Eq. (8), we get:
5
TOR=TOMSTOC−SBUVTOC+c(A+B+C)+(1−c)(X+Y). (9b)
Equation (10b) is a linear combination of the SBUV layers A, B and C, the Logan (1999) climatology below 125 hPa and the daily variations in total O3(TOMS). Note that SBUV column C includes a part of the stratosphere. The tropopause height in the tropics rarely exceeds 17 km (90 hPa), so that the value of (1–c) is never small. As a result, 10
also for this case (Eq. 9b) the TOR strongly reflects by the Logan (1999) climatology. We therefore strongly suspect that, without using any satellite measurements, we should be able to obtain results that in many cases strongly resemble the TOR columns as presented in Fishman et al. (2003), by simply using the Logan (1999) climatology and adding the amount of O3between 12 hPa and the tropopause height from a di ffer-15
ent source (such as a climate model).
3. Total O3residual from Logan (1999) and tropopause heights
According to Eqs. (9a) and (9b) the TOR columns in Fishman et al. (2003) are the combination of the Logan (1999) climatology below the tropopause, superimposed with the differences between daily TOMS total O3columns and once-per-5-days SBUV total 20
O3 columns. If differences between SBUV and TOMS total O3 columns for a 5-day period occur randomly, it is reasonable to assume that these differences are small when averaged over longer periods of time (see Sect. 6). Thus, the TOR product for seasonal averages mainly reflects the Logan (1999) climatology below the tropopause and only marginally reflects tropospheric O3 as measured by TOMS/SBUV. To further 25
ACPD
3, 5777–5802, 2003 Problems regarding the tropospheric O3 residual method A. T. J. de Laat and I. Aben Title Page Abstract Introduction Conclusions References Tables Figures J I J I Back CloseFull Screen / Esc
Print Version Interactive Discussion
© EGU 2003
the tropopause heights from an ECHAM model simulation on T63 (∼2◦×2◦resolution). O3concentrations above 100 hPa were assumed equal to the O3concentrations in the Logan (1999) climatology at 100 hPa. The 19-layer ECHAM model (Roeckner, 1996) simulation was done using the so-called “nudging” procedure (assimilating ECMWF analysis data) for the year 1996 (Jeuken et al., 1996). The ECHAM model has a 5
vertical coordinate system that follows the surface elevation. The 19-layer ECHAM model has typically a vertical resolution of about 1–2 km in the tropopause region. The tropopause height was defined as the height (vertical gridpoint) for which the vertical temperature gradient was −3◦K/km.
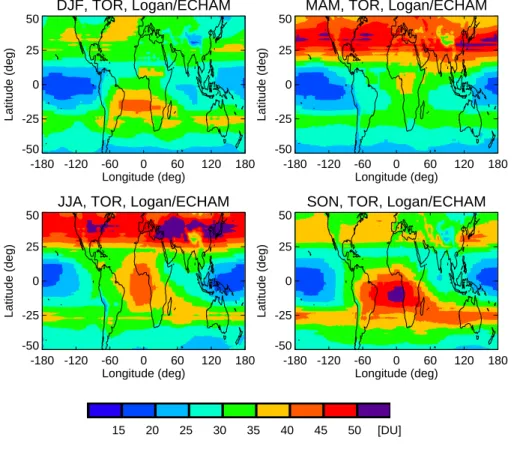
Fig. 1 shows the TOR columns from this methodology for the four seasons. The TOR 10
columns show very similar spatial and seasonal variations as the 1979–2000 climatol-ogy in Fishman et al. (2003). Differences could be explained by a number of factors: (1) we only used the tropopause height for one year (1996), (2) we used a different tropopause height definition, (3) we did not take into account the fraction of the SBUV column that is added for tropopause heights above 100 hPa as is applied in Fishman 15
et al. (2003), (4) the horizontal resolution of TOMS is about 1◦×1.25◦ compared to the 2◦×2◦resolution from the ECHAM model so that more surface elevation details should be visible in the Fishman et al. (2003) TOR than in our TOR and (5) no systematic differences between daily TOMS and once-per-5-days SBUV total O3 column mea-surements are included. However, it is not the scope of this paper to fully reproduce 20
the Fishman et al. (2003) climatology. We merely want to show that the Logan (1999) climatology with some tropopause height estimation results in a TOR column very sim-ilar to that in Fishman et al. (2003), as we predicted through inspection of Eqs. (9a) and (9b). Only very little new information about O3would be obtained by including the satel-lite measurements in Fishman’s TOR methodology. Fishman et al. (2003) claim that 25
there is a considerable amount of additional information from the satellite measure-ments in their TOR, and have substantiated this by comparing the TOR climatology for July with the Logan (1999) climatology total O3 columns below 250 hPa. However, because the TOR is very dependent on the tropopause height and surface elevation,
ACPD
3, 5777–5802, 2003 Problems regarding the tropospheric O3 residual method A. T. J. de Laat and I. Aben Title Page Abstract Introduction Conclusions References Tables Figures J I J I Back CloseFull Screen / Esc
Print Version Interactive Discussion
© EGU 2003
comparing the Logan (1999) climatology below 250 hPa (and without taking surface elevation into account) with TOR does not prove that the differences are caused by the satellite measurements. If one takes the surface elevation and tropopause heights into account, which is what we have done in this section, the resulting TOR are very similar to the TOR in Fishman et al. (2003).
5
4. Interpretation of Asian “summer pollution events”
According to Fishman et al. (2003) and Pierce et al. (2003) the TOR columns show enhanced values during June–August over southern and eastern Asia. Furthermore, enhanced TOR values are seen over the Ganges valley in northern India. It is claimed that this is widespread pollution caused by emissions over northern India. However, 10
when looking in detail at the 1979–2000 TOR climatology in Fishman et al. (2003), we see that this is a persistent feature throughout all seasons. Furthermore, this feature is also present in the “Logan/ECHAM tropopause” TOR in Figs. 1 and 2. There is no such a feature in the actual Logan (1999) O3surface concentrations, rather the O3 concen-trations increase along the latitude over India without any longitudinal variations. We 15
therefore conclude that this feature is not caused by pollution, but relates to other pro-cesses: a geographical effect and seasonal changes in the TOR values. As noted, the total O3column values in the Logan (1999) climatology increase with latitude over southern Asia, but without longitudinal variation. However, there is also a large surface elevation difference between northern India (close to sea level) and the Tibetan plateau 20
(approximately 3–5 km altitude). Therefore, combining the surface elevation changes with the northward increasing O3 concentrations results in TOR variations that follow local elevation changes. Separate from the influence of the surface elevation however is the question why the TOR column changes so much between the seasons. The O3 concentrations over southern Asia in the Logan (1999) climatology do not change 25
enough to explain the large differences between summer and winter TOR over India and China. However, large differences between summer and winter TOR are also
ACPD
3, 5777–5802, 2003 Problems regarding the tropospheric O3 residual method A. T. J. de Laat and I. Aben Title Page Abstract Introduction Conclusions References Tables Figures J I J I Back CloseFull Screen / Esc
Print Version Interactive Discussion
© EGU 2003
present in the “Logan/ECHAM tropopause” climatology (Figs. 1, 2). The explanation we find by looking at the differences in tropopause height between the winter and sum-mer season (Fig. 3). There is a large change in tropopause height as large as 5 km between winter and summer for this region. This explains the large difference between summer and winter TOR columns over southern Asia: during summer the tropospheric 5
O3 column is simply about one-third larger than during winter. Moreover, the highest O3concentrations are found close to the tropopause, so that a considerable amount of O3is added to the tropospheric O3column when the tropopause is higher.
We investigate how much O3would be needed to explain these TOR differences be-tween summer and winter (differences are 15–25 DU, both in the Fishman et al. (2003) 10
climatology as well as in the “Logan/ECHAM tropopause” TOR). We can convert Dob-son Units to mixing ratios as follows:
O3=FDU×g×Mair×(∆DU)/(0.1×dp×avo). (10)
In which FDU is the conversion factor from molecules/cm2 to Dobson Units (2.69·1016molecules/cm2), g is the gravity constant (9.81 m/s2), Mair is the molar mass 15
of air (28.64 gr/mol), ∆DU is the difference in O3 column thickness, d p is the layer thickness in Pa, av o is the Avogadro constant (6.02·1023mol−1) and 0.1 is a factor for the conversion from m2 to cm2 and kg to gr. If we assume that a 15 DU change occurs in the atmospheric boundary layer, and substitute a layer thickness of 150 hPa (1000–850 hPa which is roughly a thickness of 1.5 km) into Eq. (10), the difference in 20
O3concentrations is approximately 125 ppbv (mixing ratio of 1.25·10−7). If a typical O3 concentration during winter in northern India would be about 50 ppbv (Logan, 1999), then during summer it would be 175 ppbv, which is a very unrealistic O3concentration at the surface, even for strong pollution events. On the other hand, a layer of 150 hPa in the tropopause region is similar to a change from 10 to 15 km altitude, which is roughly 25
the tropopause height change from the ECHAM model for this region, and a concentra-tion of 125 ppbv for the tropopause region is very reasonable. The O3 enhancements during local summer over India and China are not related to pollution, but primarily the
ACPD
3, 5777–5802, 2003 Problems regarding the tropospheric O3 residual method A. T. J. de Laat and I. Aben Title Page Abstract Introduction Conclusions References Tables Figures J I J I Back CloseFull Screen / Esc
Print Version Interactive Discussion
© EGU 2003
result of changes in tropopause heights. A summertime maximum in surface O3 con-centrations is not in agreement with our current knowledge, which as also noted by Kim in the ACPD interactive comment 3-S470. Furthermore, this summertime maximum is also not present in the Logan (1999) climatology.
5. Suggestion for improving the TOMS-SBUV TOR column 5
According to Fishman and Balok (1999), the SBUV total O3 column amount between 1000 and 63 hPa is approximately correct while the distribution of O3 amongst the SBUV three lowest layers is not good. In our view the aim of the TOR methodology is to redistribute the 1000–63 hPa column according to the Logan (1999) climatological vertical O3 distribution. However, the Logan (1999) climatology does not go beyond 10
100 hPa, whereas the three lowest SBUV layers range from 1000 to 63 hPa. Clearly, some extension of the Logan (1999) climatology is needed to 63 hPa in order to sensi-bly redistribute the O3amongst the three lowest SBUV layers. As indicated in Sect. 2, Fishman et al. (2003) choose to extend the Logan (1999) climatology vertically above 100 hPa by adding the difference between the Logan (1999) climatology total O3 col-15
umn and the total of the SBUV three lowest layers to the region above 100 hPa. By doing so, the lower two layers (A∗ and B∗; 1000–125 hPa) are effectively identical to the Logan (1999) climatology values and are not scaled to the SBUV 1000–63 hPa measured column. We believe that this violates the idea of using the Logan (1999) climatology to sensibly redistribute the measured A, B and C columns.
20
As indicated in Sect. 2, the “problems” arise from the assumption to extend the Lo-gan (1999) climatology vertically above 100 hPa by using SBUV data (Eq. 3). There appears to be no justification for why the O3climatology above 100 hPa should be cor-rected the way it is being done (using the total of the SBUV levels 1–3 minus the Logan (1999) climatology). A more sensible approach could be to extend the Logan (1999) 25
ACPD
3, 5777–5802, 2003 Problems regarding the tropospheric O3 residual method A. T. J. de Laat and I. Aben Title Page Abstract Introduction Conclusions References Tables Figures J I J I Back CloseFull Screen / Esc
Print Version Interactive Discussion
© EGU 2003
as in the highest Logan (1999) climatology layer. Equation (3) then becomes:
Z∗=Z+aZ. (11)
With a numerical value for a, which is the thickness of the layer between 100 and 63 hPa relative to the thickness of the layer between 125 and 100 hPa (which yields a value for a of about 1.5). Using Eq. (11), we then get for the subcolumns A∗, B∗, C∗: 5
A∗=X×(A+B+C)/(X+Y+Z∗)
B∗=Y×(A+B+C)/(X+Y+Z∗) (12)
C∗=Z∗×(A+B+C)/(X+Y+Z∗)
Equation (12) again satisfies the demand that A∗+B∗+C∗ equals A+B+C. At the same time there is no dependency on the Logan (1999) O3 column climatology values any-10
more, only on the relative scaling between the (extended) Logan (1999) climatology layers. Clearly, the assumption given by Eqs. (11) and (12) should be further examined in more detail. Applying this approach should at least result in TOR which will devi-ate more from the Logan (1999) climatology and are more influenced by the TOMS and SBUV satellite measurements. It is also important to note that the TOR depends 15
strongly on the actual tropopause height. Therefore, tropopause height changes should always be considered in the interpretation of the TOR data.
6. Actual variability of the total stratospheric O3column
One basic assumption of the retrieval method in Fishman et al. (2003) is that the total stratospheric O3 column (SOC) does not vary much within a 5-day period. Typical 20
TOR values range from about 10 DU for the remote equatorial Pacific to about 50 DU for continental mid-latitude regions. Thus, for this assumption to introduce a small error on the TOR the 5-day variability of the SOC should be less than about 5–10 DU
ACPD
3, 5777–5802, 2003 Problems regarding the tropospheric O3 residual method A. T. J. de Laat and I. Aben Title Page Abstract Introduction Conclusions References Tables Figures J I J I Back CloseFull Screen / Esc
Print Version Interactive Discussion
© EGU 2003
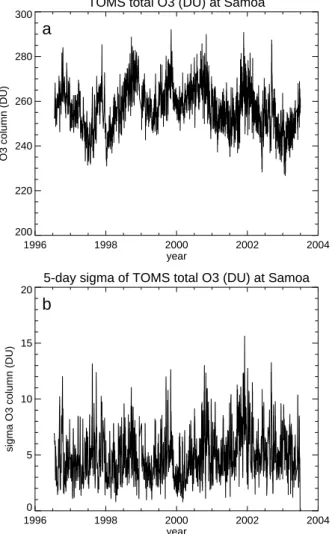
at maximum, and preferably smaller. To investigate this hypothesis we first examine the total O3column over Samoa as measured by the TOMS satellite. Samoa is considered a clean Pacific equatorial location where tropospheric O3concentrations are generally very low throughout the troposphere, as it is remote from any major pollution source. Furthermore, changes in the tropical tropopause height are generally small (see also 5
Fig. 3). As a result, the tropospheric O3column is low (<15 DU according to Fishman et al., 2003), and variations between the seasons are small.
Figure 4a shows the total O3 column over Samoa measured by TOMS (version 7). The seasonal cycle can easily be discerned, with higher column densities towards the end of the year. However, superimposed on the seasonal cycle is a highly varying 10
signal. Figure 4b shows the 5-day standard deviation values of the total O3column for Samoa. Again, there is a seasonal cycle, with a higher variability during the season when the overall concentrations are higher. On average, the 5-day standard deviation of the total O3column is about 5 DU (similar to results from Ziemke et al. (1998), who, based on Microwave Limb Sounder stratospheric O3 profile measurements, derived a 15
typical 2σ variation of the tropical stratospheric O3 column of 10 DU). However, this value varies between 1 and 15 DU, and thus can be as high as the total tropospheric O3 column at Samoa. Since the variability of tropospheric total O3column is small for this remote site, the high variability of the total O3column densities must be caused by variations in the stratospheric O3column densities.
20
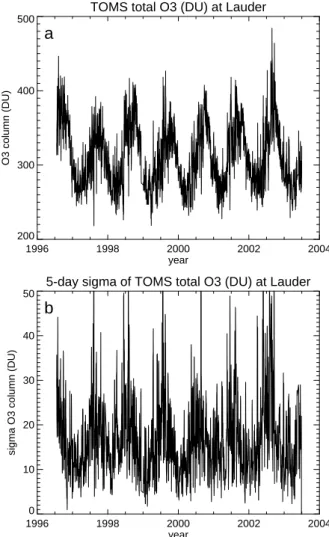
A similar picture occurs when we investigate the total O3column variability at Lauder (New Zealand). Lauder is a mid-latitude station, so that the seasonal cycle of the total O3column is much larger than that at Samoa. According to Fig. 5a, the total O3column densities at Lauder range from about 250 to 400 DU. The 5-day standard variation of the total O3 column (Fig. 5b) is on average approximately 20 DU, with a range from 5 25
to 50 DU.
To further investigate the O3 column variability we looked at stratospheric O3 pro-files obtained from lidar measurements at the site (Brinksma et al., 2002). There are typically about 100 profiles per year (about one every 3 days). Because of the large
ACPD
3, 5777–5802, 2003 Problems regarding the tropospheric O3 residual method A. T. J. de Laat and I. Aben Title Page Abstract Introduction Conclusions References Tables Figures J I J I Back CloseFull Screen / Esc
Print Version Interactive Discussion
© EGU 2003
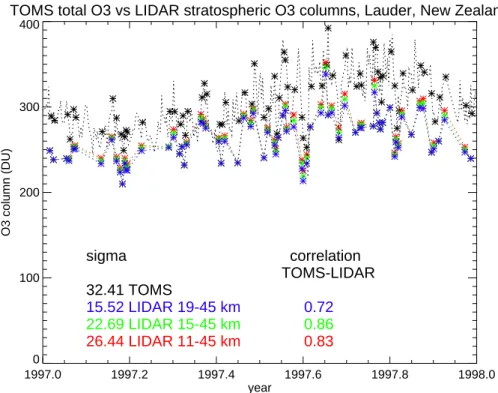
amount of O3profiles, we can compare the variability of the lidar profiles with the vari-ability of the TOMS total O3 column measurements. We took one year (1997) of data to investigate the variability. Figure 6 shows the stratospheric O3 column variations for different layers (11–45, 15–45 and 19–45 km altitude layers) and the corresponding TOMS measurements. The O3 column of above 45 km altitude is typically only 2 DU, 5
and variations are small. We can assume that O3above 45 km adds little to the total O3 column variability. The standard deviation of the TOMS measurements for this pe-riod is 32.4 DU for TOMS collocations with lidar measurements (31.6 DU for all TOMS measurements). The standard deviation for the lidar measurements are 26.4, 22.7 and 15.5 DU for O3columns between 11–45, 15–45 and 19–45 km, respectively. The 10
variability of the O3 column increases with decreasing altitude. This should not be a surprise considering that the upper-troposphere/lower stratosphere region is a much more dynamically active region than the middle and upper stratosphere. Lauder is a mid-latitude site, so that the tropopause generally will be below 15 km altitude, and dur-ing winter closer to 10 km altitude. About 2/3 of the total O3 column variability occurs 15
above 15 km altitude and can be considered stratospheric. What is more, the value of the standard deviation above 15 km altitude was 22.7 DU, which means that varia-tions in the stratospheric O3 column can be as high as 45 DU (2 times the standard deviation). This value is in agreement with the 5-day standard deviations, which, on occasion, could be as high as 50 DU. From this analysis we conclude that a constant 20
stratospheric O3column densities for a 5-day period is not a reasonable assumption. At the same time it must be mentioned that daily stratospheric O3column variations appear to occur randomly. In the TOR method of Fishman et al. (2003) the once-per-5-days SBUV total O3 column measurements are subtracted from the every day total O3 column measurements from TOMS. Over longer periods of time a random 25
signal will average out, and it is likely that this is also the case for the TOMS minus SBUV total O3column densities. To estimate this effect we calculated the differences between the daily TOMS total O3column measurements and the corresponding 5-day TOMS total O3 columns (from −2 days to +2 days; for the period 1996–2003). The
ACPD
3, 5777–5802, 2003 Problems regarding the tropospheric O3 residual method A. T. J. de Laat and I. Aben Title Page Abstract Introduction Conclusions References Tables Figures J I J I Back CloseFull Screen / Esc
Print Version Interactive Discussion
© EGU 2003
average absolute difference for a 5-day period was 15.1 DU for Lauder and 4.0 DU for Samoa. For one month the values were 5.7 and 1.5 DU, and for three months the differences were 3.2 and 0.6 DU for Lauder and Samoa, respectively. As expected, the differences (“errors”) become less important when averaging over longer periods of time. However, for a single month the 5-day sampling of stratospheric O3columns 5
introduces on average an error in the TOR of about 10–20% for Lauder and Samoa. Although these are only rough estimates of the error introduced by the 5-day sampling, they indicate that one should be careful when for example looking at specific single months. Furthermore, these examples show that further investigation is needed to assess the error due to stratospheric O3variability.
10
7. Summary and discussion
In this article we have shown that the method used to retrieve TOR columns as de-scribed in Fishman et al. (2003) and applied in Pierce et al. (2003) yields a TOR that can be considered as the O3 climatology from Logan (1999) below the tropopause, superimposed with differences between every-day TOMS and once-per-5 days SBUV 15
total O3 column measurements. The TOR product therefore is strongly biased to the effect of tropopause height variations and only marginally relies on the used satellite data. We have shown that, by simply applying a realistic tropopause height estima-tion to the Logan (1999) climatology we can derive a “TOR” that is very similar to the TOR climatology presented by Fishman et al. (2003). As a result, we think that the 20
interpretation given to TOR in the application presented in Fishman et al. (2003) is not correct. We have shown that the high TOR columns during summer over India and China are not the result of pollution but of a large increase in tropopause heights in this region. We believe that the formulation of the method as presented in Fishman et al. (2003) is probably not the method they had in mind. We have therefore made a 25
possible suggestion to improve the TOR method using the basic assumptions as pre-sented by the authors in an earlier publication (Fishman and Balok, 1999). However,
ACPD
3, 5777–5802, 2003 Problems regarding the tropospheric O3 residual method A. T. J. de Laat and I. Aben Title Page Abstract Introduction Conclusions References Tables Figures J I J I Back CloseFull Screen / Esc
Print Version Interactive Discussion
© EGU 2003
we have also shown that the implicit assumption that the total stratospheric O3column is nearly constant over 5 days is not valid. This could pose another complication in this TOR methodology. On the other hand, the 5-day variability of the stratospheric O3 column may occur randomly. It is possible that the error introduced by this assumption will average out when TOR columns are averaged over longer periods of time (months-5
seasons). Investigating TOMS total O3 columns for Samoa and Lauder confirms that this effect becomes smaller when averaging over longer periods of time. At the same time, however, it shows that the errors are not that small that they can be ignored. We therefore conclude that the effect of stratospheric O3variability in combination with 5-day SBUV sampling on the final TOR column should be investigated in more detail. 10
Even though the method applied by Fishman et al. (2003) to retrieve TOR columns from satellite measurements is incorrect, the results of the retrieval do not appear to be unreasonable. As was shown, the Fishman TOR column is largely dependent on the Logan (1999) climatology. This climatology itself is based on a large number of O3 sonde measurements. Therefore, the climatology is not an unreasonable approxima-15
tion of the actual O3 concentrations. And averaged over longer periods of time, the actual O3 concentrations will not differ too much from the climatology. Furthermore, by scaling the Logan (1999) climatology to the actual tropopause height, the TOR col-umn will also correlate well with synoptical systems and with seasonal variations in parameters since the tropopause height also changes with season. As a result, the 20
TOR column variations appear to be very realistic. But it should be realized that for this satellite data is not needed.
In this paper we present an alternative to extend the Logan (1999) climatology to 63 hPa and to redistribute the O3 in the three lowest SBUV layers. Further study is needed to optimize the Logan (1999) climatology extension. If the TOR product is be-25
ing improved along the suggested changes, and it can be shown that the stratospheric variability does not introduce large errors in the TOR columns, the TOR columns could become a valuable dataset. However, until these changes have been applied, and a better validation of the dataset against independent measurements has been
per-ACPD
3, 5777–5802, 2003 Problems regarding the tropospheric O3 residual method A. T. J. de Laat and I. Aben Title Page Abstract Introduction Conclusions References Tables Figures J I J I Back CloseFull Screen / Esc
Print Version Interactive Discussion
© EGU 2003
formed, there is little new added information in the current dataset.
Moreover, one should be careful with interpretation of tropospheric O3columns. As was shown for India and China, the tropospheric O3 columns are strongly dependent on tropopause height variations. The effects of tropopause height changes on total tropospheric columns obscures the observation of pollution, therefore the interpreta-5
tion of tropospheric columns should always be accompanied by a description of the tropopause height changes, especially outside the tropics. Without this knowledge, it is not possible to fully understand the tropospheric O3column variability, which in turn can lead to wrong conclusions about the temporal and spatial variability of tropospheric O3.
10
Acknowledgements. The authors would like to acknowledge and thank the following groups and/or people for making datasets publicly available: NASA and the TOMS science team (TOMS total O3 column data); J. Logan, for the O3 climatology (currently at Harvard Univer-sity); D. Swart (RIVM, the Netherlands) and the Network for the Detection of Stratospheric Change (NDSC;http://www.ndsc.ncep.noaa.gov) for the lidar measurements at Lauder. The 15
authors would specifically like to thank D. Swart and A. Maurellis (SRON) for their comments on the paper.
Part of the contents of this paper is based on ACPD discussions with regard to the Fishman et al. (2003) paper (Atmos. Chem. Phys. Discuss., 3, 1453-1476, 2003; SC S355; AC S386; SC S407; AC S861).
20
References
Bhartia, P. K., McPeters, R. D., Mateer, C. L., Flynn, L. E., and Wellemeyer, C.: Algorithm for the estimation of vertical ozone profiles from the backscattered ultraviolet technique, J. Geophys. Res., 101, 18 793–18 806, 1996.
Brinksma, E. J., Ajtic, J., Bergwerff, J. B., Bodeker, G. E., Boyd, I. S., de Haan, J. F., Hogervorst, 25
W., Hovenier, J. W., and Swart, D. P. J.: Five years of observations of ozone profiles over Lauder, New Zealand, J. Geophys. Res., 107, 10.1029/2001JD000737, 2002.
ACPD
3, 5777–5802, 2003 Problems regarding the tropospheric O3 residual method A. T. J. de Laat and I. Aben Title Page Abstract Introduction Conclusions References Tables Figures J I J I Back CloseFull Screen / Esc
Print Version Interactive Discussion
© EGU 2003
Cuevas, E., Gil, M., Rodriguez, J., Navarro, M., and Hoinka, K. P.: Sea-land total ozone differ-ences from TOMS: GHOST effect, J. Geophys. Res., 106, 27 745–27 755, 2001.
Fishman, J., Brackett, V. G., Browell, E. V., and Grant, W. B., Tropospheric ozone derived from TOMS/SBUV measurements during TRACE A, J. Geophys. Res., 101, 24 069–24 082, 1996. Fishman, J. and Balok, A. E.: Calculation of daily tropospheric ozone residuals using TOMS 5
and empirically improved SBUV measurements: Application to an ozone pollution episode over the eastern United States, J. Geophys. Res., 104, 30 319–30 340, 1999.
Fishman, J., Wozniak, A. E., and Creilson, J. K.: Global distribution of tropospheric ozone from satellite measurements using the empirically corrected tropospheric ozone residual technique: identification of the regional aspects of air pollution, Atmos. Chem. Phys., 3, 10
1453–1476, 2003.
Hasekamp, O. P. and Landgraf, J.: Tropospheric ozone information from satellite-based polar-ization measurements, J. Geophys. Res., 107, 10.1029/2001JD001346, 2002.
Hudson, R. D. and Thompson, A. M.: Tropical tropospheric ozone from total ozone mapping spectrometer by a modified residual method, J. Geophys. Res., 103, 22 129–22 145, 1998. 15
Kim, J. H., Hudson, R. D., and Thompson, A. M.: A new method of deriving time-averaged tro-pospheric column ozone over the tropics using total ozone mapping spectrometer (TOMS) ra-diances: Intercomparison and analysis using TRACE A data, J. Geophys. Res., 103, 24 317– 24 330, 1998.
Logan, J. A.: An analysis of ozonesonde data for the troposphere: recommendations for testing 20
3-D models and development of a gridded climatology for tropospheric ozone, J. Geophys. Res., 104, 16 115–16 149,ftp://ftp.as.harvard.edu/pub/sonde/clim/, 1999.
Newchurch, M. J., Sun, D., Kim, J. H., and Liu, X.: Tropical tropospheric ozone derived using Clear-Cloudy Pairs (CCP) of TOMS measurements, Atmos. Chem. Phys., 3, 683–695, 2003. Pierce, R. B., Al-Saadi, J. A., Schaack, T., Lenzen, A., Zapotocny, T., Johnson, D., Kittaka, C., 25
Buker, M., Hitchman, M. H., Tripoli, G., Fairlie, T. D., Olson, J. R., Natarajan, M., Crawford, J., Fishman, J., Avery, M., Browell, E. V., Creilson, J., Kondo, Y., and Sandholm, S. T.: Regional Air Quality Modeling System (RAQMS) Predictions of the tropospheric ozone budget over east Asia, J. Geophys. Res., in press, 2003.
Roeckner, E., Arpe, K., Bengtsson, L., Christoph, M., Claussen, M., D ¨umenil, L., Esch, M., 30
Giorgetta, M., Schlese, U., and Schulzweida, U.: The atmospheric general circulation model ECHAM-4: Model description and simulation of present-day climate, Rep. 218, Max-Planck-Institute for Meteorology, Hamburg, Germany, 1996.
ACPD
3, 5777–5802, 2003 Problems regarding the tropospheric O3 residual method A. T. J. de Laat and I. Aben Title Page Abstract Introduction Conclusions References Tables Figures J I J I Back CloseFull Screen / Esc
Print Version Interactive Discussion
© EGU 2003
SBUV 2003:http://orbit-net.nesdis.noaa.gov/crad/sit/ozone/. TOMS 2003:http://toms.gsfc.nasa.gov/.
Ziemke, J. R., Chandra, S., and Bhartia, P. K.: Two new methods for deriving Tropospheric column ozone from TOMS measurements: assimilated UARS MLS/HALOE and convective-cloud differential techniques, J. Geophys. Res., 103, 22 115–22 128, 1998.
ACPD
3, 5777–5802, 2003 Problems regarding the tropospheric O3 residual method A. T. J. de Laat and I. Aben Title Page Abstract Introduction Conclusions References Tables Figures J I J I Back CloseFull Screen / Esc
Print Version Interactive Discussion © EGU 2003 DJF, TOR, Logan/ECHAM -180 -120 -60 0 60 120 180 Longitude (deg) -50 -25 0 25 50 Latitude (deg)
MAM, TOR, Logan/ECHAM
-180 -120 -60 0 60 120 180 Longitude (deg) -50 -25 0 25 50 Latitude (deg)
JJA, TOR, Logan/ECHAM
-180 -120 -60 0 60 120 180 Longitude (deg) -50 -25 0 25 50 Latitude (deg)
SON, TOR, Logan/ECHAM
-180 -120 -60 0 60 120 180 Longitude (deg) -50 -25 0 25 50 Latitude (deg) [DU] 15 20 25 30 35 40 45 50
Fig. 1. Mean seasonal total tropospheric O3 columns (Dobson Units: 1 DU =
2.69·1016molecules cm−2) using the Logan (1999) climatology and ECHAM tropopause height and surface elevation (DJF: December-January-February, MAM: March-April-May: JJA: June-July-August, SON: September-October-November). ECHAM horizontal resolution is approxi-mately 1.9◦×1.9◦(T63). Model simulation was done for 1996.
ACPD
3, 5777–5802, 2003 Problems regarding the tropospheric O3 residual method A. T. J. de Laat and I. Aben Title Page Abstract Introduction Conclusions References Tables Figures J I J I Back CloseFull Screen / Esc
Print Version Interactive Discussion © EGU 2003 DJF, TOR, Logan/ECHAM 60 70 80 90 100 110 120 130 140 Longitude (deg) -20 -15 -10 -5 0 5 10 15 20 25 30 35 40 45 Latitude (deg) 60 70 80 90 100 110 120 130 140 Longitude (deg) -20 -15 -10 -5 0 5 10 15 20 25 30 35 40 45 Latitude (deg) DJF, TOR, Logan/ECHAM 20 25 25 25 30 30 30 30 30 35
JJA, TOR, Logan/ECHAM
60 70 80 90 100 110 120 130 140 Longitude (deg) -20 -15 -10 -5 0 5 10 15 20 25 30 35 40 45 Latitude (deg) 60 70 80 90 100 110 120 130 140 Longitude (deg) -20 -15 -10 -5 0 5 10 15 20 25 30 35 40 45 Latitude (deg)
JJA, TOR, Logan/ECHAM
20 25 25 30 30 35 35 35 35 40 40 45 45 50 50 [DU] 15 20 25 30 35 40 45 50
Fig. 2. As Fig. 1 but for southeast Asia for the DJF and JJA seasons.
ACPD
3, 5777–5802, 2003 Problems regarding the tropospheric O3 residual method A. T. J. de Laat and I. Aben Title Page Abstract Introduction Conclusions References Tables Figures J I J I Back CloseFull Screen / Esc
Print Version Interactive Discussion
© EGU 2003
Tropopause height differences, JJA-DJF
60 70 80 90 100 110 120 130 140 Longitude (deg) -20 -15 -10 -5 0 5 10 15 20 25 30 35 40 45 Latitude (deg) 60 70 80 90 100 110 120 130 140 Longitude (deg) -20 -15 -10 -5 0 5 10 15 20 25 30 35 40 45 Latitude (deg)
Tropopause height differences, JJA-DJF
-1 1 2 2 3 3 4 4 5 [km] -3. -2. -1. 1. 2. 3. 4. 5.
Fig. 3. Mean tropopause height differences (km) between the seasons DJF and JJA derived
from the ECHAM model simulation for 1996.
ACPD
3, 5777–5802, 2003 Problems regarding the tropospheric O3 residual method A. T. J. de Laat and I. Aben Title Page Abstract Introduction Conclusions References Tables Figures J I J I Back CloseFull Screen / Esc
Print Version Interactive Discussion
© EGU 2003 TOMS total O3 (DU) at Samoa
1996 1998 2000 2002 2004 year 200 220 240 260 280 300 O3 column (DU) a
5-day sigma of TOMS total O3 (DU) at Samoa
1996 1998 2000 2002 2004 year 0 5 10 15 20
sigma O3 column (DU)
b
Fig. 4. TOMS total O3column (DU) measurements over Samoa (14◦150S, 170◦340W) for the
period 1996–2004, and the corresponding five-day standard deviation of the total O3columns. 5800
ACPD
3, 5777–5802, 2003 Problems regarding the tropospheric O3 residual method A. T. J. de Laat and I. Aben Title Page Abstract Introduction Conclusions References Tables Figures J I J I Back CloseFull Screen / Esc
Print Version Interactive Discussion
© EGU 2003 TOMS total O3 (DU) at Lauder
1996 1998 2000 2002 2004 year 200 300 400 500 O3 column (DU) a
5-day sigma of TOMS total O3 (DU) at Lauder
1996 1998 2000 2002 2004 year 0 10 20 30 40 50
sigma O3 column (DU)
b
Fig. 5. As Fig. 4 but for Lauder, New Zealand (45◦020S, 169◦400W).
ACPD
3, 5777–5802, 2003 Problems regarding the tropospheric O3 residual method A. T. J. de Laat and I. Aben Title Page Abstract Introduction Conclusions References Tables Figures J I J I Back CloseFull Screen / Esc
Print Version Interactive Discussion
© EGU 2003 TOMS total O3 vs LIDAR stratospheric O3 columns, Lauder, New Zealand
1997.0 1997.2 1997.4 1997.6 1997.8 1998.0 year 0 100 200 300 400 O3 column (DU) 32.41 TOMS 26.44 LIDAR 11-45 km 0.83 22.69 LIDAR 15-45 km 0.86 15.52 LIDAR 19-45 km 0.72 sigma correlation TOMS-LIDAR
Fig. 6. O3 column measurements (DU) over Lauder, New Zealand for 1997. O3 columns
from lidar measurements were calculated for the altitude ranges 11–45 km (red line), 15–45 km (green line) and 19–45 km (blue line). Total O3column measurements from TOMS are denoted
by the black dotted line, with the collocations with lidar measurements indicated by the aster-ixes. Indicated are also the values of standard deviation of the lidar and TOMS measurements, and the correlations between the lidar O3columns and TOMS total O3column measurements.