HAL Id: hal-02883415
https://hal.sorbonne-universite.fr/hal-02883415
Submitted on 29 Jun 2020
HAL is a multi-disciplinary open access
archive for the deposit and dissemination of sci-entific research documents, whether they are pub-lished or not. The documents may come from teaching and research institutions in France or abroad, or from public or private research centers.
L’archive ouverte pluridisciplinaire HAL, est destinée au dépôt et à la diffusion de documents scientifiques de niveau recherche, publiés ou non, émanant des établissements d’enseignement et de recherche français ou étrangers, des laboratoires publics ou privés.
Global and regional echocardiographic strain to assess
the early phase of hypertrophic cardiomyopathy due to
sarcomeric mutations
Guillaume Baudry, Nicolas Mansencal, Amélie Reynaud, Pascale Richard,
Olivier Dubourg, Michel Komajda, Richard Isnard, Patricia Réant, Philippe
Charron
To cite this version:
Guillaume Baudry, Nicolas Mansencal, Amélie Reynaud, Pascale Richard, Olivier Dubourg, et al.. Global and regional echocardiographic strain to assess the early phase of hypertrophic cardiomyopathy due to sarcomeric mutations. European Heart Journal - Cardiovascular Imaging, Oxford UP, 2019, 21 (3), pp.291-298. �10.1093/ehjci/jez084�. �hal-02883415�
Global and regional echocardiographic strain to assess the early phase of
hypertrophic cardiomyopathy due to sarcomeric mutations
Guillaume Baudry1,2, Nicolas Mansencal3,4, Amelie Reynaud5, Pascale Richard6, Olivier Dubourg3,4, Michel Komajda1,7, Richard Isnard1,8, Patricia Réant5, Philippe Charron1,8
1. APHP, Centre de référence pour les maladies cardiaques héréditaires, Hôpital Pitié-Salpêtrière, Paris, France
2. HCL, Service Insuffisance cardiaque, Hôpital Louis Pradel, Bron, France
3. APHP, Service de Cardiologie, CHU Ambroise Paré, 9 av Charles de Gaulle, 92100 Boulogne Billancourt, France
4.
INSERM U-1018, CESP, Team 5 (EpReC, Renal and Cardiovascular Epidemiology), UVSQ, Villejuif, France5. Université de Bordeaux, CHU de Bordeaux, Service de cardiologie, Bordeaux, France 6. APHP, UF Cardiogénétique et Myogénétique, Service de Biochimie Métabolique,
Hôpitaux Universitaires de la Pitié-Salpêtrière- Charles Foix, 47-83 Bd de l’Hôpital, Paris, France
7. Service de Cardiologie, Hôpital Saint Joseph, Paris, France
8. Sorbonne Université, INSERM, UMR_S 1166 and ICAN Institute for Cardiometabolism and Nutrition, Paris, France
Corresponding author: Philippe Charron; Email: philippe.charron@aphp.fr ; Tel: +33 1 42 16 13 47; Address: Hôpital Pitié-Salpêtrière, Centre de référence pour les maladies cardiaques héréditaires, 47 bvd de l’hôpital, 75013 Paris, France.
Abstract
Aims.
Hypertrophic cardiomyopathy (HCM) is a genetic disease with delayed cardiac expression. Our objective was to characterize left ventricle (LV) myocardial strain by two-dimensional echocardiography in sarcomeric mutation carriers before the hypertrophic stage.
Methods and results.
We studied 140 adults (derivation cohort [n=79], validation cohort [n=61]). The derivation cohort comprised 38 confirmed HCM patients with hypertrophy (LVH+/Gen+), 20 mutation carriers without LV hypertrophy (LVH-/Gen+), and 21 healthy controls. LV global longitudinal strain (GLS) was not different in LVH-/Gen+ compared with controls (20.6%, IQ:18.3/24.2 versus 22.9%, IQ:20.9/26.8), but was reduced in LVH+/Gen+ patients (14.1%, IQ:11.8/18.5, p<0.001). Regional peak longitudinal strain was significantly decreased in LVH-/Gen+ as compared to controls in four segments: basal anteroseptal (BAS) wall (p=0.018), basal inferoseptal wall (p=0.047), basal inferior wall (p=0.006) and mid anteroseptal wall (p=0.022). ROC analysis identified that BAS strain <16.5% had a sensitivity (Se), specificity (Sp), positive and negative predictive values (PPV, NPV) of 57%, 90%, 82% and 67%, respectively, to differentiate LVH-/G+ patients from controls. Similarly, the accuracy of a ratio between basal inferoseptal/basal anterolateral (BIS/BAL) strain <0.76 was 73%, 92%, 82% and 64%, respectively (Se/Sp/PPV/NPV). In the validation cohort, the accuracy of BAS and BIS/BAL was 39%/93%/87%/57% and 55%/96%/95%/64% (Se/Sp/ PPV/NPV), respectively, to differentiate the LVH-/Gen+ group from controls.
Regional longitudinal strain, but not global strain, was significantly reduced at the early stage
of HCM before LV hypertrophy. This suggests that the inclusion of strain (BAS<16.5%; BIS/
BAL<0.76) in the evaluation of HCM relatives would help identify mutation carriers and
early LV abnormalities.
Key words:
List of abbreviations
AS Apical septal
ASE American Society of Echocardiography BAL Basal anterolateral
BAS Basal anteroseptal BIS Basal inferoseptal
DTI Doppler Tissue Imaging
EACVI European Association of Cardiovascular Imaging ECG Electrocardiogram
GLS Global longitudinal strain HCM Hypertrophic cardiomyopathy IVS Interventricular septum
LA Left atrial LV Left ventricular
LVEF Left ventricular ejection fraction
LVEDD Left ventricular end-diastolic diameter LVESD Left ventricular end-systolic diameter LVH Left ventricular hypertrophy
LPW Left inferolateral wall MAS Mid anteroseptal
MYBPC3 myosin-binding protein C MYH 7 beta-myosin heavy chain RV Right ventricular
Introduction
Hypertrophic cardiomyopathy (HCM) is characterized by the presence of increased left ventricular (LV) wall thickness, not explained by abnormal loading conditions (such as hypertension or valvular disease) (1-3). It is a common genetic heart disease that affects at least one out of 500 people in the general population (4). The usual diagnostic criterion is a wall thickness ≥15 mm in one or more left ventricular (LV) segments in index cases, or ≥13 mm in relatives (2,3,5). HCM is mainly caused by mutations in sarcomeric protein genes, which are identified in up to 60% of patients, with a majority of mutations in the beta-myosin heavy chain (MYH7) and myosin-binding protein C (MYBPC3) genes (1, 6–8). Cardiac expression of the disease is typically delayed for many decades and the overt clinical phase is present at various ages, with increasing penetrance during adulthood until about sixty years of age when the penetrance is considered as nearly complete (9–12). However, the preclinical phase of HCM has been described as associated with minor abnormalities, such as subtle myocardial morphological and functional changes, suggesting a continuum in the clinical spectrum of the disease (13–15). As an example, some studies have shown the value of tissue Doppler imaging (TDI) in the diagnosis of mutation carriers before the development of hypertrophy (16–19). Full characterization of the preclinical stage is important for a better understanding of both the natural history and the pathogenesis, since hypercontractile or hypocontractile hypotheses have been suggested as underlying sarcomeric mutations in HCM (1). Moreover, mild and early myocardial abnormalities may identify a subgroup of patients at higher risk for subsequent progression and may also constitute crucial markers for the evaluation of new early treatments.
Global longitudinal strain (GLS) is a recent echocardiography technique able to detect systolic dysfunction prior to the alteration of ejection fraction in various diseases or situations (20). The aim of our study was to characterize early myocardial abnormality by two-dimensional imaging in sarcomeric HCM families and to define the diagnostic accuracy of new criteria. We hypothesized that early systolic dysfunction, before the hypertrophic stage, may be diagnosed using GLS and may be useful for the identification of mutation carriers.
Methods
Patients
Three groups of subjects aged 18 years or more were studied. Mutation carriers and patients with hypertrophic cardiomyopathy were recruited from families with HCM and sarcomeric mutations (from three centers in France). The LVH+/Gen+ group was composed of patients with a diagnosis of HCM and a maximal wall thickness greater than or equal to 15 mm. The LVH-/Gen+ group was composed of mutation carriers without hypertrophy at echocardiography (maximal wall thickness less than 13 mm). The control group was composed of genetically unaffected relatives or healthy volunteers with no history of cardiovascular disease and normal echocardiography. Healthy controls were matched with LVH-/Gen- patients for age (+/- 5 years) and sex.
The derivation group was composed of consecutive LVH - / G + and LVH + / G + patients who had a complete echocardiographic examination with 2D strain in 2 centers (Pitié Salpêtrière and Ambroise Paré Hospitals). An independent validation cohort (from Bordeaux University Hospital) was studied to replicate or not the initial findings.
Echocardiographic study
Echocardiographic studies were performed with a Vivid 7 system (GE Healthcare, Horten, Norway) with measurements in standard two-dimensional (2D) mode, M-mode, pulsed Doppler and TDI, according to the ASE guidelines (21). The following data were collected in M-mode in the long-axis parasternal view: end-diastolic interventricular septum (IVS) and left inferolateral wall (LPW) thickness, LV end-diastolic diameter (LVEDD), LV end-systolic diameter (LVESD), and end-diastolic left atrium (LA) diameter. The left ventricular ejection fraction (LVEF) was calculated using the Simpson 2D method when available, or the Teichholz formula. We also calculated the IVS/LPW ratio and the relative wall thickness, defined by the ratio of end-diastolic (IVS+LPW)/LVEDD. The MWT was defined by the maximal LV thickness in any of the four LV segments (anterior septum, inferior septum, inferolateral wall, and anterolateral wall) measured in the short-axis parasternal view (2D-mode). The early (E) and late (A) transmitral peak velocities (cm/s), E/A ratio, and E deceleration time (EDT in ms) were measured from mitral inflow by pulsed Doppler using an apical four-chamber view. Myocardial velocities were recorded by pulse-TDI at the lateral and septal mitral annulus: systolic (S’), early diastolic (e’), and late diastolic (A’) velocities. We assessed 2D longitudinal strain from the inferolateral and anteroseptal walls (apical three-chamber view), inferoseptal and lateral walls (apical four-three-chamber view), and inferior and anterior walls (apical two-chamber view). We used absolute values for longitudinal strain throughout the study (no dyskinesia was observed). GLS was calculated by averaging all values of regional peak longitudinal strain obtained in each apical view using EchoPAC software (GE Medical Systems, Horten, Norway). In the case of abnormal regional strain values, we planned to study the ratio between strain values of normal and abnormal segments, in order to get parameters independent of absolute values and therefore more prone to
application though various echocardiography technologies. All the echocardiograms from the LVH-/Gen+ and the LVH+/Gen+ groups were recorded by a single observer (P.C in Paris, P.R. in Bordeaux) blinded to knowledge of genetic status. All the echocardiographic studies were subsequently analyzed offline (EchoPAC 6.0, GE Medical Systems Horten, Norway) by a second observer (G.B. in Paris, A.R. in Bordeaux).
Statistical analysis
Statistical analysis was performed using SPSS version 12 (SPSS, Inc, Chicago, IL). Data were presented as median and inter-quartile (25 – 75%). A multiple group comparison study was performed between the three groups using the non-parametric Kruskal-Wallis test, and between LVH-/Gen+ and control subjects using the non-parametric Mann-Whitney test, as the sample size for some groups was small and normal distribution could not be verified for all variables. A P value <0.05 was considered as statistically significant. Performance of each parameter was assessed using the area under the ROC curve. Diagnostic accuracy was studied with optimal cut-off values chosen to have a specificity between 90% and 95%.
Results
We studied a total of 140 adults: a derivation cohort of 79 individuals (38 patients in the LVH+/Gen+ group, 20 patients in the LVH-/Gen+ group and 21 healthy controls) and a validation cohort of 61 subjects (33 mutation carriers without LVH and 28 healthy controls).
Basic characteristics in the derivation cohort
In the derivation cohort (Table 1), median age was 48 years (IQ: 33-55) in the LVH+ group, 31 years (IQ: 24-44) in the LVH-/G+ group, and 30 years (IQ: 30-57) in the control group. Of the 20 subjects from the LVH-/Gen+ group, 13 (65%) carried 9 different MYBPC3 mutations,
3 (15%) carried 3 different MYH7 mutations, 2 (10%) carried 2 distinct TNNT2 mutations and 2 (10%) carried a similar MYL2 mutation. The patients from the LVH+/Gen+ group (distribution of genes: MYBPC3=15; MYH7=10, TNNT 2=1, presumed sarcomeric mutation but without mutation after genetic screening in 12 patients) were older (p=0.022) and had a greater body surface area (p=0.006) than the LVH-/Gen+ group and the control group. However, there was no significant difference between LVH-/Gen+ group and control group regarding these parameters.
Patients in the LVH+/Gen+ group had a higher maximal wall thickness than the LVH-/Gen+ group or healthy controls: 18.9 mm (IQ:16.9-25.2) versus 9.8 mm (IQ: 8.8-11.3) versus 10 mm (IQ: 9.2-10.7), p<0.001 for global comparison. The transmitral E/A wave ratio was not significantly different between the LVH+/Gen+ group and controls, but tissue Doppler E/ Lateral e’ and E/Septal e’ ratios were significantly higher in the LVH+/Gen+ group as compared to controls. Other 2D and Doppler parameters are presented in Table 1.
As compared to healthy controls, mutation carriers without hypertrophy (LVH-/Gen+ group) had similar maximal wall thickness (9.8 mm, IQ:8.8-11.3 versus 10.0 mm, IQ: 9-11), but lower left inferolateral wall thickness (7.4 mm, IQ: 6.5-8.6 versus 8.4 mm, IQ: 7.6-9.1, p=0.025), greater IVS/LPW ratio (1.2, IQ :1-1.4 versus 1.0, IQ :0.9-1.1, p=0.001), lower LVEF (65%, IQ: 60-69 versus 69%, IQ: 66-73, p=0.016) and shorter E deceleration time (156 ms, IQ :147-172 versus 182ms, IQ: 171-221, p<0.001).
Strain analysis in the derivation cohort
The results of strain analysis are presented in Table 2. GLS values were significantly lower in the LVH+/Gen+ group (14.1%, IQ: 11.8/18.5) as compared to healthy controls (22.9%, IQ: 20.9/26.8) or the LVH-/G+ group (20.6%, IQ: 18.3/24.2), p<0.001 for global comparison.
All the regional strain values for the sixteen studied segments were significantly lower in HCM patients (LVH+/Gen+ group) than in healthy controls (Table 2 and Figure 1).
When mutation carriers without hypertrophy (LVH-/Gen+ group) were compared to healthy controls, we observed that GLS was similar in the two groups, but regional strain values were lower in the LVH-/Gen+ group in four segments: basal anteroseptal segment (16.0% versus 19.0%, p=0.018), basal inferoseptal segment (16.0% versus 19.0%, p=0.047), basal inferior segment (21.0% versus 24.0%, p=0.006) and mid anteroseptal segment (21.0% versus 22.5%, p=0.022).
By using ROC analysis (Figure 2), the strain of the basal anteroseptal segment was the best parameter to distinguish LVH-/Gen+ mutation carriers from healthy controls (AUC = 0.76). A cut-off value of less than 16.5% for basal anteroseptal strain had a sensitivity of 57%, a specificity of 90%, a positive predictive value of 82% and a negative predictive value of 67% in differentiating LVH-/Gen+ patients from controls.
To limit potential variability in speckle-tracking imaging systems, we also analyzed four different ratios between segments with and without abnormalities (Table 2 and Figure 3). We observed that three ratios were significantly decreased in LVH-/Gen+ patients as compared to healthy controls: ratio between basal anteroseptal segment and basal inferolateral segment (BAS/BAL), ratio between basal inferoseptal and basal anterolateral segments (BIS/BAL), ratio between basal inferoseptal and apical septal segments (BIS/AS), but the ratio between the sum of septal strain values and the sum of lateral strain values (S/L) was similar.
By using ROC analysis (Figure 4), the ratio with the best diagnostic performance was the basal inferoseptal/basal anterolateral (BIS/BAL) ratio (AUC = 0.82). A cut-off value of less than <0.76 for the BIS/BAL ratio had a sensitivity of 73%, a specificity of 92%, a positive
predictive value of 82% and a negative predictive value of 64% in differentiating LVH-/Gen+ patients from controls.
Strain analysis in the validation cohort
The validation cohort was composed of 61 subjects, including 33 mutation carriers without LVH (LVH-/Gen+ group) and 28 healthy controls. The characteristics of the validation cohort and the results are presented in Table 3. Gene distribution in mutation carriers was the MYBPC3 gene for 15 subjects, MYH7 for 12 subjects, TNNT2 for 3 subjects, ACTC1 for 1 subject, TPM1 for 1 subject and CSRP3 for another subject. Mean age was 42 years (IQ: 34-47) in healthy controls and 40 years (IQ:34-53) in LVH-/Gen+ patients, with no difference regarding sex ratio or BSA. Global longitudinal strain was similar in the two groups, but regional strain values were lower in the LVH-/Gen+ group than in controls in two segments including the basal anteroseptal segment (p=0.035).
BAS strain <16.5% yielded a sensitivity of 39%, a specificity of 93%, a positive predictive value of 87% and a negative predictive value of 57% in differentiating LVH-/G+ patients from controls. A BIS/BAL ratio <0.76 yielded a sensitivity of 55%, a specificity of 96%, a positive predictive value of 95% and a negative predictive value of 64% in differentiating LVH-/G+ patients from controls.
Discussion
Few studies have analyzed myocardial strain in HCM, especially at a preclinical stage. We observed that regional longitudinal strain, but not global longitudinal strain, was significantly reduced at an early stage of HCM, before the development of left ventricular hypertrophy. This finding is consistent with previous reports (22–24), but not with another
one (25). In this latter study, Ho et al. did not observe differences in global or regional strain at the preclinical stage of HCM, however, only global walls were compared, not segments (25). This may explain the apparently discordant figures since in our present study we did not observe differences in global septal wall versus global lateral wall, and differences were observed only at the segmental level.
Taken together, our results demonstrate that mild systolic myocardial dysfunction is frequently present at the preclinical stage of HCM, before overt hypertrophy, and this supports the concept of a continuum in the clinical spectrum of the disease with an intermediate stage between no cardiac expression at all and overt hypertrophy (1,14). Moreover, the early systolic myocardial dysfunction in sarcomeric mutation carriers also shed light on the controversial debate about the primum movens of HCM pathogenesis (1,26). Our results favor the hypocontractile hypothesis, although our study was not designed for this goal and further studies are required to correlate strain abnormalities with tissue characterization and sarcomere function. Interestingly, at a more advanced stage of the disease, Kobayashi et al. found an inverse association between systolic septal strain rate and degree of myocyte hypertrophy, disarray, and interstitial fibrosis in HCM patients undergoing myomectomy (27). In our study, we were also able to define a cut-off for early strain abnormalities and we have deliberately chosen to set the criteria with an optimal specificity and PPV since this could be more useful for clinical applications. Only one study previously proposed a threshold for segmental strain abnormality at the preclinical stage (24), and there was no validation cohort. In this study by Yiu et al., the segment of interest was also the basal anteroseptal segment, and the threshold was associated with high sensitivity but limited specificity (24). In the present study, we identified two new criteria (absolute basal anteroseptal strain value and ratio between basal inferoseptal and basal anterolateral (BIS/BAL) strain) to detect mutation
carriers at the preclinical stage with excellent specificity and the diagnostic accuracy was confirmed in a validation cohort. Since the first criterion may be dependent on the speckle-tracking imaging system that is used, the second criterion may be more robust and less influenced by the imaging system.
These criteria may have various potential applications. First, and basically, the presence of abnormal segmental strain is a strong predictor of genetic status and this may be useful for relatives in families with no genetic data available at all, either because genetic testing was not performed in the index patient or when no mutation was identified in this index patient (a relatively frequent situation: 40% to 60% of families after genetic screening). Second, the presence of abnormal strain at the preclinical stage may be a predictor of rapid occurrence of overt hypertrophy over the following years and these relatives should be closely monitored. However, this requires further studies to confirm or not this potential progression. Third, the presence of abnormal strain at the preclinical stage could be a global predictor of worse clinical outcome, as suggested at a later stage in patients with overt hypertrophy (28,29), but this also remains to be studied and demonstrated. Finally, another application that is already available is to use the new criteria as early markers of the disease in the context of new innovative treatments that may also target the early phase of the disease.
Limitations. Our cohort was relatively small, but this potential limitation was overcome by
the use of a validation cohort. The imaging was recorded and analyzed by a single cardiac sonographer (GE equipment) and results such as thresholds for abnormal strain may not apply to another ultrasound equipment manufacturer. However, the absolute difference in strain values between manufacturers is close to 3.7% and the interobserver mean errors were 5.4% to 8.6% for GLSAV and 6.2% to 11.0% for GLS4CH in the EACVI/ASE Inter-Vendor
Comparison Study (30). Moreover, we used as a second criterion a ratio to prevent equipment-induced variations and the results were confirmed in an independent validation cohort. Finally, this study was not designed to explain the underlying pathophysiology or the impact of early alteration at the preclinical stage in the long term.
Conclusion. We observed that regional longitudinal strain, but not global strain, was
significantly reduced at an early stage of HCM, before development of LV hypertrophy. We
identified two new criteria for abnormal segmental strain (BAS<16.5% or BIS/BAL<0.76)
with high specificity. This suggests that strain should be included in the evaluation of HCM
relatives so as to improve identification of mutation carriers and early LV abnormalities.
References
1. Veselka J, Anavekar NS, Charron P. Hypertrophic obstructive cardiomyopathy. Lancet. 2017;389(10075):1253–67.
2. Authors/Task Force members, Elliott PM, Anastasakis A, Borger MA, Borggrefe M, Cecchi F, et al. 2014 ESC Guidelines on diagnosis and management of hypertrophic cardiomyopathy: The Task Force for the Diagnosis and Management of Hypertrophic Cardiomyopathy of the European Society of Cardiology (ESC). Eur Heart J. 2014 Oct; 35(39):2733–79.
3. Gersh BJ, Maron BJ, Bonow RO, Dearani JA, Fifer MA, Link MS, et al. 2011 ACCF/ AHA guideline for the diagnosis and treatment of hypertrophic cardiomyopathy: A report of the American College of Cardiology Foundation/American Heart Association Task Force on Practice Guidelines Developed in Collaboration with the American Ass. J Am Coll Cardiol. 2011;58(25):e212–60.
4. Semsarian C, Ingles J, Maron MS, Maron BJ. New perspectives on the prevalence of hypertrophic cardiomyopathy. J Am Coll Cardiol. 2015;65(12):1249–54.
multimodality cardiac imaging in the management of patients with hypertrophic cardiomyopathy: An expert consensus of the European Association of Cardiovascular Imaging Endorsed by the Saudi Heart Association. Eur Heart J Cardiovasc Imaging. 2015;16(3):280–280hh.
6. Richard P, Charron P, Carrier L, Ledeuil C, Cheav T, Pichereau C, et al. Hypertrophic cardiomyopathy: Distribution of disease genes, spectrum of mutations, and
implications for a molecular diagnosis strategy. Circulation. 2003;107(17):2227–32. 7. Van Driest SL, Ellsworth EG, Ommen SR, Tajik AJ, Gersh BJ, Ackerman MJ.
Prevalence and spectrum of thin filament mutations in an outpatient referral population with hypertrophic cardiomyopathy. Circulation. 2003;108(4):445–51.
8. Ho CY, Charron P, Richard P, Girolami F, Van Spaendonck-Zwarts KY, Pinto Y. Genetic advances in sarcomeric cardiomyopathies: State of the art. Cardiovasc Res. 2015;105(4):397–408.
9. Charron P, Dubourg O, Desnos M, Bennaceur M, Carrier L, Camproux A-C, et al. Clinical features and prognostic implications of familial hypertrophic cardiomyopathy related to the cardiac myosin-binding protein C gene. Circulation. 1998;97(22):2230–6. 10. Maron BJ, Niimura H, Casey SA, Soper MK, Wright GB, Seidman JG, et al.
Development of left ventricular hypertrophy in adults with hypertrophic
cardiomyopathy caused by cardiac myosin-binding protein C gene mutations. J Am Coll Cardiol. 2001;38(2):315–21.
11. Niimura H, Bachinski LL, Sangwatanaroj S, Watkins H, Chudley AE, McKenna W, et al. Mutations in the Gene for Cardiac Myosin-Binding Protein C and Late-Onset Familial Hypertrophic Cardiomyopathy. N Engl J Med. 1998 Apr 30 [cited 2018 Sep 27];338(18):1248–57.
12. Christiaans I, Birnie E, Bonsel GJ, Mannens MMAM, Michels M, Majoor-Krakauer D, et al. Manifest disease, risk factors for sudden cardiac death, and cardiac events in a large nationwide cohort of predictively tested hypertrophic cardiomyopathy mutation carriers: Determining the best cardiological screening strategy. Eur Heart J. 2011;32(9): 1161–70.
13. Maron MS, Rowin EJ, Lin D, Appelbaum E, Chan RH, Gibson CM, et al. Prevalence and clinical profile of myocardial crypts in hypertrophic cardiomyopathy. Circ
Cardiovasc Imaging. 2012;5(4):441–7.
14. Ho CY. Hypertrophic cardiomyopathy: Preclinical and early phenotype. J Cardiovasc Transl Res. 2009;2(4):462–70.
15. Williams LK, Misurka J, Ho CY, Chan WX, Agmon Y, Seidman C, et al. Multilayer Myocardial Mechanics in Genotype-Positive Left Ventricular Hypertrophy-Negative Patients With Hypertrophic Cardiomyopathy. Am J Cardiol. 2018;122(10):1754–60. 16. Gandjbakhch E, Gackowski A, Tezenas du Montcel S, Isnard R, Hamroun A, Richard
P, et al. Early identification of mutation carriers in familial hypertrophic
cardiomyopathy by combined echocardiography and tissue Doppler imaging. Eur Heart J. 2010 Jul;31(13):1599–607.
17. Nagueh SF, McFalls J, Meyer D, Hill R, Zoghbi WA, Tam JW, et al. Tissue Doppler Imaging Predicts the Development of Hypertrophic Cardiomyopathy in Subjects With Subclinical Disease. Circulation. 2003 Jul;108(4):395–8.
18. Cardim N, Perrot A, Ferreira T, Pereira A, Osterziel KJ, Palma Reis R, et al. Usefulness of Doppler myocardial imaging for identification of mutation carriers of familial
hypertrophic cardiomyopathy. Am J Cardiol. 2002 Jul;90(2):128–32.
19. Nagueh SF, Bachinski LL, Meyer D, Hill R, Zoghbi WA, Tam JW, et al. Tissue Doppler imaging consistently detects myocardial abnormalities in patients with hypertrophic cardiomyopathy and provides a novel means for an early diagnosis before and independently of hypertrophy. Circulation. 2001 Jul;104(2):128–30.
20. Smiseth OA, Torp H, Opdahl A, Haugaa KH, Urheim S. Myocardial strain imaging: How useful is it in clinical decision making? Eur Heart J. 2016;37(15):1196–1207b. 21. Lang RM, Bierig M, Devereux RB, Flachskampf FA, Foster E, Pellikka PA, et al.
Recommendations for Chamber Quantification: A Report from the American Society of Echocardiography’s Guidelines and Standards Committee and the Chamber
Quantification Writing Group, Developed in Conjunction with the European
Association of Echocardiograph. J Am Soc Echocardiogr. 2005 Dec;18(12):1440–63. 22. De S, Borowski AG, Wang H, Nye L, Xin B, Thomas JD, et al. Subclinical
echocardiographic abnormalities in phenotype-negative carriers of myosin-binding protein C3 gene mutation for hypertrophic cardiomyopathy. Am Heart J. 2011;162(2): 262–267.e3.
23. Peyrou J, Réant P, Reynaud A, Cornolle C, Dijos M, Rooryck-Thambo C, et al.
Morphological and functional abnormalities pattern in hypertrophy-free HCM mutation carriers detected with echocardiography. Int J Cardiovasc Imaging. 2016;32(9):1379– 89.
24. Yiu KH, Atsma DE, Delgado V, Ng ACT, Witkowski TG, Ewe SH, et al. Myocardial structural alteration and systolic dysfunction in preclinical hypertrophic
cardiomyopathy mutation carriers. PLoS One. 2012;7(5):1–10.
25. Ho CY, Carlsen C, Thune JJ, Havndrup O, Bundgaard H, Farrohi F, et al.
Echocardiographic strain imaging to assess early and late consequences of sarcomere mutations in hypertrophic cardiomyopathy. Circ Cardiovasc Genet. 2009 Aug;2(4): 314–21.
26. Witjas-Paalberends ER, Piroddi N, Stam K, Van Dijk SJ, Oliviera VS, Ferrara C, et al. Mutations in MYH7 reduce the force generating capacity of sarcomeres in human familial hypertrophic cardiomyopathy. Cardiovasc Res. 2013;99(3):432–41. 27. Kobayashi T, Popovic Z, Bhonsale A, Smedira NG, Tan C, Rodriguez ER, et al.
Association between septal strain rate and histopathology in symptomatic hypertrophic cardiomyopathy patients undergoing septal myectomy. Am Heart J. 2013;166(3):503– 11.
28. Hartlage GR, Kim JH, Strickland PT, Cheng AC, Ghasemzadeh N, Pernetz MA, et al. The prognostic value of standardized reference values for speckle-tracking global longitudinal strain in hypertrophic cardiomyopathy. Int J Cardiovasc Imaging. 2015;31(3):557–65.
29. Reant P, Mirabel M, Lloyd G, Peyrou J, Lopez Ayala JM, Dickie S, et al. Global longitudinal strain is associated with heart failure outcomes in hypertrophic cardiomyopathy. Heart. 2016;102(10):741–7.
30. Farsalinos KE, Daraban AM, Ünlü S, Thomas JD, Badano LP, Voigt JU. Head-to-Head Comparison of Global Longitudinal Strain Measurements among Nine Different Vendors: The EACVI/ASE Inter-Vendor Comparison Study. J Am Soc Echocardiogr. 2015 Jul;28(10):1171–81.
Tables & Figures
Table 1: Clinical and echocardiographic characteristics in the three groups of the derivation
cohort (median and inter-quartile values).
LVH-/G+: LVH-free mutation carriers. LVH+: patients with LVH and typical echocardiography of hypertrophic cardiomyopathy.
LV, left ventricular; LVH, left ventricular hypertrophy; E, peak early phase filling velocity; A, peak late phase filling velocity; e’, pulsed tissue Doppler-derived peak - early diastolic mitral annular velocity; S’, pulsed tissue Doppler-derived - peak systolic tricuspid annular velocity.
LVH+/G+(n=38) median [25–75%] LVH-/G+ (n=20) median [25–75%] Controls (n=21) median [25–75%] P value Multi-group comparison P value LVH+/G+ vs controls P value LVH- /G+ vs controls Clinical data Age (years) 48 (33-55) 31 (24-44) 35 (30-57) 0.022 0.271 0.183 Gender (male) 25 (66) 2 (25) 4 (19) <0.001 0.01 0.645
Body surface area (m²) 1.9 (1.7-2.0) 1.70 (1.6-1.9) 1.72 (1.7-1.9) 0.006 0.037 0.279 Heart rate
(beats per min) 64 (58-71) 76 (63-80) 69 (61-78) 0.034 0.122 0.334
2D/TM data
Interventricular septal
thickness (mm) 17.6 (15.5-21.2) 9 (8.2-10.8) 8.8 (7.8-9.3) <0.001 <0.001 0.273 Left inferolateral wall
thickness (mm) 9.2 (7.3-11.5) 7.4 (6.5-8.6) 8.4 (7.6-9.1) 0.005 0.168 0.025
Septal/inferolateral wall thickness
1.9 (1.4-2.6) 1.2 (1-1.4) 1 (0.9-1.1) <0.001 <0.001 0.001
Relative wall thickness 0.60 (0.50-0.70) 0.37 (0.32-0.40) 0.38 (0.35-0.44) <0.001 <0.001 0.449 LV end-diastolic
dimension (mm) 45 (42-52) 46 (43-50) 45 (42-49) 0.677 0.419 0.457 LV end-systolic dimension
(mm) 25 (22-32) 30 (28-31) 30 (26-32) 0.072 0.159 0.814 Left atrial diameter (mm) 43 (38-51) 33 (30-39) 34 (33-35) <0.001 1 0.801 LV ejection fraction (%) 70 (63-75) 65 (60-69) 69 (66-73) 0.042 0.994 0.016
Maximal wall thickness
(mm) 18.9 (16.9-25.2) 9.8 (8.8-11.3) 10 (9-11) <0.001 <0.001 0.835
Transmitral pulsed Doppler
Peak E velocity (cm/s) 81 (64-89) 89 (73-108) 91 (77-103) 0.065 0.05 0.841 Peak A velocity (cm/s) 61 (51-82) 67 (59-76) 70 (58-81) 0.464 0.27 0.495 E/A ratio 1.26 (0.96-1.67) 1.33 (1.17-1.52) 1.3 (1-1.5) 0.779 0.857 0.678 E deceleration time (ms) 196 (181-252) 156 (147-172) 182 (171-221) <0.001 0.191 <0.001 E/Septal e' 13.20(10.7-17.1) 8.11 (7.1-9.1) 6.89 (6.1-8.1) <0.001 <0.001 0.053 E/Lateral e' 9.1 (6.5-11.6) 6.4 (5-7.3) 5.6 (4.8-6.9) <0.001 <0.001 0.513 Right ventricular S' 13 (12-15) 13.5 (13-15) 13 (12-14) 0.463 0.554 0.214
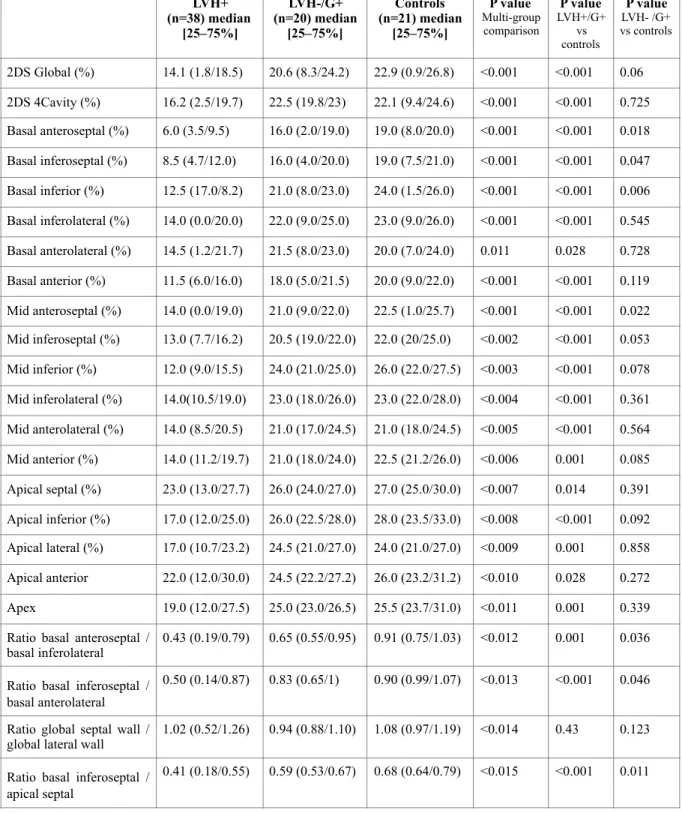
Table 2: Strain values in the three groups of the derivation cohort (median and inter-quartile
absolute values).
LVH-/G+: LVH-free mutation carriers. LVH+: patients with LVH and typical echocardiography of hypertrophic cardiomyopathy.
LVH+ (n=38) median [25–75%] LVH-/G+ (n=20) median [25–75%] Controls (n=21) median [25–75%] P value Multi-group comparison P value LVH+/G+ vs controls P value LVH- /G+ vs controls 2DS Global (%) 14.1 (1.8/18.5) 20.6 (8.3/24.2) 22.9 (0.9/26.8) <0.001 <0.001 0.06 2DS 4Cavity (%) 16.2 (2.5/19.7) 22.5 (19.8/23) 22.1 (9.4/24.6) <0.001 <0.001 0.725 Basal anteroseptal (%) 6.0 (3.5/9.5) 16.0 (2.0/19.0) 19.0 (8.0/20.0) <0.001 <0.001 0.018 Basal inferoseptal (%) 8.5 (4.7/12.0) 16.0 (4.0/20.0) 19.0 (7.5/21.0) <0.001 <0.001 0.047 Basal inferior (%) 12.5 (17.0/8.2) 21.0 (8.0/23.0) 24.0 (1.5/26.0) <0.001 <0.001 0.006 Basal inferolateral (%) 14.0 (0.0/20.0) 22.0 (9.0/25.0) 23.0 (9.0/26.0) <0.001 <0.001 0.545 Basal anterolateral (%) 14.5 (1.2/21.7) 21.5 (8.0/23.0) 20.0 (7.0/24.0) 0.011 0.028 0.728 Basal anterior (%) 11.5 (6.0/16.0) 18.0 (5.0/21.5) 20.0 (9.0/22.0) <0.001 <0.001 0.119 Mid anteroseptal (%) 14.0 (0.0/19.0) 21.0 (9.0/22.0) 22.5 (1.0/25.7) <0.001 <0.001 0.022 Mid inferoseptal (%) 13.0 (7.7/16.2) 20.5 (19.0/22.0) 22.0 (20/25.0) <0.002 <0.001 0.053 Mid inferior (%) 12.0 (9.0/15.5) 24.0 (21.0/25.0) 26.0 (22.0/27.5) <0.003 <0.001 0.078 Mid inferolateral (%) 14.0(10.5/19.0) 23.0 (18.0/26.0) 23.0 (22.0/28.0) <0.004 <0.001 0.361 Mid anterolateral (%) 14.0 (8.5/20.5) 21.0 (17.0/24.5) 21.0 (18.0/24.5) <0.005 <0.001 0.564 Mid anterior (%) 14.0 (11.2/19.7) 21.0 (18.0/24.0) 22.5 (21.2/26.0) <0.006 0.001 0.085 Apical septal (%) 23.0 (13.0/27.7) 26.0 (24.0/27.0) 27.0 (25.0/30.0) <0.007 0.014 0.391 Apical inferior (%) 17.0 (12.0/25.0) 26.0 (22.5/28.0) 28.0 (23.5/33.0) <0.008 <0.001 0.092 Apical lateral (%) 17.0 (10.7/23.2) 24.5 (21.0/27.0) 24.0 (21.0/27.0) <0.009 0.001 0.858 Apical anterior 22.0 (12.0/30.0) 24.5 (22.2/27.2) 26.0 (23.2/31.2) <0.010 0.028 0.272 Apex 19.0 (12.0/27.5) 25.0 (23.0/26.5) 25.5 (23.7/31.0) <0.011 0.001 0.339 Ratio basal anteroseptal /
basal inferolateral 0.43 (0.19/0.79) 0.65 (0.55/0.95) 0.91 (0.75/1.03) <0.012 0.001 0.036
Ratio basal inferoseptal / basal anterolateral
0.50 (0.14/0.87) 0.83 (0.65/1) 0.90 (0.99/1.07) <0.013 <0.001 0.046
Ratio global septal wall /
global lateral wall 1.02 (0.52/1.26) 0.94 (0.88/1.10) 1.08 (0.97/1.19) <0.014 0.43 0.123
Ratio basal inferoseptal / apical septal
Table 3. Clinical and echocardiographic characteristics in the two groups of the validation
cohort.
LV, left ventricular; LVH, left ventricular hypertrophy; LVH -/G+, LVH-free mutation carriers;
Clinical data Controls (n=28), median
[25–75%] LVH-/G+ (n=33), median [25–75%] P value Clinical data Age (years) 42 (34-47) 40 (34-53) 0.47 Gender (male) 13 (46%) 17 (51%) 0.75
Body surface area (m²) 1.6 (1.6-1.8) 1.8 (1.7-1.9) 0.12 Heart rate
(beats per min) 63 (59-74) 70 (57-72) 0.95
2D/M-mode data
Interventricular septal thickness
(mm) 7.0 (6.0-9.0) 9.6 (8.0-10.6) <0.001
Left inferolateral wall thickness
(mm) 7.0 (7.0-9.0) 8.6 (8.0-9.1) <0.01
Septal/inferolateral wall
thickness 1.0 (0.9-1.1) 1.1 (1.0-1.2) 0.063
LV end-diastolic dimension
(mm) 46.5 (42.0-52.3) 46.0 (44.0-48.0) 0.57
Left atrial diameter (mm) 30.5 (28.0-34.0) 35.0 (33.0-36.0) 0.078 LV ejection fraction (%) 68.0 (65.8-70.0) 65.0 (60.0-70.6) 0.15 Maximal wall thickness (mm) 7.0 (7.0-9.0) 9.6 (8.2-10.6) <0.001
Strain 2DS Global (%) 20.6 (19.8-21.3) 21.4 (19.4-22.9) 0.30 Basal anteroseptal (%) 18.3 (17.0-20.6) 17.0 (15.0-19.0) 0.035 Basal inferoseptal (%) 18.0 (17.0-20.3) 16.0 (14.0-18.0) 0.002 Basal inferior (%) 20.0 (19.0-22.3) 20.0 (18.0-23.0) 0.91 Mid anteroseptal (%) 20.0 (19.0-23.0) 22.0 (21.0-24.0) 0.28 Ratio basal anteroseptal / basal
inferolateral 0.97 (0.81-1.06) 0.78 (0.69-1.00) 0.039 Ratio basal inferoseptal / basal
Figure legends
Figure 1: 2D boxplots for strain values indicating the distribution of values within each group (median, quartiles).
0= controls. 1= LVH - /G += LVH-free mutation carriers. 2= LVH = patients with LVH and typical echocardiographic HCM. P values<0.018 between the LVH -/G + and control groups; P values <0.001 between the LVH + and the control groups.
Figure 2: Identification of mutation carriers by strain parameters through receiver operating characteristic (ROC) analysis.
Receiver operating characteristic curves were built for the basal anteroseptal, basal inferoseptal, basal inferior and mid anteroseptal segments.
Figure 3: 2D boxplots for basal inferoseptal / basal anterolateral ratio strain values indicating the distribution of values within each group (median, quartiles).
0= controls. 1= LVH - /G += LVH-free mutation carriers. 2= LVH = patients with LVH and typical echocardiographic HCM. P values <0.046 between the LVH - /G + and control groups; P values <0.001 between the LVH + and the control groups.
Figure 4: Identification of mutation carriers by strain ratio parameters through receiver operating characteristic (ROC) analysis.
Receiver operating characteristic curves were built for the ratios basal anteroseptal / basal inferolateral segment, basal inferoseptal / basal anterolateral, basal inferoseptal / apical septal and the sum of septal strain values / the sum of lateral strain values.
BAS, basal anteroseptal; BIL, basal inferolateral; BIS, basal inferoseptal; BAL, basal anterolateral; AS, apical septal
Figure 5. Example of echocardiography strain pattern.
5A. A patient with confirmed HCM. 5B. A mutation carrier without hypertrophy. 5C. A control subject.