HAL Id: hal-01478314
https://hal.archives-ouvertes.fr/hal-01478314
Submitted on 26 Sep 2017HAL is a multi-disciplinary open access archive for the deposit and dissemination of sci-entific research documents, whether they are pub-lished or not. The documents may come from teaching and research institutions in France or abroad, or from public or private research centers.
L’archive ouverte pluridisciplinaire HAL, est destinée au dépôt et à la diffusion de documents scientifiques de niveau recherche, publiés ou non, émanant des établissements d’enseignement et de recherche français ou étrangers, des laboratoires publics ou privés.
Hemodialysis patients with diabetes eat less than those
without: a plea for a permissive diet
Stanislas Bataille, Jean Landrier, Julien Astier, Sylvie Cado, Jérôme Sallette,
Philippe Giaime, Jérôme Sampol, Hélène Sichez, Jacques Ollier, Jean
Gugliotta, et al.
To cite this version:
Stanislas Bataille, Jean Landrier, Julien Astier, Sylvie Cado, Jérôme Sallette, et al.. Hemodialysis patients with diabetes eat less than those without: a plea for a permissive diet. Nephrology, Wiley, 2016, 22 (9), �10.1111/nep.12837�. �hal-01478314�
This article has been accepted for publication and undergone full peer review but has not
Original article
Hemodialysis patients with diabetes eat less than those without:
a plea for a permissive diet.
Short title: Dietary intake in hemodialysis diabetic patients
Stanislas Bataille, MD1,2,3 ; Jean-François Landrier, PhD4,5,6 ; Julien Astier, PhD4,5,6 ; Sylvie
Cado, PhD7 ; Jérôme Sallette, PhD8 ; Philippe Giaime, MD1,2 ; Jérôme Sampol, MD1,2 ;
Hélène Sichez, MD1,2 ; Jacques Ollier, MD1,2 ; Jean Gugliotta, MD1,2 ; Marianne Serveaux,
MD1,2 ; Julien Cohen9 and Patrice Darmon, MD PhD4,5,6.
1
Phocean Nephrology Institute, Marseille, France
2
Centre de Néphrologie, Clinique Bouchard, Marseille, France
3
Nephrology Dialysis Renal Transplantation Center, APHM, CHU Conception, Marseille,
France
4
Institut National de Recherche Agronomique, Unité Mixte de Recherche 1260, France
5
Inserm, Unité Mixte de Recherche 1062, Nutrition, Obésité et Risque Thrombotique, France
6
Faculté de Médecine, Aix-Marseille Université, F-13385 Marseille Cedex 05, France
7
Laboratoire Cerba, Saint-Ouen l'Aumône, France
8
Cerba Healthcare, Saint-Ouen l'Aumône, France
9
Medistats, Marseille, France
Corresponding author: Dr Stanislas Bataille, MD, Phocean Nephrology Institute Clinique
Bouchard, 77 rue du Docteur Escat, 13006 Marseille, France, Tel: +33 (0)4 91 15 90 85, Fax:
Abstract
Aim
The main cause of malnutrition in hemodialysis patients is a spontaneous decline in energy
and protein intakes. This study aims to report the dietary energy intake (DEI), dietary protein
intake (DPI), and dietary micronutrient intake in a French HD population, to report factors
associated with a low DPI and DEI, and to analyze if nutritional intake was correlated with
nutritional status.
Methods
We conducted an observational cross-sectional study in a hemodialysis population of 87 adult
patients in July 2014. Daily nutritional oral intake, handgrip strength, body composition
measured by bioimpedancemetry, and biological and dialysis parameters were obtained from
medical records. Statistical analyses of parameters associated with DEI and DPI were
performed.
Results
The median age (interquartile range) of the population was 77.3[71.1; 84.8] years, 57.5%
were men, and 52.9% had diabetes mellitus. Median weight-adjusted DEI was
18.4[15.7;22.3]kcal/kg/day (1308 [1078; 1569] kcal/day), and median weight-adjusted DPI
was 0.80[0.66; 0.96] g/kg/day (57.5[47.1; 66.8] g/day).
In multivariate analysis, weight-adjusted DEI was statistically lower in patients with diabetes
(coefficient [95%CI] -3.81[-5.21;-2.41] kcal/kg/day; p=0.01) but was not associated with the
others parameters. When DEI was not adjusted for weight, diabetes was no longer associated
with DEI, but female gender (-178[-259;-961] kcal/day; p=0.03) and a higher Charlson
comorbidity index (-30[-44;-15]; p=0.04) were associated with a lower calorie intake. Results
Conclusions
Diabetes is an important factor associated with low dietary intake in hemodialysis patients.
Restrictive regimens should be prescribed cautiously in hemodialysis patients, especially in
those with diabetes.
Keywords: diabetes, dietary intake, hemodialysis, nutritional intake, protein energy wasting
syndrome.
Conflict of interest
None to be declared.
Introduction
Malnutrition is a major complication of chronic renal failure, occurring in 1/4 to 1/3 of
hemodialysis (HD) patients according to malnutrition diagnosis criteria [1, 2]. In patients
with chronic renal failure, malnutrition has been included within the well-named
Protein-Energy Wasting syndrome (PEW). PEW is a state where decreased body stores of protein and
energy fuels are caused by low nutrient intake, but also from hyper-catabolism or protein loss
during HD or peritoneal dialysis [3, 4]. Large epidemiologic studies reveal a strong
correlation between PEW and mortality in end-stage renal disease (ESRD) [5].
European Best Practices Guidelines on nutrition recommend that maintenance HD patients
consume at least 1.1 g/kg/day dietary protein intake (DPI) and have a dietary energy intake
(DEI) of 30–40 kcal/kg/day [1], but restrictive regimens –with low phosphate, potassium or
sodium intakes- are also recommended [1]. Dietary intake studies in ESRD populations have
recently been reviewed [6]. Most studies report insufficient DPI and DEI in patients with
chronic renal failure, and even lower intakes in HD patients. Low DPI and DEI have been
Unfortunately, most studies on DEI and DPI in HD populations have been performed outside
of Europe, and very few in France, where populations might have significantly different diets
based on population nutritional habits [9]. Moreover, many studies have taken place before
the year 2000, and HD population characteristics have changed since then. For example,
mean age of hemodialysis populations is increasing in most countries [10]. Finally, in most
studies, no analyses of factors leading to a poor nutritional intake have been performed, and
no correlations made between low intakes and nutritional status [6].
The aim of this study was to report DPI, DEI, and dietary micronutrient intakes in a recent
HD French population, to report factors associated with a low DPI and DEI, and to analyze if
nutritional intake was correlated with nutritional status.
Materials and Methods
We conducted an observational cross-sectional study on all patients from our HD center in
July 2014. All patients with data available regarding nutrition were included, except for
pregnant women or patients aged <18 years. Patients unable to report a reliable nutritional
intake diary were excluded. Written information was provided to all patients, and all gave
consent for their personal data to be used for research purposes. According to French law, it
is neither necessary nor possible to obtain approval from an ethical committee (in French
CPP, Comité de Protection des Personnes) for this type of non-interventional study.
Moreover, CPPs are not entitled to issue waivers of approval for this type of study.
Nevertheless, this study obtained approval from the Health Research Data Processing
Advisory Committee (in French CCTIRS, Comité consultatif sur le traitement de
Data on all patients who performed the handgrip strength test as well as detailed methodology
have been published elsewhere; however the present study included the patients who could
not perform the handgrip test, but not those where DPI and DEI were not recorded [11].
Briefly, clinical and biological data, body composition measured using bioimpedancemetry
analyses (BIA), and 48-hour nutritional intake assessments by dieticians were recorded.
The following data were collected from the patients’ medical files: age, gender, history of
diabetes mellitus, nephropathy, length of time on dialysis, height, post-dialysis weight,
habitual time and frequency of hemodialysis, and prescribed medications. Evaluation of daily
urine output was based on oral questioning of the patients and was therefore
semi-quantitative: ≥500 mL/d or <500 mL/d. Dialysis parameters were recorded at the mid-week
session, and biological analyses were all performed at the start of this hemodialysis session.
Normalized protein nitrogen appearance (nPNA) was estimated from intradialytic changes in
urea-nitrogen concentrations in the serum [1] and dialysis dose was estimated by a
single-pool Kt/V (spKt/V), as recommended by Daugirdas et al. [12]. The ESRD adapted Charlson
Comorbidity Index was performed for each patient [13].
Continuous 2-day dietary histories (that included a dialysis day and a non-dialysis day) were
self-completed in a food diary, including oral nutritional supplements. Each food diary was
then checked and/or corrected by an experienced dietician during a short interview with the
patient. These data were then analyzed using Bilnut 7.5® software (Nutrisoft, France) to
estimate DEI and DPI as well as weight-adjusted DEI and DPI which were measured as DEI
and DPI divided by dry weight. Results provided are the mean values of the dialysis and the
non dialysis day intakes. Bilnut 7.5® software is used to evaluate DEI and DPI from dietary
histories. It is based on the French food composition databank named Ciqual which is
published by the Observatory of Food Nutritional Quality, unit of ANSES (the French agency
In the dialysis unit, predialysis serum albumin was assessed each week, as well as nutritional
status based on BMI; nPNA was performed every three months. Patients with signs of
malnutrition received nutritional counseling from trained nurses plus prescriptions for oral
nutritional supplements. Patients with severe PEW symptoms were prescribed oral nutritional
supplement (Fresubin 2kcal Drink®, Fresenius contains 400 kcal and 20g of proteins in a
200mL bottle) during each dialysis session and/or intradialytic parenteral nutrition, as
appropriate. Calorie and protein intakes of oral nutritional supplements were included in the
DEI and DPI calculations. Base expenditure energy (BEE) was calculated according to the
Harris and Benedict formula.
BIA was performed during the midweek hemodialysis session using Z-Hydra® (Bioparhom,
France) which is a multifrequency bioimpedancemetry device that allows measurement
during hemodialysis session. It provides data on lean mass and fat mass using specific
algorithms developed by the manufacturer. Fluid compartments were not studied in this
cohort. Normal values provided by the manufacturer were defined as mean ±1.96 standard
deviations of values obtained in a healthy population of similar age and gender.
The Mann–Whitney, chi-squared, and Fisher's exact tests were performed to assess factors
associated with diabetes mellitus. A linear-regression model was used to determine factors
associated with DEI and DPI. In a first step, variables with a statistical p-value of <0.10 in the
univariate analyses were considered eligible for inclusion in the multivariate analyses. In a
second step, using a descending stepwise method, variables with a p<0.05 in the multivariate
analyses were retained within the final model. Results are shown as their medians [IQRs] or
Results
Studied population
A total of 87 HD patients were included in this observational study. Median age [IQR] was
77.3 [71.1–84.8] years and 57.5% of patients were male (Table 1). Of the total patients,
52.9% had diabetes mellitus. All patients had end-stage renal failure and had been treated
with conventional hemodialysis with high-flux membranes for 27.6 [13.0–70.1] months.
Residual diuresis of ≥500 mL was present in 52.9% of patients.
The etiology for the primary cause of renal failure was diabetic nephropathy in 29.9% of
patients, vascular nephropathy in 24.1%, chronic interstitial nephritis in 8.0%, non-diabetic
glomerular disease in 4.6%, autosomal dominant polycystic kidney disease in 2.3%, other in
6.9%, and unknown in 24.1%.
Dialysis parameters are reported in Table 1. Most patients underwent at least 12 h of HD,
distributed among three sessions per week. Median spKt/V [IQR] was 1.60 [1.47–1.81].
Vascular access was a native fistula in 67.8% of patients.
Validity of the dietary-intake evaluation
To assess quality of DPI and DEI evaluation using continuous 2-day dietary histories, we
compared weight-adjusted DPI, evaluated from dietary histories, to nPNA values (which are
both indirect methods to assess protein intake). Weight-adjusted DPI and nPNA were
statistically correlated (p=0.04), which confirmed the quality of our continuous 2-day dietary
Dietary intakes
There was very low dietary intakes in our aged and comorbid population, with a mean
weight-adjusted DEI of 18.4 [15.7; 22.3] kcal/kg/day, which equals 1308 [1078; 1569]
kcal/day (Table 2). This low estimated DEI was comparable to the median estimated BEE of
1311 [1180; 1509] kcal/day and was far below the recommended weight-adjusted DEI of 30–
40 kcal/kg/day. Similarly, weight-adjusted DPI was low in most patients, with a mean
weight-adjusted DPI of 0.80 [0.66; 0.96] g/kg/day, which equals 57.5 [47.1; 66.8] g/day.
Daily intakes of most micronutrients were lower than advised in recommendations; among all
the evaluated micronutrients, only phosphate intake was sufficient. Moreover, this low
dietary intake was observed although 26.4% of the patients were also being prescribed oral
nutritional supplements.
Energy intakes recorded on the dialysis day were similar to dietary intakes on non-dialysis
day, but DPI and weight-adjusted DPI tended to be lower on the non-dialysis day (Table S1).
Fewer patients had a weight-adjusted DPI below 1.1 g/kg/day on the non-dialysis day
(70.0%) compared to on the dialysis day (89.7%) (p=0.003).
Within our population, 46 patients (52.9%) had diabetes mellitus. When compared to patients
without diabetes, patients with diabetes were younger (p=0.01) and had a greater body weight
(p<0.0001) and BMI (p<0.0001) (Tables 1 and 3). In univariate analyses, patients with
diabetes had a lower weight-adjusted DEI and a lower weight-adjusted DPI than patients
without, but total DEI and DPI did not differ between the two groups, which could be
explained by the overall greater weight of patients with diabetes (Table 2). For other
parameters, dietary intakes did slightly differ between the two groups: patients with diabetes
ate less simple carbohydrates and more fibers, as recommended by dieticians in usual diabetic
and those without. Evaluated water intake was comparable, but not ultrafiltration volume,
which was greater in patients with diabetes (Table 1).
Nutritional status
Common nutritional and biological parameters of the population are reported in Table 3.
Although our population was aged, nutritional parameters remained correct with a median
[IQR] BMI of 26.5 [23.0; 30.1] kg/m², a median albumin of 39 [36; 40] g/L, and a median
prealbumin of 0.28 [0.22; 0.34] g/L. These nutritional parameters were identical in patients
with diabetes and those without.
Body composition analysis of our population showed that 36% of patients had an increased
fat mass (as percentage of body weight) and 36% had a low lean mass. This observation was
even worse for patients with diabetes where 46.3% of patients had a high fat mass (Table 3).
Determinants of dietary intake
Using uni- and multivariate analyses, we searched for parameters associated with DEI and
DPI (Table 4) within: gender, age, diabetes, BMI, inflammation estimated with C-reactive
protein (CRP), and the Charlson comorbidity index.
In the multivariate analysis, weight-adjusted DEI was statistically lower in patients with
diabetes (coefficient [95% CI] -3.81 [-5.21; -2.41] kcal/kg/day; p=0.01) but was not
associated with the others parameters. When DEI was not adjusted for weight, diabetes was
no longer associated with DEI, but female gender (-178 [-259; -961] kcal/day; p=0.03) and a
higher Charlson comorbidity index (-30 [-44; -15]; 0.04) were associated with a lower calorie
intake. Results for DPI were similar except that the Charlson comorbidity index did not reach
(coefficient [IQR] -0.15 [-0.21; -0.09] g/kg/day; p=0.01) and DPI not indexed for weight was
lower in female patients (-7.6 [-11.5; -3.8] g/day; p=0.05).
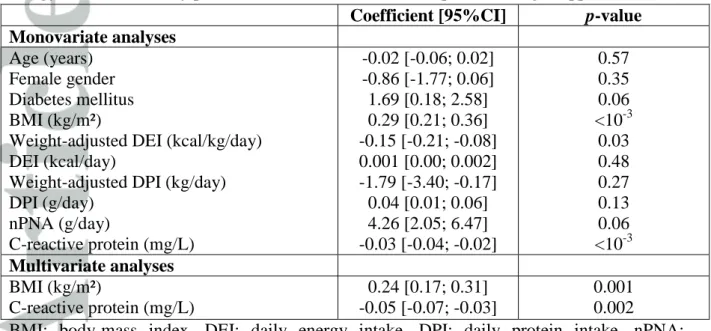
Determinants of serum albumin
In the univariate analyses, a higher BMI, a higher nPNA, and lower values of CRP were
associated with higher serum albumin (Table 5). A lower DEI indexed for body weight was
associated with higher serum albumin, but this association disappeared when pooled with
BMI and thus represents the effect of weight rather than DEI.
In the multivariate analyses, only a high BMI (0.24 [0.17; 0.31]; p=0.001) and a low CRP
(-0.05 [-0.07; -0.03]; p=0.002) were associated with higher serum albumin (Table 5).
Discussion
In this observational cross-sectional study, we report on the dietary intake of 87 HD patients.
In the multivariate analyses, female gender and a high Charlson comorbidity index score
were associated with low calorie and protein intakes. Diabetes per se did not influence total
daily nutritional intake, but as patients with diabetes are heavier patients without,
weight-adjusted DPI and DEI were lower in this subgroup of patients.
Continuous evaluation of 2-day dietary intake showed very low dietary intakes. One could
suggest this was because of underestimating dietary intake in the questionnaires, but DPI
correlated well with nPNA, which evaluates protein intake and so was unbiased by the patients’ reporting (Figure 1).
We found a median DEI of 1308 kcal/day (i.e., 18.4 kcal/kg/day) and a median DPI of 57.5
g/day (i.e., 0.80 g/kg/day). These intakes are far below the recommended DEI and DPI values
for HD patients of, respectively, 30–40 kcal/kg/day and >1.1 g/kg/day [1]. In fact, dietary
No study on HD patients has reported a DEI below 20 kcal/kg/day until now; most studies
have reported intakes varying between 20 and 30 kcal/kg/day, which is still lower than the
recommended values [6]. The very low intake might be explained by the old age and high
comorbidity level of our population.
In our study, DEI was almost equivalent to BEE. HD patients might, however, have very low
activity related energy expenditure [14, 15]. In our aged HD population, physical activity
might be considered as almost inexistent.
Interestingly, intakes are low, even of substances that accumulate during renal failure and that
physicians and dieticians commonly recommend are avoided in their regimens. For example,
our patients had very low sodium intakes: median of 1254 mg/day (i.e., 3187 mg/day of
sodium chloride), but as sodium can be added separately after cooking, evaluation within the
dietary diary could have been underestimated: thus, these data should be interpreted
cautiously.
Phosphate intake, an accumulating compound during ESRD and associated with vascular
calcification and mortality [16], was at the lower level of the recommended range.
Phosphates are mostly found in protein. Although we have described a low protein intake in
our patients, phosphate intake was within the normal range. Water intake, in contrast, was
greater than the 500 to 750 mL/d recommendation for anuric patients, leading to median
ultrafiltration of 2000 mL/HD session [1].
Nutritional parameters remained within normal ranges, with median albumin of 39 g/L and a
median BMI of 26.5 kg/m². However, BMI might not be a relevant parameter because 36%
of our patients had high fat mass (in proportion to body weight) and 36% had low lean mass.
Modification of body composition with an increase in fat mass and reduction of muscle mass
is a well known feature of HD patients [17]. In a recent study, the ratio of serum creatinine to
predicting death than BMI [18]. Survival is more impacted by lean body mass than by fat
mass in HD patients, and BMI should be adjusted with or replaced by a lean-mass biomarker,
for example with plasmatic creatinine [19, 20]. The low nutritional requirements in the highly
inactive HD patient population could be an explanation of the maintenance of nutritional
parameters in normal ranges [14, 15].
In multivariate analyses, the main determinants of dietary intake were gender and
comorbidities, but not age or inflammation, which did not influence dietary intake in our
study. Other studies have reported factors affecting dietary intakes. For example, secondary
analysis of the HEMO study reported higher DEI and DPI in men, in younger patients, in
patients without diabetes, and in patients with a high comorbidity score (measured with the
Index of Co-Existing Disease (ICED) score) [21]. This study of 1901 patients included
younger patients than ours, which could explain the influence of age on intake. However, we
have confirmed the importance of female gender, comorbidities, and diabetes status, which
negatively influenced dietary intake in our smaller study, thus pleading in favor of a major
role for diabetes in lowering nutritional intake in HD patients. Interestingly, in the
multivariate analyses of the HEMO study cohort, diabetes remained an important factor, but
the comorbidity ICED score was no longer significant. Of note, diabetes is a component of
the Charlson Comorbidity Index implying that diabetes is a central parameter that influences
dietary intake in a negative way [22].
Weight-adjusted DEI and DPI were associated with diabetes, but not non-adjusted DEI and
DPI (Table 4). This means patients with diabetes eat as much as patients without, but because
they are heavier than patients without, they eat less per kg of weight. Fat mass was more
frequently high in patients with diabetes than those without, and lean mass was low in 44.1%
of patients with diabetes. Thus, even though patients with diabetes have a higher BMI, their
In our study, protein intake tended to be lower on the non-dialysis day. This finding is the
opposite of that reported in the HEMO study, in which DEI and DPI were lowest on the
dialysis day [21]. One explanation could be that PEW patients in our center have oral
supplementation prescribed during the HD session.
Finally, water intake was similar in patients with or without diabetes, but ultrafiltration
volume was statistically higher in the subgroup with diabetes, which might reflect unreported
fluid intake in the diabetic population. Thirst favored by hyperglycemia could be responsible
for this difference.
In the univariate analyses, BMI and nPNA were positively associated with serum albumin,
whereas CRP was negatively correlated with serum albumin (Table 5). DEI indexed by body
weight was also positively associated with serum albumin, but this association disappeared
when it was pooled with BMI, and thus represents the effect of weight rather than DEI. In
multivariate analyses, only BMI (0.24 [0.17; 0.31]; p=0.001) and CRP (-0.05 [-0.07; -0.03];
p=0.002) were independently associated with serum albumin (Table 5).
Appetite is a complex physiological process. Anorexia-induced inadequate nutrient intake is
an important cause of malnutrition in HD patients, and a decline in protein and calorie intake
becomes gradually manifest once glomerular-filtration rate declines to approximately <25–38
mL/min. [23]. The causes of anorexia in HD patients are multiple [24]: uremic toxins, a high
pill burden, pain, medical treatments, and various comorbid conditions. Well-intended
regimen prescriptions and advice on various dietary restrictions may also induce an
unintended decrease in nutrient intake [7]. Restrictive diet recommendations, which are
commonly provided to renal-failure patients (low phosphate, low potassium, low sodium,
sugar free), could lead to even lower dietary intakes in patients who hardly cover their BEE
[8]. Thus, the dietary intake should be individually evaluated prior to prescribing a diet in
instead of being limited when DEI or DPI is low. However, fluid intake should be maintained
at a low level to avoid volume overload and pulmonary edema.
Because nutrient intakes are low, we recommend that specialized dietary advice should be
preferred to restrictive regimens in HD patients with diabetes.
Our study suffers from several limitations. Firstly, evaluation of dietary intake using food
diaries might have underestimated oral intake [6] and the Bilnut 7.5® software could be
imprecise. We believe though that even if oral intakes were underestimated by 20%, most of
our hemodialysis population still had far below the recommended intakes. To note, DPI were
statistically correlated to nPNA evaluation, which favors correct evaluation. Our study might
also be underpowered because only 87 patients were included. Another limitation could be
that patients in our population were old and that our findings might not be extrapolated to
younger patients. Nevertheless, DEI, DPI, weight-adjusted DEI and weight-adjusted DPI
were not statistically different between patients < or ≥75 years-old (data not shown). Thus,
age influenced less dietary intakes than comorbidities in our study.
In conclusion, we confirm that diabetes is an important factor associated with low dietary
intake in HD patients, particularly in patients with several comorbidities. The dietary intake
should be individually evaluated prior to prescribing a restrictive regimen in dialysis patients,
especially in patients with diabetes.
Acknowledgements
We thank Elisa Carreno and Nathalie Pedinielli, clinical research assistants, for their help in
collecting the data. We thank Catherine Clement and Laure Justiniany, dieticians, for the
dietary analyses. We thank Michel Cardot (Meditor SA) and Eva Ribbe (Bioparhom SA) for
References
1. Fouque D, Vennegoor M, ter Wee P, et al. EBPG guideline on nutrition. Nephrol Dial
Transplant. 2007 May;22 Suppl 2: ii45-87.
2. Johansson L, Hickson M, Brown EA. Influence of psychosocial factors on the energy and
protein intake of older people on dialysis. J Ren Nutr. 2013 Sep;23(5):348-355.
3. Fouque D, Kalantar-Zadeh K, Kopple J, et al. A proposed nomenclature and diagnostic
criteria for protein-energy wasting in acute and chronic kidney disease. Kidney Int. 2008
Feb;73(4): 391-398.
4. Lim VS, Ikizler TA, Raj DS, Flanigan MJ. Does hemodialysis increase protein breakdown?
Dissociation between whole-body amino acid turnover and regional muscle kinetics. J Am
Soc Nephrol. 2005 Apr;16(4):862-868.
5. Kalantar-Zadeh K, Ikizler TA, Block G, Avram MM, Kopple JD. Malnutrition-inflammation
complex syndrome in dialysis patients: causes and consequences. Am J Kidney
Dis. 2003 Nov;42(5):864-881.
6. Therrien M, Byham-Gray L, Beto J. A Review of Dietary Intake Studies in Maintenance
Dialysis Patients. J Ren Nutr. 2015 Jul;25(4):329-338.
7. Kovesdy CP, Shinaberger CS, Kalantar-Zadeh K. Epidemiology of dietary nutrient intake in
ESRD. Semin Dial. 2010 Jul-Aug;23(4):353-358.
8. Ikizler TA, Cano NJ, Franch H, et al; International Society of Renal Nutrition and
Metabolism. Prevention and treatment of protein energy wasting in chronic kidney disease
patients: a consensus statement by the International Society of Renal Nutrition and
Metabolism. Kidney Int. 2013 Dec;84(6):1096-1107.
9. Rabin BA, Boehmer TK, Brownson RC. Cross-national comparison of environmental and
10. van de Luijtgaarden MW, Jager KJ, Segelmark M, et al. Trends in dialysis modality choice
and related patient survival in the ERA-EDTA Registry over a 20-year period. Nephrol Dial
Transplant. 2016 Jan;31(1):120-8.
11. Bataille S, Landrier JF, Astier J, et al. The "Dose–Effect" Relationship Between
25-Hydroxyvitamin D and Muscle Strength in Hemodialysis Patients Favors a Normal Threshold
of 30 ng/mL for Plasma 25-Hydroxyvitamin D. J Ren Nutr. 2016 Jan;26(1):45-52.
12. Daugirdas JT. Second generation logarithmic estimates of single-pool variable volume Kt/V:
an analysis of error. J Am Soc Nephrol. 1993;4:1205–1213.
13. Hemmelgarn BR, Manns BJ, Quan H, Ghali WA. Adapting the Charlson Comorbidity Index
for use in patients with ESRD. Am J Kidney Dis. 2003 Jul;42(1):125-132.
14. Baria F1, Kamimura MA, Avesani CM, et al. Activity-related energy expenditure of patients
undergoing hemodialysis. J Ren Nutr. 2011 May;21(3):226-234.
15. Panaye M, Kolko-Labadens A, Lasseur C, et al. Phenotypes influencing low physical activity
in maintenance dialysis. J Ren Nutr. 2015 Jan;25(1):31-39.
16. Block GA, Klassen PS, Lazarus JM, Ofsthun N, Lowrie EG, Chertow GM. Mineral
metabolism, mortality, and morbidity in maintenance hemodialysis. J Am Soc Nephrol. 2004
Aug;15(8):2208-2218.
17. Marcelli D, Brand K, Ponce P, et al. Longitudinal Changes in Body Composition in Patients
After Initiation of Hemodialysis Therapy: Results From an International Cohort. J Ren Nutr.
2016 Mar;26(2):72-80.
18. Moreau-Gaudry X, Jean G, Genet L, et al. A simple protein-energy wasting score predicts
survival in maintenance hemodialysis patients. J Ren Nutr. 2014 Nov;24(6):395-400.
19. Beddhu S, Pappas LM, Ramkumar N, Samore M. Effects of body size and body composition
20. Moreau-Gaudry X, Guebre-Egziabher F, Jean G, et al. Serum creatinine improves body mass
index survival prediction in hemodialysis patients: a 1-year prospective cohort analysis from
the ARNOS study. J Ren Nutr. 2011 Sep;21(5):369-375.
21. Burrowes JD, Larive B, Cockram DB, et al; Hemodialysis (HEMO) Study Group. Effects of
dietary intake, appetite, and eating habits on dialysis and non-dialysis treatment days in
hemodialysis patients: cross-sectional results from the HEMO study. J Ren Nutr. 2003
Jul;13(3):191-198.
22. Miskulin DC, Athienites NV, Yan G, et al; Hemodialysis (HEMO) Study Group.
Comorbidity assessment using the Index of Coexistent Diseases in a multicenter clinical trial.
Kidney Int. 2001 Oct;60(4):1498-1510.
23. Kopple JD, Berg R, Houser H, Steinman TI, Teschan P. Nutritional status of patients with
different levels of chronic renal insufficiency. Modification of Diet in Renal Disease
(MDRD) Study Group. Kidney Int Suppl 1989 Nov;27:S184-S194.
24. Bergstrom J. Mechanisms of uremic suppression of appetite. J Ren Nutr. 1999
Jul;9(3):129-132.
25. Schlienger JL. Besoins nutritionnels et apports conseilles : adultes, femmes enceintes,
personnes âgées, sportifs. In: Elsevier Masson Eds: Nutrition Clinique Pratique. Partie I.
Figure 1: Weight-adjusted dietary protein intake (DPI) of a hemodialysis population
associated with nPNA: univariate analyses (linear regression model, n=87 patients).
nPNA: Normalized protein nitrogen appearance estimated from intradialytic changes in
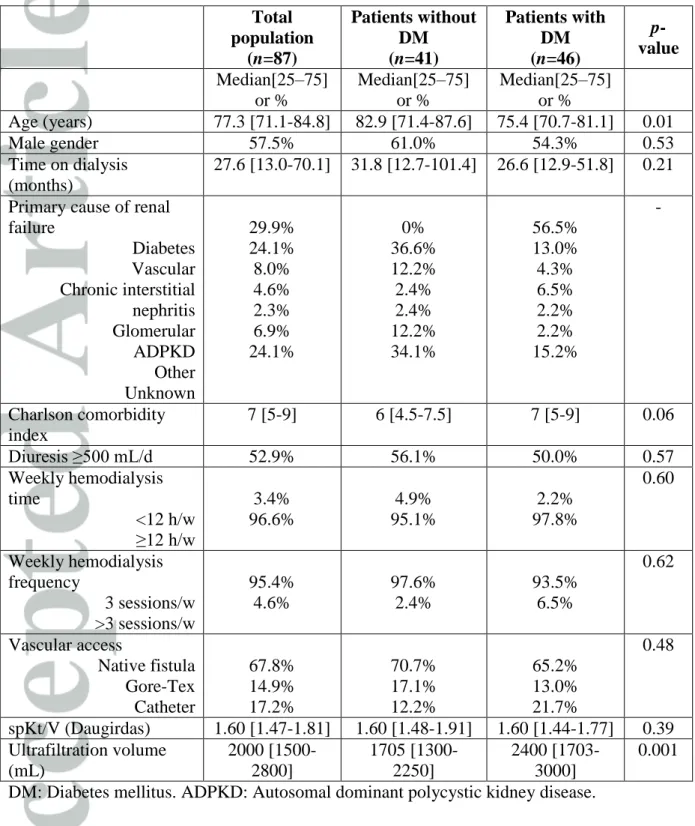
Table 1: Demographic and HD parameters of a HD population according to diabetes (n= 87 patients). DM: Diabetes mellitus. ADPKD: Autosomal dominant polycystic kidney
disease. Total population (n=87) Patients without DM (n=41) Patients with DM (n=46) p-value Median[25–75] or % Median[25–75] or % Median[25–75] or % Age (years) 77.3 [71.1-84.8] 82.9 [71.4-87.6] 75.4 [70.7-81.1] 0.01 Male gender 57.5% 61.0% 54.3% 0.53 Time on dialysis (months) 27.6 [13.0-70.1] 31.8 [12.7-101.4] 26.6 [12.9-51.8] 0.21
Primary cause of renal failure Diabetes Vascular Chronic interstitial nephritis Glomerular ADPKD Other Unknown 29.9% 24.1% 8.0% 4.6% 2.3% 6.9% 24.1% 0% 36.6% 12.2% 2.4% 2.4% 12.2% 34.1% 56.5% 13.0% 4.3% 6.5% 2.2% 2.2% 15.2% -Charlson comorbidity index 7 [5-9] 6 [4.5-7.5] 7 [5-9] 0.06 Diuresis ≥500 mL/d 52.9% 56.1% 50.0% 0.57 Weekly hemodialysis time <12 h/w ≥12 h/w 3.4% 96.6% 4.9% 95.1% 2.2% 97.8% 0.60 Weekly hemodialysis frequency 3 sessions/w >3 sessions/w 95.4% 4.6% 97.6% 2.4% 93.5% 6.5% 0.62 Vascular access Native fistula Gore-Tex Catheter 67.8% 14.9% 17.2% 70.7% 17.1% 12.2% 65.2% 13.0% 21.7% 0.48 spKt/V (Daugirdas) 1.60 [1.47-1.81] 1.60 [1.48-1.91] 1.60 [1.44-1.77] 0.39 Ultrafiltration volume (mL) 2000 [1500-2800] 1705 [1300-2250] 2400 [1703-3000] 0.001
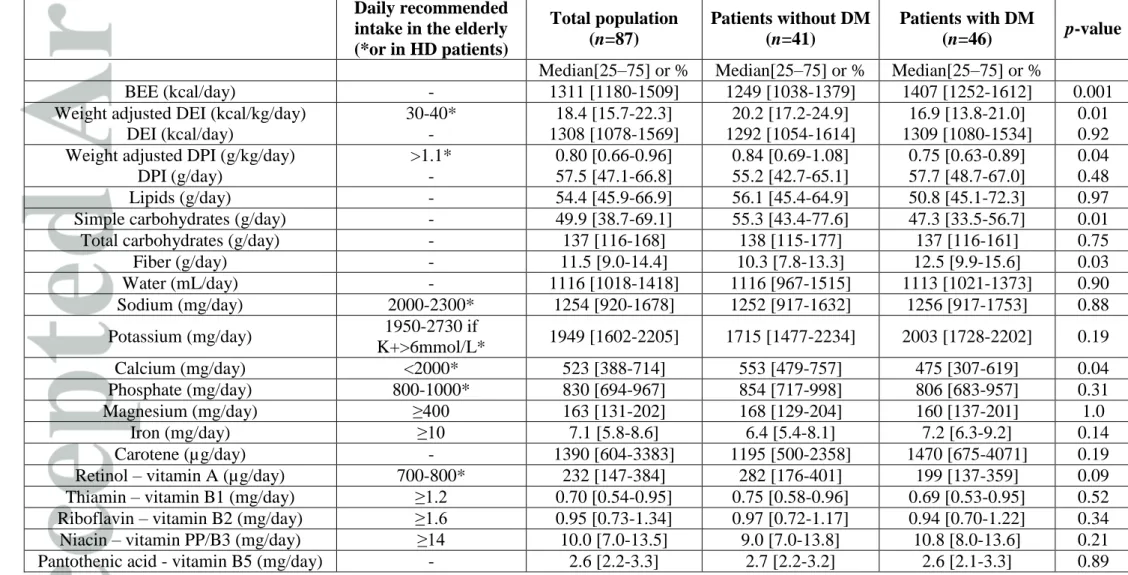
Table 2: Dietary intake evaluated by continuous 2-day dietary histories according to diabetes (n=87 patients). DM: Diabetes mellitus.
BEE: base energy expenditure. DEI: daily energy intake. DPI: daily protein intake. *Recommended daily intakes are provided for HD patients according to European Best Practice Guidelines Guideline on Nutrition [1] or from elderly populations when no HD patient-specific recommended values were available [25].
Daily recommended intake in the elderly (*or in HD patients) Total population (n=87) Patients without DM (n=41) Patients with DM (n=46) p-value
Median[25–75] or % Median[25–75] or % Median[25–75] or %
BEE (kcal/day) - 1311 [1180-1509] 1249 [1038-1379] 1407 [1252-1612] 0.001 Weight adjusted DEI (kcal/kg/day)
DEI (kcal/day) 30-40* - 18.4 [15.7-22.3] 1308 [1078-1569] 20.2 [17.2-24.9] 1292 [1054-1614] 16.9 [13.8-21.0] 1309 [1080-1534] 0.01 0.92 Weight adjusted DPI (g/kg/day)
DPI (g/day) >1.1* - 0.80 [0.66-0.96] 57.5 [47.1-66.8] 0.84 [0.69-1.08] 55.2 [42.7-65.1] 0.75 [0.63-0.89] 57.7 [48.7-67.0] 0.04 0.48 Lipids (g/day) - 54.4 [45.9-66.9] 56.1 [45.4-64.9] 50.8 [45.1-72.3] 0.97 Simple carbohydrates (g/day) - 49.9 [38.7-69.1] 55.3 [43.4-77.6] 47.3 [33.5-56.7] 0.01 Total carbohydrates (g/day) - 137 [116-168] 138 [115-177] 137 [116-161] 0.75 Fiber (g/day) - 11.5 [9.0-14.4] 10.3 [7.8-13.3] 12.5 [9.9-15.6] 0.03 Water (mL/day) - 1116 [1018-1418] 1116 [967-1515] 1113 [1021-1373] 0.90 Sodium (mg/day) 2000-2300* 1254 [920-1678] 1252 [917-1632] 1256 [917-1753] 0.88 Potassium (mg/day) 1950-2730 if K+>6mmol/L* 1949 [1602-2205] 1715 [1477-2234] 2003 [1728-2202] 0.19 Calcium (mg/day) <2000* 523 [388-714] 553 [479-757] 475 [307-619] 0.04 Phosphate (mg/day) 800-1000* 830 [694-967] 854 [717-998] 806 [683-957] 0.31 Magnesium (mg/day) ≥400 163 [131-202] 168 [129-204] 160 [137-201] 1.0 Iron (mg/day) ≥10 7.1 [5.8-8.6] 6.4 [5.4-8.1] 7.2 [6.3-9.2] 0.14 Carotene (µg/day) - 1390 [604-3383] 1195 [500-2358] 1470 [675-4071] 0.19 Retinol – vitamin A (µg/day) 700-800* 232 [147-384] 282 [176-401] 199 [137-359] 0.09 Thiamin – vitamin B1 (mg/day) ≥1.2 0.70 [0.54-0.95] 0.75 [0.58-0.96] 0.69 [0.53-0.95] 0.52 Riboflavin – vitamin B2 (mg/day) ≥1.6 0.95 [0.73-1.34] 0.97 [0.72-1.17] 0.94 [0.70-1.22] 0.34 Niacin – vitamin PP/B3 (mg/day) ≥14 10.0 [7.0-13.5] 9.0 [7.0-13.8] 10.8 [8.0-13.6] 0.21
Pyridoxine – vitamin B6 (mg/day) ≥2.2 0.92 [0.75-1.17] 0.89 [0.72-1.17] 0.95 [0.77-1.18] 0.58 Folate – vitamin B9 (µg/day) ≥350 174 [130-231] 180 [115-225] 172 [131-240] 0.85 Cobalamin – vitamin B12 (µg/day) ≥3.0 2.37 [1.23-3.84] 2.37 [1.17-3.23] 2.32 [1.37-4.14] 0.52 Vitamin C (mg/day) ≥120 50.0 [27.5-84.5] 47.0 [26.0-81.5] 52.0 [31.0-94.8] 0.43 Cholecalciferol - vitamin D (µg/day) ≥10 1.0 [0.0-1.5] 1.0 [0.3-1.5] 0.5 [0.0-2.0] 0.49 Tocopherol - vitamin E (mg/day) 20-50 6.0 [3.5-10.0] 5.5 [3.5-9.5] 6.5 [4.0-10.1] 0.40 Oral nutritional supplement prescription - 26.4% 31.7% 21.7% 0.29 DM: Diabetes mellitus. BEE: base energy expenditure. DEI: daily energy intake. DPI: daily protein intake.
*Recommended daily intakes are provided for HD patients according to European Best Practice Guidelines Guideline on Nutrition [1] or from
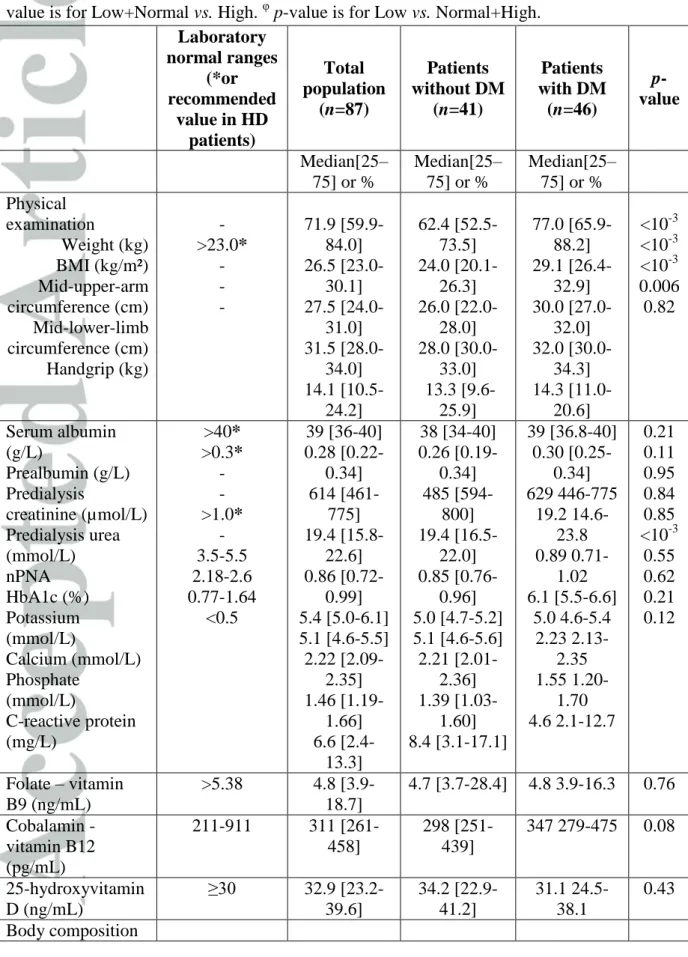
Table 3: Nutritional status according to diabetes (n= 87 patients). DM: Diabetes mellitus.
HD: hemodialysis. BMI: body-mass index. nPNA: normalized protein nitrogen appearance. BIA: bioimpedancemetry analyses. * Recommended values for hemodialysis patients are provided according to European Best Practice Guidelines Guideline on Nutrition [1]. § p-value is for Low+Normal vs. High. φ p-value is for Low vs. Normal+High.
Laboratory normal ranges (*or recommended value in HD patients) Total population (n=87) Patients without DM (n=41) Patients with DM (n=46) p-value Median[25– 75] or % Median[25– 75] or % Median[25– 75] or % Physical examination Weight (kg) BMI (kg/m²) Mid-upper-arm circumference (cm) Mid-lower-limb circumference (cm) Handgrip (kg) - >23.0* - - - 71.9 [59.9-84.0] 26.5 [23.0-30.1] 27.5 [24.0-31.0] 31.5 [28.0-34.0] 14.1 [10.5-24.2] 62.4 [52.5-73.5] 24.0 [20.1-26.3] 26.0 [22.0-28.0] 28.0 [30.0-33.0] 13.3 [9.6-25.9] 77.0 [65.9-88.2] 29.1 [26.4-32.9] 30.0 [27.0-32.0] 32.0 [30.0-34.3] 14.3 [11.0-20.6] <10-3 <10-3 <10-3 0.006 0.82 Serum albumin (g/L) Prealbumin (g/L) Predialysis creatinine (µmol/L) Predialysis urea (mmol/L) nPNA HbA1c (%) Potassium (mmol/L) Calcium (mmol/L) Phosphate (mmol/L) C-reactive protein (mg/L) >40* >0.3* - - >1.0* - 3.5-5.5 2.18-2.6 0.77-1.64 <0.5 39 [36-40] 0.28 [0.22-0.34] 614 [461-775] 19.4 [15.8-22.6] 0.86 [0.72-0.99] 5.4 [5.0-6.1] 5.1 [4.6-5.5] 2.22 [2.09-2.35] 1.46 [1.19-1.66] 6.6 [2.4-13.3] 38 [34-40] 0.26 [0.19-0.34] 485 [594-800] 19.4 [16.5-22.0] 0.85 [0.76-0.96] 5.0 [4.7-5.2] 5.1 [4.6-5.6] 2.21 [2.01-2.36] 1.39 [1.03-1.60] 8.4 [3.1-17.1] 39 [36.8-40] 0.30 [0.25-0.34] 629 446-775 19.2 14.6-23.8 0.89 0.71-1.02 6.1 [5.5-6.6] 5.0 4.6-5.4 2.23 2.13-2.35 1.55 1.20-1.70 4.6 2.1-12.7 0.21 0.11 0.95 0.84 0.85 <10-3 0.55 0.62 0.21 0.12 Folate – vitamin B9 (ng/mL) >5.38 4.8 [3.9-18.7] 4.7 [3.7-28.4] 4.8 3.9-16.3 0.76 Cobalamin - vitamin B12 (pg/mL) 211-911 311 [261-458] 298 [251-439] 347 279-475 0.08 25-hydroxyvitamin D (ng/mL) ≥30 32.9 [23.2-39.6] 34.2 [22.9-41.2] 31.1 24.5-38.1 0.43 Body composition
(BIA) Fat mass (% of body weight) Low Normal High Lean mass (% of body weight) Low Normal High 2.5% 95% 2.5% 2.5% 95% 2.5% 0% 64.0% 36.0% 36.0% 60.0% 4.0% 0% 76.5% 23.5% 29.3% 65.9% 4.9% 0% 53.7% 46.3% 44.1% 52.9% 2.9% 0.04§ 0.18 φ
DM: Diabetes mellitus. HD: hemodialysis. BMI: body-mass index. nPNA: normalized protein nitrogen appearance. BIA: bioimpedancemetry analyses.
* Recommended values for hemodialysis patients are provided according to European Best Practice Guidelines Guideline on Nutrition [1]
§
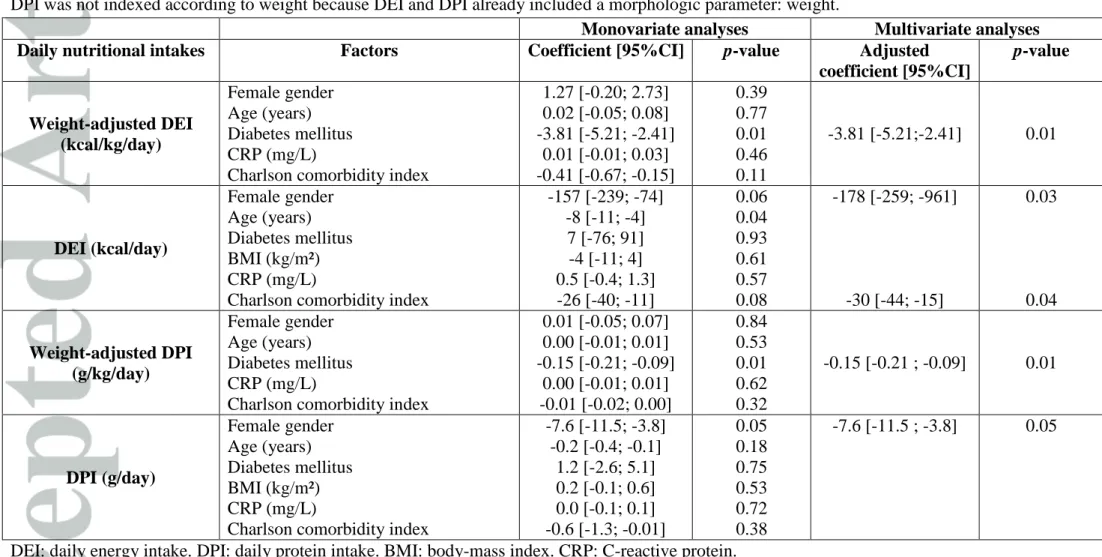
Table 4: Factors associated with daily nutritional intakes: univariate and multivariate analyses (linear regression models, n= 87 patients). DEI: daily energy intake. DPI: daily protein intake. BMI: body-mass index. CRP: C-reactive protein. BMI was analyzed only for DEI;
DPI was not indexed according to weight because DEI and DPI already included a morphologic parameter: weight.
Monovariate analyses Multivariate analyses Daily nutritional intakes Factors Coefficient [95%CI] p-value Adjusted
coefficient [95%CI] p-value Weight-adjusted DEI (kcal/kg/day) Female gender Age (years) Diabetes mellitus CRP (mg/L)
Charlson comorbidity index
1.27 [-0.20; 2.73] 0.02 [-0.05; 0.08] -3.81 [-5.21; -2.41] 0.01 [-0.01; 0.03] -0.41 [-0.67; -0.15] 0.39 0.77 0.01 0.46 0.11 -3.81 [-5.21;-2.41] 0.01 DEI (kcal/day) Female gender Age (years) Diabetes mellitus BMI (kg/m²) CRP (mg/L)
Charlson comorbidity index
-157 [-239; -74] -8 [-11; -4] 7 [-76; 91] -4 [-11; 4] 0.5 [-0.4; 1.3] -26 [-40; -11] 0.06 0.04 0.93 0.61 0.57 0.08 -178 [-259; -961] -30 [-44; -15] 0.03 0.04 Weight-adjusted DPI (g/kg/day) Female gender Age (years) Diabetes mellitus CRP (mg/L)
Charlson comorbidity index
0.01 [-0.05; 0.07] 0.00 [-0.01; 0.01] -0.15 [-0.21; -0.09] 0.00 [-0.01; 0.01] -0.01 [-0.02; 0.00] 0.84 0.53 0.01 0.62 0.32 -0.15 [-0.21 ; -0.09] 0.01 DPI (g/day) Female gender Age (years) Diabetes mellitus BMI (kg/m²) CRP (mg/L)
Charlson comorbidity index
-7.6 [-11.5; -3.8] -0.2 [-0.4; -0.1] 1.2 [-2.6; 5.1] 0.2 [-0.1; 0.6] 0.0 [-0.1; 0.1] -0.6 [-1.3; -0.01] 0.05 0.18 0.75 0.53 0.72 0.38 -7.6 [-11.5 ; -3.8] 0.05
DEI: daily energy intake. DPI: daily protein intake. BMI: body-mass index. CRP: C-reactive protein.
Table 5: Factors associated with serum albumin (g/L): univariate and multivariate analyses (linear regression model, n=87 patients). BMI: body-mass index. DEI: daily
energy intake. DPI: daily protein intake. nPNA: normalized protein nitrogen appearance.
Coefficient [95%CI] p-value
Monovariate analyses
Age (years) Female gender Diabetes mellitus BMI (kg/m²)
Weight-adjusted DEI (kcal/kg/day) DEI (kcal/day)
Weight-adjusted DPI (kg/day) DPI (g/day) nPNA (g/day) C-reactive protein (mg/L) -0.02 [-0.06; 0.02] -0.86 [-1.77; 0.06] 1.69 [0.18; 2.58] 0.29 [0.21; 0.36] -0.15 [-0.21; -0.08] 0.001 [0.00; 0.002] -1.79 [-3.40; -0.17] 0.04 [0.01; 0.06] 4.26 [2.05; 6.47] -0.03 [-0.04; -0.02] 0.57 0.35 0.06 <10-3 0.03 0.48 0.27 0.13 0.06 <10-3 Multivariate analyses BMI (kg/m²) C-reactive protein (mg/L) 0.24 [0.17; 0.31] -0.05 [-0.07; -0.03] 0.001 0.002
BMI: body-mass index. DEI: daily energy intake. DPI: daily protein intake. nPNA: