HAL Id: hal-03098552
https://hal.archives-ouvertes.fr/hal-03098552
Submitted on 5 Jan 2021HAL is a multi-disciplinary open access archive for the deposit and dissemination of sci-entific research documents, whether they are pub-lished or not. The documents may come from teaching and research institutions in France or abroad, or from public or private research centers.
L’archive ouverte pluridisciplinaire HAL, est destinée au dépôt et à la diffusion de documents scientifiques de niveau recherche, publiés ou non, émanant des établissements d’enseignement et de recherche français ou étrangers, des laboratoires publics ou privés.
Rational Design of Fractal Gold Nanosphere Assemblies
with Optimized Photothermal Conversion using
Quantitative Structure Property Relationship (QSPR)
Approach
Florence Gazeau
To cite this version:
Florence Gazeau. Rational Design of Fractal Gold Nanosphere Assemblies with Optimized Photothermal Conversion using Quantitative Structure Property Relationship (QSPR) Approach. Journal of Physical Chemistry C, American Chemical Society, 2020, 124 (16), pp.8938-8948. �10.1021/acs.jpcc.0c00384�. �hal-03098552�
Rational Design of Fractal Gold Nanosphere
Assemblies with Optimized Photothermal
Conversion using Quantitative Structure
Property Relationship (QSPR) Approach
Alice Balfourier,
†Vladimir Mulens-Arias,
†,‡Florence Gazeau,
∗,†and Florent Carn
∗,††Université de Paris, Laboratoire Matière et Systèmes Complexes (MSC), CNRS, 10 rue Alice Domon et Léonie Duquet, Paris 75205 Cedex 13, France
‡Current address: National Center for Biotechnology, Darwin 3, Campus Cantoblanco, Madrid, 28049, Spain
E-mail: florence.gazeau@univ-paris-diderot.fr; florent.carn@univ-paris-diderot.fr Phone: +33 1 57 27 62 03
Abstract
Assemblies of plasmonic nanoparticles have been proposed for various applications, including photothermal therapy, exploiting surface plasmon coupling phenomena. How-ever, the rational design of fractal nanoparticle assembly remains challenging due to the lack of structural characterizations and modelization of real systems. Here we used quantitative structure property relationship (QSPR), driven by experimental data and statistical analysis, to establish a relationship between structural descriptors of fractal gold nanoparticle (GNP) aggregates and their light-to-heat conversion. 160 assemblies of various size spherical GNP with different polyelectrolyte chains were synthesized,
which differ in their global charge, size, mass fractal dimension and plasmonic proper-ties. 15 independent descriptors of structure and properties were extracted and further analyzed by QSPR. Principal component analysis and multilinear regression reveal that light-to-heat conversion is mainly governed by the structure of the aggregates and not by the characteristics of the building blocks. This highlights the key role of the fractal dimension of the aggregate and of the ratio of GNP/polyelectrolyte mass to optimize photothermal effects. Rational criteria to optimize light-to-heat conversion within non-ideal fractal assemblies of GNP were identified, relaxing on the choice of other parameters, such as GNP or aggregate size, that can be adapted to the desired biomedical applications.
Introduction
Nanoparticles assemblies have emerged in the last years as a robust and promising strategy to modulate nanoparticles physical properties.1–5 The emerging collective behaviors of self-assemblies have already proved their potential in the biomedical fields with applications for biosensing,6,7 surface enhanced Raman spectroscopy (SERS),8,9 drug delivery,10 magnetic resonance imaging (MRI)11,12or photothermal therapy (PTT).13–17Nanoparticles assemblies are most often directed by DLVO (Derjaguin-Landau-Verwey-Overbeek) interactions and embrace a wide variety of mono or polydisperse, isotropic or anisotropic structures, that could be highly organized or randomly arranged.18 However, despite the great versatility of nanoparticle assemblies, such systems are still hard to optimize for a desired application. Indeed, the multi-parametric relationship between a complex architecture and one resulting physical property can hardly be predicted by analytical approaches, which make difficult to optimize assembly structures.19,20
In many fields, the rationalization of structure-properties relationships for complex ob-jects has been a huge step to predict new efficient obob-jects, for example in drug design.21,22One of these rational approaches, called quantitative structure property relationship (QSPR), or
its biological variant quantitative structure activity relationship (QSAR), is based on statis-tical modeling and aims to build a mathemastatis-tical relationship between the features of diverse objects (molecules, polymers, crystals, nanoparticles, fluids) and a biological activity (inter-actions with a substrate, cytotoxicity), a chemical reactivity or a physical property.23–25This methodology presents the advantage to be driven by experimental data and computer cal-culation, limiting the bias due to human analysis or the assumptions inherent to theoretical approaches. On the other side, it requires robust and unbiased descriptors, and a large num-ber of samples. Such computational approaches have the potential to improve fit-for-purpose assemblies of nanoparticles, as it can address multiparametric complex questions.
Here we chose to challenge this strategy for a rational design of gold nanoparticles (GNPs) aggregates optimized for photothermal therapy. When closely assembled, the localized sur-face plasmon resonance (LSPR) of adjacent GNPs are coupled, which induces a longitudinal plasmon at higher wavelengths than the initial transversal plasmon. This longitudinal plas-mon is of great importance because it could reach the first tissue transparency window in the near infrared range (NIR1, 650 to 900 nm).26 Hence, plasmon coupling could enable to use GNPs of small sizes in diverse biomedical applications and activate them in the NIR1 window. GNPs aggregates have been proposed for photothermal therapy or photoacoustic imaging with a proven efficiency but without any control or study of the aggregate struc-ture.13–16
The relationship between the GNP aggregate structure and their plasmonic properties have been studied theoretically using analytic approach. Khlebtsov et al. highlighted the importance of the interparticle distance, the presence of short linear chain fragments and
the number of particles embedded in the aggregate.27 However, the consistency between
theoretical and experimental results has been assessed on ideal and monodisperse nanometric aggregates that could not be synthesized in water with biocompatible components and with a scalable protocol. On the contrary, non ideal aggregates have not been subjected to comparison between analytic prediction and experimental observation.
Nanoparticle aggregation also occurred upon cellular internalization of GNPs: GNPs se-questration in the cell lysosomes modify their initial optical properties, increasing or decreas-ing their therapeutic effects.28 Understanding the structure-heating properties relationship of complex GNPs aggregates is thus of fundamental interest to design therapeutic agents that do not lose their potential in biological media or after sequestration in cells.
Here we propose QSPR regression model to establish a quantitative relationship between the experimentally accessible descriptors of plasmonic aggregate structure and their opti-cal and photothermal properties. Nanoparticle aggregation was trigerred by electrostatic complexation between citrate-coated GNPs (< 30 nm) and oppositely-charged long poly-electrolytes chains. This versatile approach enables to obtain GNPs assemblies on a wide range of size, mass fractal dimension and inner structure by a simple mixing strategy.29
GNPs aggregates were characterized by dynamic light scattering (DLS), laser Doppler electrophoresis (LDE), small angle X-ray scattering (SAXS), cryo-transmission electron mi-croscopy (cryo TEM), UV visible spectroscopy and photothermal measurements, providing a set of descriptors such as the size, charge, fractal structure, inter-particle distances, op-tical and heating properties of the aggregates at different times after synthesis. In total, 18 descriptors were extracted from these measurements and gathered in a single database compatible with QSPR tools, including data visualisation by principal component analysis and statistical model construction (Scheme 1). These combined experimental and computa-tional approaches allowed us to conclude on an optimized configuration of GNPs aggregates for photothermal therapy. It gives an example on how QSPR methodology can be usefull to optimize nanoparticle assemblies to optimize a given physico-chemical property.
Citrate stabilized gold NPs 3 < D < 30 nm Size ? Fractal dimension ? Optical properties ? Heating properties ? Dataset construction Data exploration
Polyelectrolyte with positively charged amine groups
300 < Mw < 750 kDa
ChitosanLinear Branched Polyethylenimine Chitosan
Various aggregate structure Aggregation
Structur
e Properti
es
Curve fitting and descriptors extraction
Fitted values
Rea
l value
s
- External validation with test dataset
Choice of the appropriate structure
Y = Y0+ Xα + ε
Polynomial terms?
Stepwise regression Principal Component Analysis
k-means clustering O H O NH+3 O OH n NH+ NH+ 3 NH+ 2 NH+ NH+ 2 NH+ 3 NH+ NH+ N+ H3 NH+3 NH+ 2 n Model construction s
Validation of the model
Predictability?
Scheme 1: Scheme of the experimental and computational approaches combined in the present study.
Results and discussion
Construction of a Dataset to Describe Gold Nanoparticles
Polyelec-trolyte Self-Assembly
Three sizes of citrate-coated, monodisperse and well-dispersed gold nanospheres were syn-thesized using Turkevich inspired protocols (D = 3, 13, 30 nm) (Supplementary Figure
S1).30,31Three biocompatible polyelectrolytes (chitosan 300 kDa, chitosan 700 kDa, branched
poly(ethylenimine) (PEI) 750 kDa) were diluted in acidic medium to ensure their protona-tion ([HCl] = 10-3). Then, GNPs aggregates were synthetized by an equivolumic mix of the GNPs suspension and the polymer solution. Six concentration ratio were tested for each se-ries, in which the concentration of atomic gold was fixed to 16.4 mg/L and the concentration of polyelectrolyte was varied between 3 × 10⁻⁵ to 10-2 g/L (i.e. polyelectrolyte/gold mass ratio between 0.0018 and 0.6). Thereafter, the aggregates were characterized 5 minutes and 24 hours after the mixing of GNPs and polyelectrolytes. The long time (i.e. 24h) was the first studied to ensure the stability of the structure of the objects under scrutiny but we realized that, regardless of their structural stability, aggregates of gold particles sediment due to their density, even for small aggregation number when the particles are large. We then carried out a second series of measurements at short times (i.e. 5 min) in order to have sufficiently concentrated suspensions and to take into account the photothermal properties of the largest structural variety of aggregates. We point out that for the aggregates with the highest global charge the sedimentation kinetics are not perceptible before 30 min whereas the aggregates are formed in less than 1 second. The data obtained at long times have nevertheless been kept to contribute to the wide range of behaviors embraced in this study.
First, the charge and size of the formed aggregates were estimated using their elec-trophoretic mobility (EM) and DLS relaxation times, respectively. DLS correlograms dis-played in some samples a double relaxation process, indicating that two populations of objects can coexist. Accordingly, DLS correlograms were thus fitted with a mono or
bi-exponential fit, to obtain the relaxation times DLSt1 and DLSt2 (with DLSt2 > DLSt1),
and their relative amplitude, DLSA1 and DLSA2 (Figure S2A). Indicative hydrodynamic
size could be extrapolated from the relaxation time measurements, but should be taken with caution due to the presence of quickly sedimenting large aggregates (i.e. R > 500 nm).
SAXS was performed to assess the fractal structure of the aggregates. At the higher q values, we always observed the sphere form factor of individual GNP building blocks, corresponding to the TEM size. At the lower q values, the curves show a power law shape, observed on at least one q decade, that enable us to extract the fractal dimension, F D, of the assembly (Figure S2B). The fractal dimension in question is the mass fractal dimension describing the spatial distribution of the mass within the aggregates. For an aggregate composed of particles of mass m0, and size r0, the mass of the aggregate m, scales with
its radius r, measured from any site within the fractal structure, as m(r) ∝ m0(rr0)FD. In
other words, FD characterizes the ramification of the cluster and varies between F D ∼ 1 for one dimensional clusters and F D ∼ 2.9 for three dimensional compact clusters. SAXS did not give us access to the size of the aggregates, as no Guinier regime was observed at low q values.
The distance between the GNPs inside the aggregates was investigated by cryo-TEM in some chosen aggregates that were close to the charge neutrality ratio. The interparticle distance is known to be a key parameter to predict the optical properties of GNP aggregates, as plasmon coupling is only effective under really short distances.27,32
In addition to the structural characterization of GNP aggregates, their optical proper-ties were investigated. UV visible extinction spectra display one or two plasmon bands, corresponding to the longitudinal and transversal plasmon. To isolate the plasmon band features, the spectra were treated to remove the baseline of the signal, that was calculated thanks to the spectrum of the single GNPs (Figure S2C). Then, the corrected signal was fitted with one or two Gaussian centered on the mean wavelengths UV vism1, UV vism2(with U V vism2 > U V vism1), with a width UV visw1,w2 and amplitude UV visA1,A2, thus providing
three to six new descriptors. As the influence of scattering effects strongly increases with the size of the aggregates, it could lead to an over-estimation of the amplitude descriptors.33 Finally, photothermal measurements were performed using a 680 nm laser excitation
with a power of 6.3 W.cm-2 at a 4 cm distance from the sample surface. The temperature
of the sample (V = 100 µL) was monitored with an infrared thermal camera during the 5 minutes of irradiation, until the temperature reaches a plateau. To quantify the heating capacity of the sample, the specific absorption rate (SAR) was deduced from the initial slope of temperature increase, dT
dt, during the first seconds of irradiation, normalized by the
ratio between the gold mass concentration (Cm = 16.4 mg.L-1) and the heat capacity of
water (Cp = 4185 J.L-1.K-1 - Figure S2D). SAR measurements are reliable evaluation of
heating efficiency because the initial slope of the temperature increase weakly depends on thermal exchange with the environment and thus on the particular experimental set up. Being also normalized by the mass of materials, it provides a valuable metric to compare heating efficiency of different nanostructures.
All these measurements were then used as descriptors for the aggregates, in addition to the following synthesis parameters: the GNPs diameter (DiamNP s), the average molar mass (MassP oly) and the charge density (ChargeP oly) of the polyelectrolyte, the ratio of polyelectrolyte over gold mass concentration (RatioP olyGold) and finally the time after mixing (T ime). In total, our database includes 54 types of aggregates observed at two times, plus the three sizes of GNPs building blocks: it represents 111 samples described by 18 descriptors, as summarized in Table 1. This screening of a large number of aggregates enable us to establish physico-chemical relation between series obtained with a given GNP size and polyelectrolyte.
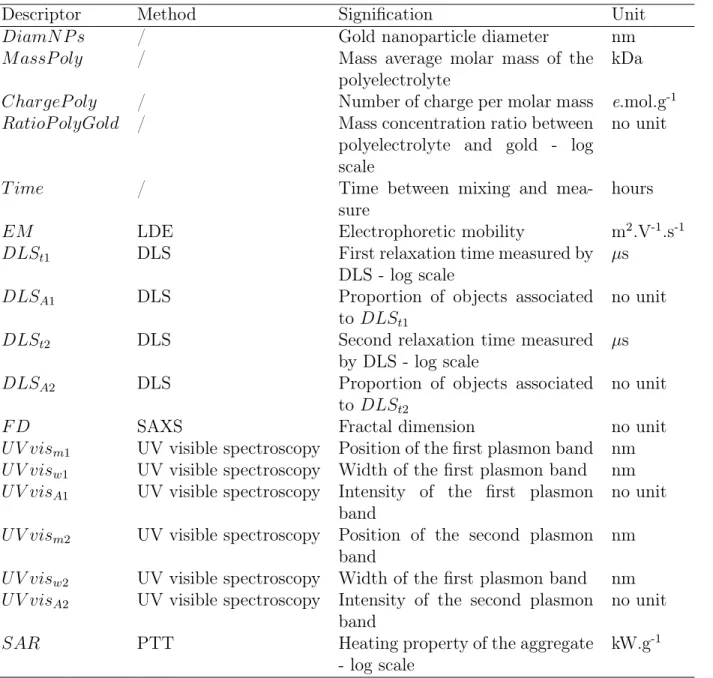
Table 1: Summary of the descriptors of GNP aggregates.
Descriptor Method Signification Unit
DiamN P s / Gold nanoparticle diameter nm
M assP oly / Mass average molar mass of the
polyelectrolyte kDa
ChargeP oly / Number of charge per molar mass e.mol.g-1
RatioP olyGold / Mass concentration ratio between
polyelectrolyte and gold - log scale
no unit
T ime / Time between mixing and
mea-sure hours
EM LDE Electrophoretic mobility m2.V-1.s-1
DLSt1 DLS First relaxation time measured by
DLS - log scale
µs
DLSA1 DLS Proportion of objects associated
to DLSt1
no unit
DLSt2 DLS Second relaxation time measured
by DLS - log scale
µs
DLSA2 DLS Proportion of objects associated
to DLSt2
no unit
F D SAXS Fractal dimension no unit
U V vism1 UV visible spectroscopy Position of the first plasmon band nm
U V visw1 UV visible spectroscopy Width of the first plasmon band nm
U V visA1 UV visible spectroscopy Intensity of the first plasmon
band no unit
U V vism2 UV visible spectroscopy Position of the second plasmon
band nm
U V visw2 UV visible spectroscopy Width of the first plasmon band nm
U V visA2 UV visible spectroscopy Intensity of the second plasmon
band no unit
SAR PTT Heating property of the aggregate
- log scale kW.g
Physicochemical Behavior of Gold Nanoparticle Aggregates and their
Properties
Analyses of each serie of data obtained five minutes after mixing reveal a common behaviour when varying the polyelectrolyte/gold mass ratio over three orders of magnitude, regardless of the GNP size and the polyelectrolytes nature (Figures S3 to S10). Figure 1 displays a case study obtained by mixing 30 nm GNPs and 300 kDa chitosan.
Briefly, the formed GNP assemblies change from negative to positive global charge (-0.03 to + 0.01 mm2.V-1.s-1) when increasing the polyelectrolyte/gold concentration ratio, and cross the neutrality at concentration ratio between 6 × 10⁻³ and 60 × 10-3, depending on the serie (Figure 1A). Neutral and weakly-charged aggregates display the highest size and compactness (highest DLS relaxation time DLSt1and fractal dimension F D - Figure 1B and C). However, the neutrality point does not systematically yield the maximum value for these descriptors . On the opposite, in large excess of GNPs or of polymers (mass ratio below 1.8 × 10⁻³ or above 180 × 10-3), GNPs aggregates have higher charges and their structural features are closer to single GNPs.
Close to the neutrality point, the aggregation is very fast (less than 1 minute) and shows a quick color change of the solution. Over time, these aggregates tend to coalesce to form larger aggregates that sediment, and the sample is fully destabilized after 24 hours. For these samples, a second DLS relaxation time (DLSt2) is observed between 20 and 800 ms, confirming the presence of large aggregates. On the opposite, an excess of charge slows down the aggregation process and the color changes only after several hours, concomitent with an increase of the aggregate size (Figure S11).
Cryo TEM observations performed close to the neutrality ratio validates that all observed GNPs are embedded into an aggregate, and depict a branched structure compatible with SAXS measurements (Figure 1D). Inside the aggregates, interparticle distances are generally below 3 nm, but in some cases (less than 5 %), it can reach up to 15 nm. The observation of a low-contrast bridge between the GNPs, probably due to the polyelectrolyte, suggests
LDE Electrophoretic mobility (m m 2.V − 1.s − 1) ● ● ● ● ● ● ● 0 1.8 6 18 60 180 600 −0.05 −0.04 −0.03 −0.02 −0.01 0 0.01 0.02
Polyelectrolyte/Gold Mass Ratio (x10−3) CryoTEM
A
DLS Relaxation time (µs) ● ● ● ● ● ● ● 0 1.8 6 18 60 180 600 20 50 100 200 500 1000 2000 5000 10 20 50 100 200 500 1000 2000 Hydrodynamic diameter (nm)Polyelectrolyte/Gold Mass Ratio (x10−3)
B
SAXS Fr actal dimension ● ● ● ● ● ● ● 0 1.8 6 18 60 180 600 0.0 0.5 1.0 1.5 2.0 2.5 3.0Polyelectrolyte/Gold Mass Ratio (x10−3)
C
D
100 nm Cryo TEM UV visible spectroscopy Optical e xtinction 400 500 600 700 800 0.00 0.02 0.04 0.06 0.08 0.10 0.12 0.14 0.16 Wavelength (nm) Laser wavelength Polyelectrolyte/Gold Mass Ratio (x10−3)0 600
E
PTT SAR (kW/g) ● ● ● ● ● ● ● 0 1.8 6 18 60 180 600 5 10 20 50 100 200Polyelectrolyte/Gold Mass Ratio (x10−3)
F
Chitosan 300 kDa − NPs 30nm
Figure 1: Characterizations of the GNP aggregates obtained 5 minutes after mixing for one size of GNPs (D = 30 nm) and one type of polyelectrolyte (chitosan 300 kDa) at varying concentration ratio: electrophoretic mobility (A) and diffusion relaxation time DLSt1 (B) obtained through LDE and DLS measurements respectively, fractal dimension (C) deduced from SAXS measurements. Cryo-TEM (D) was performed for the sample that was the closer to the neutrality ratio (see arrow on A). Optical extinction (E) and SAR (F) were measured respectively by UV visible spectroscopy and photothermal measurements (λ = 680 nm, 6.3 W.cm-2).
that GNPs are enclosed in a single aggregate (Figure S12). However, in the large majority of cases, GNPs are close enough to share plasmon resonance oscillations.
This plasmon coupling is reflected in UV visible spectra by the decrease in intensity of the plasmon band of the single NPs around 525 nm and the appearance of a second plasmon band between 580 and 800 nm (Figure 1E). The latter indicates that adjacent GNPs share longitudinal plasmon resonance, in addition to the transversal plasmon resonance observed at 525 nm. This second plasmon band results in an absorption increase at the laser wavelength (i.e. 680 nm) for all samples, including the ones that have a second plasmon band centered on 580 nm. Due to absorption increase, the resulting heating efficiency, that is measured as a SAR, increases from 20 kW.g-1for single GNPs to range from 50 to 150 kW.g-1for neutral
or weakly charged aggregates (Figure 1F).
Overall, the measurements performed 5 minutes after the synthesis describe a variety of aggregates from nanometric to micrometric size (roughly 20 to 2000 nm), with fractal dimension between 1 and 2.8, that present collective plasmon peak in the visible to near infrared range (up to 770 nm). When observed after 24 hours, some samples tend to form larger aggregates with time. A general phenomenological behavior could be observed for most of the series, revealing a maximum size, compactness and heating efficiency of neutral and weakly-charged aggregates, and some differences into the aggregation kinetics as function of the aggregates charges. However, some interesting variations could also be observed between series. Some descriptors tend to reach a plateau in some series (Figure 1C and F), while others reach a peak (Figure 1B). However in other series, descriptors have completely different behaviors (e.g. Figure S6B, C and F). Hence, data analysis by this empirical approach does not provide access to fine effects due to the structural variations between the wide range of samples.
Statistical tools are thus required in order to refine our understanding of the struc-ture/heating properties relationship. Data mining of this large dataset was performed using principal component analysis in order to identify the source of variance between samples.
Then, multilinear regression was used to build a predicting model that can link the heating properties of each sample to its conditions of synthesis and structure. As these computa-tional approaches are not commonly used in the nanotechnology field, brief mathematical description can be found in supplementary information.
Dataset Exploration by Principal Component Analysis
The experimental dataset was first explored by principal component analysis (PCA). As the
descriptors RatioP olyGold, DLSt1, DLSt2 and SAR have values on several decades, the
logarithmic values were calculated for these descriptors. Redundant descriptors were first identified by calculating Pearson’s correlation between each pair of descriptors (Figure S13). Four descriptors (DLSA1, DLSA2, UV visw1 and UV visw2) were suppressed from the dataset before further analysis as they present redundancies with other descriptors (see Supporting Information).
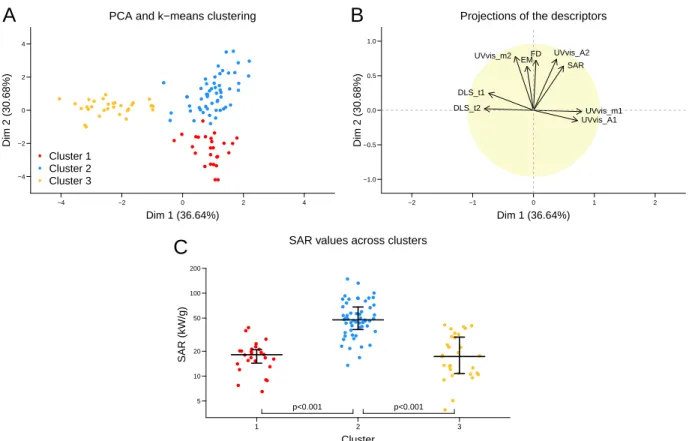
To discriminate the different types of samples, PCA was performed using the remain-ing descriptors as input. The first two dimensions, that represents 67.3 % of the variance together, clearly reveals three types of behaviors. The latter were extracted by k-means clustering, and noted cluster 1 to 3 (Figure 2A). Interestingly, the second cluster is oriented along the second plasmon resonance intensity (UV visA2) and the heating efficiency SAR (Figure 2B). This suggests better heating properties than the two other clusters, which is confirmed by Figure 2C, showing the heating efficiency SAR for the different clusters.
The features of this second cluster are hardly correlated with the synthesis descriptors (GNPs diameter, type of polymer, polyelectrolyte/gold concentration ratio or time - Figure S14), indicating that the aggregates included in the second cluster differ mostly by their structure. A systematic comparison of the initial data enables us to associate the clustering to three main distinct structures/properties behaviors (Figure S15):
● ● ● ● ● ● ● ● ● ● ● ● ● ● ● ● ● ● ● ● ● ● ● ● ● ● ● ● ● ● ● ● ● ● ● ● ● ● ● ● ● ● ● ● ● ● ● ● ● ● ● ● ● ● ● ● ● ● ● ● ● ● ● ● ● ● ● ● ● ●● ● ● ● ● ● ● ● ● ● ● ● ● ● ● ● ● ● ● ● ● ● ● ● ● ● ● ● ● ● ● ● ● ● ● ● ● ● ● ● ●
PCA and k−means clustering
Dim 1 (36.64%) Dim 2 (30.68%) −4 −2 0 2 4 −4 −2 0 2 4 ● ● ● Cluster 1 Cluster 2 Cluster 3
A
Projections of the descriptorsDim 1 (36.64%) Dim 2 (30.68%) −2 −1 0 1 2 −1.0 −0.5 0.0 0.5 1.0 EM DLS_t1 DLS_t2 UVvis_m1 UVvis_A1 UVvis_m2 FD UVvis_A2 SAR
B
SAR values across clusters
Cluster SAR (kW/g) ● ● ● ● ● ● ● ● ● ● ● ● ● ● ● ● ● ● ● ● ● ● ● ● ● ● ● ● ● ● ● ● ● ●●● ● ● ● ● ● ● ● ● ● ● ● ● ● ● ● ● ● ● ●● ● ● ● ● ● ● ● ● ● ● ● ● ● ● ● ● ● ● ● ● ● ● ● ● ● ● ● ● ●● ● ● ● ● ● ● ● ● ● ● ● ● ● ● ● ● ● ● ● ● ● ● ● ● ● 1 2 3 5 10 20 50 100 200 p<0.001 p<0.001
C
Figure 2: Principal Component Analysis (PCA) and k-means clustering reveal the existence of three behaviours among samples (A). Correlation between descriptors and the two first principal components (B). SAR across clusters (C).
• Cluster 2: The aggregates sizes are higher than in cluster 1, but no second relaxation
time is observed (DLSt2 = 0). UV visible spectra show two distinct plasmon bands
(UV visA1 and UV visA2 6= 0).
• Cluster 3: The aggregates display two relaxation times (DLSt2 6= 0). UV visible
spectra exhibit a low plasmon band between 600 and 800 nm, but no plasmon band around 525 nm (UV vism1 and UV visA1= 0).
These three behaviors show that there is an optimum state of aggregation (cluster 2) that lies between the single GNPs behavior (cluster 1) and aggregates of micrometric size (cluster 3) to optimize the SAR. However, this observation does not provide numerical criteria for this intermediate state, which requires the construction of a model.
Construction of the Heating Efficiency Predicting Model
We then build a predicting model in order to link the structure and synthesis descriptors to the heating efficiency of GNP aggregates. The input data were limited to the 5 minutes time point, as no measurement was done on the fractal dimension for the 24 hours time point. The training dataset of the model thus consists of 54 samples, 7 input descriptors
(DiamNP s, MassP oly, ChargeP oly, EM, RatioP olyGold, DLSt1, DF ), and the output
descriptor SAR.
Statistical modeling relies on a chosen mathematical expression in which parameters are optimized in order to fit a training dataset with the highest determination coefficient (R2 > 0.7 to validate the model). Here we started from a simple multilinear model, that has the advantages to be both robust and easy to interpret. We performed a stepwise selection of descriptors in order to limit the number of descriptors that appears into the model. This approach consists in a successive elimination and addition of descriptors so that the suppression of a descriptor dramatically decreases the model quality, or reciprocally the addition of a new descriptor does not improve the model significantly. More precisely,
the model is chosen in order to minimize the Bayesian information criterion (BIC), which formula in detailed in the supporting information.
Our first multilinear regression shows a low determination coefficient (R2
train = 0.62
before stepwise regression, R2
train+step = 0.57 after stepwise regression), which underlines
the need for a more flexible model. Thus, we add quadratic terms for the parameters that
could take more than three values (RatioP olyGold, EM, DLSt1, DF ). As a consequence,
the determination coefficient increases up to R2
train = 0.87 before the descriptor selection
and R2
train+step = 0.80 after (Figure 3 - orange squares). Descriptors selection assumes that
linear and quadratic terms are independent variables, to ensure that the descriptors that appear on both forms will not predominate. Additional testing, such as the normality of the residual distribution, and their distribution through conditions, confirms the mathematical validity of the model (Figure S16 and S17). As this model bridges both the advantages of the multilinear model and a flexibility adapted to the dataset, it is selected as the working model.
Once the model has been built, its robustness and its predictability have been evaluated. Indeed, models can over-adapt to the training dataset, which decreases its predicability. To avoid this effect, two distinct tests have been performed: first an internal validation of the model using cross validation. Briefly, the parameters of the model of the model is estimated on half of the dataset and its predictability is assessed on the other half of the dataset. We obtain with this methods R2
CV = 0.67, which prove that the model is robust even on a limited
number of sample. Secondly,to be considered as robust and predictive, statistical model must reach a determination coefficient R2
test higher than 0.6 on the validation dataset.34
For this purpose, a validation dataset was constructed, containing aggregates obtained with two new GNP sizes (diameter of 9 and 20 nm - Figure S18) mixed with either the three polyelectrolytes used for the training dataset, or a new one, polydiallyldimethylammonium chloride (PDADMAC, Mw = 400 kDa). The mixing was made at the same concentration ratios as the training dataset, and the characterizations on size and fractal dimension were
made 5 minutes after mixing. This validation dataset contains 48 samples. We underline that the validation dataset should display descriptors values in the same range than the training dataset: same descriptor distribution, GNPs diameter between 3 and 30 nm, polyelectrolyte mass between 300 and 750 kDa, polyelectrolyte charge density between - 6.2 × 10⁻³ and -24.7 × 10⁻³ e.mol.g-1 (Figure S19).
The correlation coefficient calculated on the validation dataset was R2
valid = 0.64 (Figure
3 - blue triangles), and present equal residues distribution though conditions (Figure S20). . Thus, our model pass all the validity checks on the mathematical constraints to model predictive values, and could be studied more closely from a physico-chemical point of view.
Fitted values for SAR (kW/g)
Real v alues f or SAR (kW/g) 5 10 20 50 100 200 5 10 20 50 100 200 R²(training) = 0.80 R²(validation) = 0.64 ● Training dataset Validation dataset
Figure 3: Fitted values vs observed values for the SAR for the training (orange squares) and validation dataset (blue triangle). Red dotted line indicates the ideal case. R2 is the correlation coefficient.
Polyelectrolyte/Gold Concentration Ratio and Fractal Dimension of
the Aggregates are the Key Parameters for Specific Absorption Rate
Optimization
The descriptors that remain into the model after descriptor selection by the stepwise algo-rithm are the GNPs diameter (DiamNP s), the polymer charge (ChargeP oly), the polyelec-trolyte on gold concentration ratio (RatioP olyGold and RatioP olyGold2), and the fractal dimension (F D and F D2) (Table S1). To evaluate their respective weight in the model, each term was sequentially suppressed and the resulting determination coefficient was calculated on the validation dataset (Figure 4). It reveals that the polyelectrolyte/gold concentration ratio and the fractal dimension play major roles in the model, while the polymer charge and the GNP diameter have a minor weight.
R²(v alidation) 0.0 0.2 0.4 0.6 0.8 Full model − RatioP olyGold − FD − ChargeP oly − DiamNPs 0.64 0.41 0.45 0.60 0.61
Figure 4: Estimation of the parameters weight in the validation dataset. Calculations were performed by calculating the parameters values on the training dataset, and then by an estimation of the determination coefficient on the validation dataset.
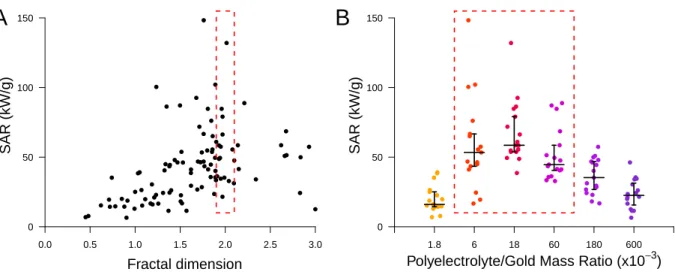
Moreover, the two most impacting parameters appear as second degree polynomial in the model, that present optimum values of DF = 2 for the fractal dimension and RatioP olyGold = 25.10−3 for the concentration ratio between the two building blocks. The validity of this pre-diction is consistent with the observed evolution of SAR with these two parameters (Figure
5 A and B). In addition, the optimized concentration ratio calculated by the model is close to the neutrality ratio for all series (Figures 1 and S3 to S10). As the concentration ratio could be related to the interparticle distance, this descriptor could account for this lacking structural parameter.35
The results concerning the fractal dimension appear to be compatible with a previous study on gold nanoparticles assemblies published by Mulens-Arias et al.17The authors show these assemblies, that were synthesized by direct nucleation of gold onto a PEI chain, present an increase of their photothermal properties when fractal dimension evolve from 1 to 1.9 ac-cording to SAXS measurements, which strengthen our results. Furthermore, this study evi-dences the potential of these assemblies for photothermal therapy and photoacoustic imaging in vitro and in vivo, which highlights the biomedical potential of such objects.
While the conditions of synthesis and the fractal dimension of the aggregates clearly play a role in the model, on the contrary, the building blocks properties are minor or absent. The polymer mass does not appear in the model, while the polymer charge and the nanoparticle diameter play minor roles. This means that, as long as the concentration ratio and fractal dimension are optimized, the polymer type and GNP size could be chosen independently. To assess this result, we extract the samples which fulfill the following conditions: 1.9 ≤ DF ≤ 2.1(Figure 5A, red square) and 6.10−3 ≤ RatioP olyGold ≤ 60.10−3(Figure 5B, red square). Among the 11 samples that fulfill these conditions, and that present significantly higher heating properties than the other samples (p-value = 0.0057), the four polyelectrolytes could be found as building block, as well as 4 of the 5 GNP sizes (3, 9, 13 and 18 nm). In addition, the first DLS relaxation time vary from 130 to 1400 µs between these optimized samples, which cover hydrodynamic size range from 60 to 680 nm, indicating that the aggregate size play only a few role in the heating properties as long as the previous criteria are met.
Thus, the rationalization of GNPs aggregate structure with QSPR approach enables to evidence simple and clear criteria that should be fulfilled to obtain optimal heating properties. This identification of criteria relaxes the constraint on the other parameters that govern
● ● ● ● ● ● ● ● ● ● ● ● ● ● ● ● ● ● ● ● ● ● ● ● ●● ● ● ● ● ● ● ● ● ● ● ● ● ● ● ● ● ● ● ● ● ● ● ● ● ● ● ● ● ● ● ● ● ● ● ● ● ● ● ● ● ● ● ● ● ● ● ● ● ● ● ● ● ● ● ● ● ● ● ● ● ● ● ● ● ● ● ● ● ● ● ●● ● ● ● 0.0 0.5 1.0 1.5 2.0 2.5 3.0 0 50 100 150 Fractal dimension SAR (kW/g)
A
0 50 100 150Polyelectrolyte/Gold Mass Ratio (x10−3)
SAR (kW/g) ● ● ● ● ● ● ● ● ● ● ● ● ● ● ● ●● ● ● ● ● ● ● ● ● ● ● ● ● ● ● ● ● ● ● ●● ● ● ● ● ● ● ● ● ● ● ● ● ● ● ●● ● ● ● ●● ● ● ● ● ● ● ● ● ● ● ● ● ● ● ● ● ● ● ● ●● ● ● ● ● ● ● ● ● ● ● ● ● ● ●● ● ● ● ● ● ● ● 1.8 6 18 60 180 600
B
Figure 5: Validation of the predicted optimum of the model. Plot of the SAR values depend-ing on the fractal dimension (A), and on the concentration ratio between polyelectrolyte and gold (B).The red dotted rectangles indicates the area around optimized value for the fractal dimension and aggregate size according to the regression.
the system, such as the aggregate size, or the choice of the GNP size and polyelectrolyte used for the aggregation, which enable safer-by-design approaches. These parameters can hence be chosen in order to fit other criteria that are known to depend on their charge and size, such as the biocompatibility of the aggregate, its capacity to avoid or promote elimination by the kidney or the liver, its ability to penetrate deeply inside the tumor, its internalization by tumor cells, or its elimination from the organism after therapeutic
use.10,36–38 More particularly, these results raises the attention for the medical use of small
nanoparticles, that appear recently to be more biodegradable than large ones.39 Briefly, the author shows that 4 nm GNPs could be almost entirely be degraded by cells in vitro in two months, while 22 nm GNPs are hardly degraded after six months. Overall, QSPR provides a safer-by-optimization approach than can really impact the field of nano-assembly design for a large frame of applications.
Conclusion
We propose a computational approach based on QSPR regression to model the heating capacities of complex GNPs aggregates. For that purpose, we synthesized 108 assemblies using three sizes of GNPs and three types of oppositely-charged biocompatible polymers mixed at different ratios. The resulting aggregates cover a range of size from the nanometer to the micrometer scale, and that vary from open to compact aggregates. These aggregates were described by 15 independent descriptors that encompass their average size, fractal dimension, charge, and optical and heating properties. Data mining analysis by empirical approach evidences a general pattern in series, though tendencies cannot fully be depicted by this approach.
Hence, we resort to statistical tools to refine our understanding of this dataset. Principal component analysis evidences that samples could be separated into three clusters that are independent of the building blocks properties, yet highly correlated with heating properties.
This indicates that structural properties plays a more important role than GNP size and polyelectrolyte nature, which was confirmed by regression. Our analysis underlines the weight of the fractal dimension and the GNP/polyelectrolyte concentration ratio in the prediction of aggregate heating properties.
Overall, we validate the use of QSPR approach on self-assembly structures, and we pro-vide a predictive model to evaluate aggregate heating properties. We epro-vidence that optimiz-ing a few parameters can be sufficient to design optimized functional aggregates. This last point enables to have choice on other criteria (e.g. on the nanoparticle size) that are impor-tant for biomedical application such as the bionano interactions, pharmacodynamics, tissue penetration, intracellular behaviour, long term fate and the safety of these nanodevices.
Experimental
Chemicals
Tetrachloroauric (III) acid (≥ 99 % trace metal basis), trisodium citrate dihydrate (≥ 99 %), potassium carbonate (≥ 99 %) and tannic acid were purchased from Sigma-Aldrich. Chitosan 700 kDA was purchased from Acros Organics, chitosan 300 kDa, PDADMAC 400 kDa and PEI 750 kDa were purchased from Sigma Aldrich. Fresh MilliQ water has been used for all experiments.
GNPs synthesis
The 9, 13, 20 and 30 nm GNPs were synthetized following a Turkevich inspired protocol proposed by30based on the synthesis of gold seeds of 10 nm followed by a sequential addition triggering seeds growth. 97 mg of sodium citrate was dissolved in 150 mL of MilliQ water in a two-necked round bottom flask and heated to boiling under stirring. After 15 minutes boiling, 1 mL of pre-heated 25 mM gold chloride solution was added. After 10 minutes of reaction, the reaction was either stopped (for the 13 nm GNPs) or lowered to 90 °C (for the 30 nm GNPs). The sample was then diluted to enable a quicker growth of the seeds by extracting 55 mL of the GNPs solution, and the addition of 53 mL of MilliQ water and of 2 mL of 60 mM sodium citrate solution. 1 mL of 25 mM gold chloride was then added. A second addition of 1 mL of gold solution was realized after 30 minutes. After 30 more minutes, the dilution and addition of reagents steps were repeated to obtain the desired size. The 3 nm GNPs were synthesized in presence of tannic acid, following a protocol proposed by.31 97 mg of sodium citrate and 20.7 mg of potassium carbonate were added to 150 mL of MilliQ water and 1 mL of 2.5 mM tannic acid solution in a two-necked flask. After heating at 70 °C under stirring, 1 mL of 25 mM gold chloride solution was added. When the solution turned orange, the reaction was stopped.
isotropic and monodisperse GNPs with the following radii measured by TEM: DTEM = 3.4 nm ± 0.9; 9.1 nm ± 1.4; 13.5 nm ± 3.2; 20.2 nm ± 2.4; 30.6 nm ± 2.6. These GNPs are mainly dispersed as individual objects as evidenced by UV visible spectroscopy, DLS and cryo-TEM. The GNPs were not further treated before complexation and were used at the lowest concentration obtained after synthesis ([Au] = 32.8 mg/L).
Aggregate synthesis
Aggregates have been synthetized by an equivolumic mixing of the aqueous GNPs solution and the aqueous polyelectrolyte solution, whose pH was previously adjusted to 3 by addition of hydrochloric acid. No salt was added to fix the ionic strength background. Thus, the ionic strength increases with the polycation concentration at fixed GNP concentration. The electrical conductivity was always below 0.5 mS.cm-1. The polyelectrolyte concentration was modified to obtain final polymer concentrations ranging from 3 × 10⁻⁵ to 10-2 g.L-1 and a gold concentration [Au] = 16.4 mg.L-1 after the equivolumic mix. The concentration ratio was evaluated as the ratio of mass concentration between polyelectrolyte and gold, that is between 0 (GNPs only) and 0.6.
Characterization methods
Transmission electron microscopy images of single GNPs were obtained with a Tecnai 12 mi-croscope operating at 80 keV (Imagoseine, Jacques Monod Institute, Paris) after deposition of a droplet of NPs solution on a hydrophilized grid.
Aggregate characterisations were performed directly after synthesis (less than 5 minutes after mixing), and after 24 hours.
Dynamic light scattering (DLS) and laser doppler electrophoresis (LDE) was performed on a Zeta Sizer NanoZS apparatus (Malvern Instruments), operating with a 632.8 nm laser with P ± 4 mW at a fixed scattering angle of 173 °at room temperature (25 °C). Size analysis was carried out by converting the measured intensity autocorrelation function into
the scattered electric field autocorrelation function using the Siegert relation. Charge analysis was carried out with an electrical field of 25 V.cm-1 oscillating successively at 20 Hz and 0.7 Hz to reduce the electroosmosis effect due to the surface charge of the capillary cell. The particle’ velocity was measured by LASER Doppler velocimetry.
Small angle X-Ray scattering experiments were performed on the SWING beamline (SOLEIL synchrotron at St Aubin, France) with the following configuration: sample- to-detector distance D = 6.52 m; beam energy E = 12 keV; λ = 1 Å and q range from 0.0012 to 0.228 Å-1. The samples were contained in cylindrical glass capillaries of calibrated diameter. The scattered signal was recorded by an Eiger 4 M detector (DectrisLtd, Switzerland) with pixel size 75 µm. Preliminary data treatment (angular averaging and normalization) was done using the software Foxtrot developed at the beamline.
GNP aggregates were characterized by Cryo-TEM as in.40 A 4 µL droplet of aggregates
aqueous solution was deposited on a Quantifoil (Quantifoil Micro Tools GmbH, Germany) holey carbon grid. The excess of liquid on the grid was absorbed with filter paper and the grid was quench-frozen quickly in liquid ethane to form a thin vitreous ice film. Once placed in a Gatan 626 cryo-holder cooled with liquid nitrogen, the samples were transferred to the microscope and observed at a low temperature (- 180 °C). Observations were performed with a LaB6 JEOL JEM2100 cryo-microscope operating at 200 kV (IMPMC, Sorbonne Université – CNRS UMR 7590, Paris, France) coupled with a 2k x 2k Gatan Ultrascan 1000 CCD camera. Images were taken with the JEOL low dose system (Minimum Dose System, MDS) to protect the thin ice film from any irradiation before imaging and to reduce the irradiation during the image capture.
UV visible spectra were obtained in an Enspire multimode plate reader (Perkin Elmer) using TPP 96-wells plates in the 300-800 nm range.
Photothermal measurements were performed with a 680 nm laser (Laser components SAS) illuminating a 0.5-mL tube containing 0.1 mL of sample. The distance between the sample and the laser was fixed to 4 cm to get a laser power of 6.3 W.cm-2. The temperature of
the sample was measured using a thermal camera (Flir SC7000) in real time (1 image/second) in the temperature range of 20 °C to 80 °C. Data were processed with the Altair software.
Theoretical methods
All calculations were performed on R software (version 3.4.3).
To discriminate the different types of aggregate, the samples were represented using the PCA tool of the package FactoMineR and clusterized using k-means clustering.
The SAR was modeled by linear modeling using the function lm of R. In the present case, the use of non-linear terms were added to the lm function. All the models were first calculated using the widest number of descriptors, then, to minimize the number of descriptors, a stepwise approach was performed on the model (function step, direction = "both", penalty fixed to log(n) for the linear models, 2log(n) for the non-linear ones).
For the training data set, the model quality was validated by: (1) assessment of residues normality (Figure S18); assessment of the equal distribution of residues through condition (Figure S19); Y-randomization (R2
Y −random = 0.10). Internal validation was performed by
Leave Many Out Cross Validation (LMOCV), using the package caret of R (function train). The model parameters were calculated on 50% of the data. Then the accuracy of these parameters was evaluated by predicting R2
CV on the remaining 50% of the dataset. The
R2
CV have been averaged on 1000 partitions of the dataset. For the validation data set, the model prediction was validated by assessment of the equal distribution of residues through conditions (Figure S20).
The model accuracy on the validation dataset was assessed with the function predict. The optimized descriptors to maximize the SAR was determined using the function optim. As the function presents a single maximum, the starting point has no incidence. The domain of definition for this maximum research was established using either the physical limitation of the descriptor or as the minimal and maximal values observed in the dataset.
Acknowledgement
AB received a PhD fellowship from the doctoral school Physique en Ile de France (ED-PIF). VMA received a post-doc fellowship from the Association pour le Recherche contre le Cancer (ARC, Aides Individuelles, postdoctorant, dossier 20150603405). The author thank the ANR CarGold-16-CE09-026, ANR Coligomere-18-CE06-0006, and the European Union’s Horizon 2020 research and innovation program under grant agreement No 801305 for funding. We are grateful to the Imagoseine core facility of the Institut Jacques Monod (UMR7592, CNRS/Université Paris Diderot, Paris, France), member of the France BioImaging (ANR-10-INBS- 65904) for the electron microscopy observations, to Thomas Bizien and the SWING beamline team (Synchrotron SOLEIL, St-Aubin, France) for the SAXS experiments, to Jean Michel Guinier (Sorbonne Université, Muséum National d’Histoire Naturelle, CNRS, IRD, Institut de Minéralogie, de Physique des Matériaux et de Cosmochimie (IMPMC), Paris, France), to Alba Nicolas Boluda and Anouchka Plan-Sangnier (Université de Paris, Labora-toire Matière et Systèmes Complexes, UMR7057, Paris, France) for help with photothermal measurements, and to Pierre Bost (C3BI, USR3756, CNRS/Institut Pasteur, Paris, France), Cyprien Gay and Gaëlle Charron (Université de Paris, Laboratoire Matière et Systèmes Complexes, UMR7057, Paris, France) for fruitful discussion.
Supporting Information Available
The following files are supplied as supporting information:• Supplementary_data.pdf: suplementary text, figures and table mentionned in the ar-ticle
References
1. Grzelczak, M.; Vermant, J.; Furst, E. M.; Liz-Marzan, L. M. Directed self-assembly of nanoparticles. ACS nano 2010, 4, 3591–3605.
2. Nie, Z.; Petukhova, A.; Kumacheva, E. Properties and emerging applications of self-assembled structures made from inorganic nanoparticles. Nature nanotechnology 2010, 5, 15.
3. Gong, J.; Li, G.; Tang, Z. Self-assembly of noble metal nanocrystals: Fabrication, optical property, and application. Nano Today 2012, 7, 564–585.
4. Wu, Y.; Ali, M. R.; Chen, K.; Fang, N.; El-Sayed, M. A. Gold nanoparticles in biological optical imaging. Nano Today 2019,
5. Pileni, M.-P. Impact of the metallic crystalline structure on the properties of nanocrystals and their mesoscopic assemblies. Accounts of chemical research 2017, 50, 1946–1955. 6. Zeng, S.; Yong, K.-T.; Roy, I.; Dinh, X.-Q.; Yu, X.; Luan, F. A review on functionalized
gold nanoparticles for biosensing applications. Plasmonics 2011, 6, 491.
7. Saha, K.; Agasti, S. S.; Kim, C.; Li, X.; Rotello, V. M. Gold nanoparticles in chemical and biological sensing. Chemical reviews 2012, 112, 2739–2779.
8. Majumdar, D.; Singha, A.; Mondal, P. K.; Kundu, S. DNA-mediated wirelike clusters of silver nanoparticles: an ultrasensitive SERS substrate. ACS applied materials & in-terfaces 2013, 5, 7798–7807.
9. Szekeres, G. P.; Kneipp, J. SERS probing of proteins in gold nanoparticle agglomerates. Frontiers in chemistry 2019, 7, 30.
10. Chou, L. Y.; Zagorovsky, K.; Chan, W. C. DNA assembly of nanoparticle superstructures for controlled biological delivery and elimination. Nature nanotechnology 2014, 9, 148.
11. Berret, J.-F.; Schonbeck, N.; Gazeau, F.; El Kharrat, D.; Sandre, O.; Vacher, A.; Airiau, M. Controlled clustering of superparamagnetic nanoparticles using block copoly-mers: design of new contrast agents for magnetic resonance imaging. Journal of the
American Chemical Society 2006, 128, 1755–1761.
12. Corr, S. A.; Byrne, S. J.; Tekoriute, R.; Meledandri, C. J.; Brougham, D. F.; Lynch, M.; Kerskens, C.; O’Dwyer, L.; Gun’ko, Y. K. Linear assemblies of magnetic nanoparticles as MRI contrast agents. Journal of the American Chemical Society 2008, 130, 4214–4215. 13. Li, H.; Liu, X.; Huang, N.; Ren, K.; Jin, Q.; Ji, J. Mixed-charge self-assembled monolay-ers as a facile method to design pH-induced aggregation of large gold nanoparticles for near-infrared photothermal cancer therapy. ACS applied materials and interfaces 2014, 6, 18930–18937.
14. Kang, S.; Bhang, S. H.; Hwang, S.; Yoon, J.-K.; Song, J.; Jang, H.-K.; Kim, S.; Kim, B.-S. Mesenchymal stem cells aggregate and deliver gold nanoparticles to tumors for pho-tothermal therapy. ACS nano 2015, 9, 9678–9690.
15. Sun, M.; Liu, F.; Zhu, Y.; Wang, W.; Hu, J.; Liu, J.; Dai, Z.; Wang, K.; Wei, Y.; Bai, J., et al. Salt-induced aggregation of gold nanoparticles for photoacoustic imaging and photothermal therapy of cancer. Nanoscale 2016, 8, 4452–4457.
16. Song, J.; Kim, J.; Hwang, S.; Jeon, M.; Jeong, S.; Kim, C.; Kim, S. Smart gold nanopar-ticles for photoacoustic imaging: an imaging contrast agent responsive to the cancer microenvironment and signal amplification via pH-induced aggregation. Chemical Com-munications 2016, 52, 8287–8290.
17. Mulens-Arias, V.; Nicolás-Boluda, A.; Gehanno, A.; Balfourier, A.; Carn, F.; Gazeau, F. Polyethyleneimine-assisted one-pot synthesis of quasi-fractal plasmonic gold nanocom-posites as a photothermal theranostic agent. Nanoscale 2019, 11, 3344–3359.
18. Bouju, X.; Duguet, E.; Gauffre, F.; Henry, C. R.; Kahn, M. L.; Mélinon, P.; Ravaine, S. Nonisotropic Self-Assembly of Nanoparticles: From Compact Packing to Functional Ag-gregates. Advanced Materials 2018, 30, 1706558.
19. Torquato, S. Inverse optimization techniques for targeted self-assembly. Soft Matter 2009, 5, 1157–1173.
20. Adleman, L.; Cheng, Q.; Goel, A.; Huang, M.-D.; Kempe, D.; De Espanes, P. M.; Rothemund, P. W. K. Combinatorial optimization problems in self-assembly. Proceedings of the thiry-fourth annual ACM symposium on Theory of computing. 2002; pp 23–32. 21. Mandal, S.; Moudgil, M.; Mandal, S. K. Rational drug design. European journal of
pharmacology 2009, 625, 90–100.
22. Huggins, D. J.; Sherman, W.; Tidor, B. Rational approaches to improving selectivity in drug design. Journal of medicinal chemistry 2012, 55, 1424–1444.
23. Katritzky, A. R.; Lobanov, V. S.; Karelson, M. QSPR: the correlation and quantitative prediction of chemical and physical properties from structure. Chemical Society Reviews 1995, 24, 279–287.
24. Schultz, T. W.; Cronin, M. T.; Walker, J. D.; Aptula, A. O. Quantitative structure– activity relationships (QSARs) in toxicology: a historical perspective. Journal of
Molec-ular structure: THEOCHEM 2003, 622, 1–22.
25. Roy, K.; Kar, S.; Das, R. N. A primer on QSAR/QSPR modeling: fundamental concepts; Springer, 2015.
26. Ghosh, S. K.; Pal, T. Interparticle coupling effect on the surface plasmon resonance of gold nanoparticles: from theory to applications. Chemical reviews 2007, 107, 4797–4862.
27. Khlebtsov, B.; Zharov, V.; Melnikov, A.; Tuchin, V.; Khlebtsov, N. Optical amplifica-tion of photothermal therapy with gold nanoparticles and nanoclusters. Nanotechnology 2006, 17, 5167.
28. Espinosa, A.; Silva, A. K.; Sánchez-Iglesias, A.; Grzelczak, M.; Péchoux, C.; Des-boeufs, K.; Liz-Marzán, L. M.; Wilhelm, C. Cancer cell internalization of gold nanostars impacts their photothermal efficiency in vitro and in vivo: toward a plasmonic thermal fingerprint in tumoral environment. Advanced healthcare materials 2016, 5, 1040–1048. 29. Shi, L.; Buhler, E.; Boue, F.; Carn, F. Shape-Tailored Colloidal Molecules Obtained by Self-Assembly of Model Gold Nanoparticles with Flexible Polyelectrolyte. Langmuir 2015, 31, 5731–5737.
30. Bastús, N. G.; Comenge, J.; Puntes, V. Kinetically controlled seeded growth synthesis of citrate-stabilized gold nanoparticles of up to 200 nm: size focusing versus Ostwald ripening. Langmuir 2011, 27, 11098–11105.
31. Piella, J.; Bastús, N. G.; Puntes, V. Size-Controlled Synthesis of Sub-10-nanometer Citrate-Stabilized Gold Nanoparticles and Related Optical Properties. Chem. Mater 2016, 28, 1066–1075.
32. Louis, C.; Pluchery, O. Gold nanoparticles for physics, chemistry and biology; World Scientific, 2012.
33. Huang, X.; El-Sayed, M. A. Gold nanoparticles: optical properties and implementations in cancer diagnosis and photothermal therapy. Journal of advanced research 2010, 1, 13–28.
34. Tropsha, A.; Gramatica, P.; Gombar, V. K. The importance of being earnest: validation is the absolute essential for successful application and interpretation of QSPR models. Molecular Informatics 2003, 22, 69–77.
35. Nguyen, T. T.; Shklovskii, B. I. Complexation of a polyelectrolyte with oppositely charged spherical macroions: giant inversion of charge. The Journal of Chemical Physics 2001, 114, 5905–5916.
36. Perrault, S. D.; Walkey, C.; Jennings, T.; Fischer, H. C.; Chan, W. C. Mediating tumor targeting efficiency of nanoparticles through design. Nano letters 2009, 9, 1909–1915. 37. Albanese, A.; Chan, W. C. Effect of gold nanoparticle aggregation on cell uptake and
toxicity. ACS nano 2011, 5, 5478–5489.
38. Huo, S.; Ma, H.; Huang, K.; Liu, J.; Wei, T.; Jin, S.; Zhang, J.; He, S.; Liang, X.-J. Superior penetration and retention behavior of 50 nm gold nanoparticles in tumors. Cancer research 2013, 73, 319–330.
39. Balfourier, A.; Luciani, N.; Wang, G.; Lelong, G.; Ersen, O.; Khelfa, A.; Alloyeau, D.; Gazeau, F.; Carn, F. Unexpected intracellular biodegradation and recrystallization of gold nanoparticles. Proceedings of the National Academy of Sciences 2020, 117, 103– 113.
40. Fleury, B.; Neouze, M.-A.; Guigner, J.-M.; Menguy, N.; Spalla, O.; Gacoin, T.; Car-riere, D. Amorphous to crystal conversion as a mechanism governing the structure of luminescent YVO4: Eu nanoparticles. ACS nano 2014, 8, 2602–2608.