HAL Id: inserm-00924236
https://www.hal.inserm.fr/inserm-00924236
Submitted on 6 Jan 2014HAL is a multi-disciplinary open access archive for the deposit and dissemination of sci-entific research documents, whether they are pub-lished or not. The documents may come from teaching and research institutions in France or abroad, or from public or private research centers.
L’archive ouverte pluridisciplinaire HAL, est destinée au dépôt et à la diffusion de documents scientifiques de niveau recherche, publiés ou non, émanant des établissements d’enseignement et de recherche français ou étrangers, des laboratoires publics ou privés.
patients: A longitudinal study.
Pascal Crenn, Sabrina Hamchaoui, Aliette Bourget-Massari, Mouna Hanachi,
Jean-Claude Melchior, Philippe Azouvi
To cite this version:
Pascal Crenn, Sabrina Hamchaoui, Aliette Bourget-Massari, Mouna Hanachi, Jean-Claude Melchior, et al.. Changes in weight after traumatic brain injury in adult patients: A longitudinal study.. Clinical Nutrition, Elsevier, 2014, epub ahead of print. �10.1016/j.clnu.2013.06.003�. �inserm-00924236�
Changes in weight after traumatic brain injury in adult patients: a longitudinal study
1
2
Pascal Crenn1, 2, Sabrina Hamchaoui2, Aliette Bourget-Massari2, Mouna Hanachi1, 2, Jean-3
Claude Melchior1, 2; Philippe Azouvi1, 2 4
5
1- EA 4497, Université Versailles Saint-Quentin-en-Yvelines. 6
2- APHP, Raymond Poincaré Hospital, 104 boulevard Raymond-Poincaré 92380 7
Garches, France 8
9
Key words: traumatic brain injury, weight change, behavioral dysexecutive syndrome, eating
10
disorders 11
12
Abbreviations: TBI: traumatic brain injury. BMI: body mass index. WHO: World Health
13
Organization. 14
15
Corresponding author: Pascal Crenn, MD, PhD, Département de Médecine Aiguë
16
Spécialisée, Raymond Poincaré Hospital, 104 boulevard Raymond-Poincaré, 92380 Garches. 17 France 18 Tel: 33 (1) 47104667, Fax: 33 (1) 47104424 19 Email: pascal.crenn@rpc.aphp.fr 20 21
Word count of the text: 3736 22
3 tables and 1 figure 23
Abstract
25
Background & Aims: Although changes in weight have been reported after traumatic brain
26
injury (TBI), their frequency and underlying factors are little known. Our aim was to 27
determine the prevalence of weight changes and the associated factors during the recovery 28
phase after TBI. 29
Methods: Longitudinal follow-up of adults with TBI. Multivariate analysis was carried out on
30
weight change, demographic data, dysexecutive syndrome, eating behavior, physical activity, 31
therapeutic classes and metabolic complications. 32
Results: 107 patients (81 males/26 females), age 36±13 yrs, baseline BMI 23.3±3.9, followed
33
for 38 (8–66) months, were included. In intensive care, patients lost a mean 11±6 kg. End of 34
follow-up, mean BMI was not different to pre-TBI BMI, but patients could be categorized in 35
3 groups: stable (30%), loss (28%, −8±7 kg) and gain (42%, +9±6 kg). Sex, age, severity of 36
TBI, intensive care weight loss, physical activity, therapeutic classes and the occurrence of 37
metabolic syndrome did not differ between the groups. Factors related to weight gain were 38
hyperphagia, OR 4.5 (IC95%, 1.6–12.1) and presence of a dysexecutive syndrome, OR 2.5 39
(IC95%, 1.03-6.3). Factors related to weight loss were hypophagia, OR 4.1 (IC95%, 1.5– 40
10.9) and higher pre-TBI BMI, OR 4.9 (IC95%, 1.7–14.0). 41
Conclusions: Over a median period of 38 months, 42% of TBI patients gained and 28% lost
42
weight. Factors associated with these changes were the presence of a behavioral dysexecutive 43
syndrome for weight gain, oral food intake and initial BMI, which were inversely associated 44
with weight at end of follow-up. These findings highlight the importance of evaluating the 45
time course of weight changes and providing specific nutritional care. 46
Introduction
48
Obese passengers are more likely to suffer a more severe head injury after frontal motor-49
vehicle crashes1. After traumatic brain injury (TBI), changes in weight and (or) food behavior 50
have been reported in short studies 2,3 and various clinical case-reports 4,5. Some reports have 51
described hyperphagia and reduction of satiety 6. Anorexia following TBI has also been 52
reported 7. A recent longitudinal study in 39 children with TBI showed that 15% were 53
overweight 1 year after the TBI 8. However, the frequency of weight changes and the 54
underlying factors are currently unknown in adult patients. In a study of 20 TBI patients, the 55
presence of other persons during meals, or the social factor, was a significant predictor of 56
meal size for healthy control subjects, but not for brain-injured patients 2 indicating probable 57
central involvement. In addition, a low prevalence (5.4%) of hypopituitarism, including GH 58
deficiency and hypogonadism, which can contribute to obesity, was reported in a study of 112 59
adult TBI patients 9. The same trend was observed in 39 children, with a prevalence of 2.5%8. 60
A higher prevalence -15%- was found in a cross-sectional study of 104 adult patients 13 61
months after TBI 10. Modification of food behavior – and thus of weight – can be expected to 62
occur after TBI, due to the presence of a dysexecutive syndrome and because the 63
hypothalamus is the main brain center involved in food intake in both animal experimental 64
models and humans 11. Cognition and behavior can also be impaired in moderately severe 65
TBI, and is related to a “post-concussion syndrome” 12. 66
Changes in nutritional intake after TBI appear to occur in two phases: a constant, 67
prolonged and significant hypermetabolism during the stay in neurosurgical units and 68
intensive care 13,14, with a risk of severe undernutrition despite nutritional support, followed 69
by a recovery phase which may follow different patterns. To determine the prevalence of 70
changes in weight after TBI in the recovery phase, and the associated factors, we performed a 71
longitudinal study in a cohort of adult TBI patients followed in a specialized hospital for 72
neurocognitive rehabilitation. 73
Patients and methods
75
Patients
76
This was a single centre longitudinal study of a cohort of adult TBI patients. All the patients 77
were initially cared for in different intensive care units and were then admitted to our physical 78
medicine and rehabilitation (PMR) center between 2004 and 2009. The study protocol was 79
approved by the local Ethics committee. Informed consentwas obtained from the patients or 80
their relations in compliance with the French regulations for observational clinical research. 81
Inclusion criteria were: age 18–70 years at the time of the TBI, isolated TBI assessed with the 82
cerebral Marshall CT-scan classification15 and the Glasgow coma scale (GCS) [mild (score 83
13–15), moderate (9–12), or severe (<9)] with no associated spinal cord injury or 84
polytraumatic lesions of the viscera which required surgery. In addition, a follow-up of at 85
least 6 months after the intensive care period and from the beginning of rehabilitation was 86
mandatory. 87
We excluded patients below the age of 18 or above the age of 70, pregnant women, patients 88
with paraplegia, tetraplegia and those in a persistent vegetative state, patients with no 89
indications for rehabilitation and patients with previous surgery to the digestive system, in 90
order to eliminate possible interference with the regulation of food intake. 91
Analyses of hypothalamic and pituitary hormones were carried out in patients for whom there 92
was a clinical or biological suspicion of deficiency, such as polyuria or hypernatremia. 93
Enteral nutrition adapted to their needs in terms of energy and protein (1500 to 1800 kcal/d, 94
56 to 67 g of proteins) was given to each patient in intensive care units by a nasogastric tube 95
or gastrostomy and was continued during the transfer to PMR. Reduction and weaning from 96
enteral nutrition was carried out under the supervision of the dietician during the stay in PMR 97
(4 months in average) when the patient regained the ability to swallow without difficulty. A 98
mixed feeding program was put into place, with a nocturnal enteral intake until oral intake 99
became sufficient, with an energy intake goal of 1600 to 1800 kcal/d for patients who were 100
overweight before the TBI and 1800 to 2000 kcal/d for those who were not. 101
102
Data collection
103
Weight was noted at different time points: before the TBI (W1 i.e. usual weight recorded in 104
previous medical files or noted during interviews with the patients or their relatives), at 105
admission to, (W2) and discharge from (W3) the PMR center, and at the end (W4) of the 106
follow-up period. BMI (body mass index) was calculated at each of these time points. The 107
following potential explanatory factors were noted: age, sex, initial GCS score, duration of 108
coma and stay in intensive care, level of physical activity according to the WHO (World 109
health organization) criteria16 and therapeutic classes of drugs taken by the patients. 110
Quantitative oral food intake was noted according to three categories which were relative to 111
pre-TBI levels: lower, i.e. hypophagia (<1500 kcal/d), similar, and higher, i.e. hyperphagia 112
(>2500 kcal/d). This was based on a dietary inquiry, verbal or visual analogue scales and 113
eating behavior (number of meals per day, eating between meals, taste preferences (sweet or 114
savory), binge eating and nocturnal eating) during the stay in PMR and following return 115
home. No patients took topiramate 17 as an antiepileptic drug or were treated for a binge 116
eating disorder. Oral food intake and eating behavior were determined during dietary inquiries 117
with the patients and their families, at least twice in a 2-month period during a medical 118
consultation or a phone call by a dietician and a physician. In addition, alcohol and tobacco 119
abuse, presence or absence of addictions since TBI and before TBI, were recorded. The 120
presence of a behavioral dysexecutive syndrome was scored dichotomously (yes/no) during 121
the stay in PMR by an experienced neuropsychologist, based on the patient’s performance on 122
a standardized test 18. Metabolic complications which were present before the TBI and any 123
occurring during the follow-up after TBI were recorded: arterial hypertension, diabetes 124
mellitus or glucose intolerance and dyslipidemia. 125
126
Statistics
127
Data from all the patients included were used in the initial analysis. For this analysis, three 128
classes of BMI were used: below 20 (underweight), 20 to 25 (normal), and above 25 129
(overweight). Data were evaluated at four time points: W1: weight prior to TBI, W2: 130
admission to PMR, W3: discharge from PMR and W4: end of the follow-up period. In a 131
posthoc analysis, patients were categorized in three groups according to the amount of weight 132
change at the end of the follow-up compared with pre-TBI weight: group 1 (weight loss), 133
group 2 (weight stabilization: ±3%) or group 3 (weight gain). Student t tests and ANOVAs 134
were used for quantitative data comparisons, and chi-squared tests for qualitative data. To 135
study independent associated factors in relation to weight change, a logistic regression was 136
used. SPSS software version 11.5 was used for the statistical analysis. Statistical significance 137
was set at p < 0.05. 138
Results
140
During the period from 2004 to 2009, among the 280 patients admitted to our PMR center and 141
classified as post-TBI, 107 patients met the inclusion criteria. Median duration of follow-up 142
was 38 (8–66) months from the end of the intensive care period. 143
144
Baseline
145
Patient characteristics relating to the severity of TBI are listed in Tables 1 and 2. 146
Neurosurgical interventions were carried out in 28 patients (26%), mostly for compressive 147
intracranial hematoma. A diffuse cerebal injury on the initial cerebral X-ray or MRI according 148
to Marshall classification was found in 79 patients (74%) and was associated with a prefrontal 149 lesion in 74 (69%) patients. 150 151 End of follow up 152
At the end of follow-up, 104 patients (97%) were discharged home and 3 (3%) were admitted 153
to a specialized institution for patients with severe cognitive disorders. Fifty-three TBI 154
patients (49%) had resumed work or school activities at the end of follow-up whereas 51 155
(48%) were not able to return to a normal socio-professional life. Sixty eight patients (64%) 156
were found to have a behavioral dysexecutive syndrome following assessment in the PMR 157
department, including 12 (11%) with severe disinhibition. Only three patients had significant 158
hypopituitarism, two had diabetes insipidus and took vasopressin (DDVAP) and one had a 159
partial adenohypophysis deficiency that required hormonal supplementation. 160 161 Weight changes 162 W1 to W2: 163
All the patients received enteral nutrition (including 18 by gastrostomy) during intensive care 164
and (or) neurosurgery, but still lost a mean 11 ± 6 kg (IC 95%, 7.9–12) in 38 (7–364) days: 165
W1 = 71 ± 13.5 kg vs. W2 = 60 ± 12.7 kg (P < 0.001). 166
W2 to W4: 167
All the patients were weaned from enteral nutrition, and from the gastrostomy, during their 168
stay in PMR, once they recovered the ability to eat by mouth without any swallowing 169
impairments. During the stay in PMR (W2 to W3), mean weight gain was 8.8 7.8 kg (IC 95 170
% = 6.5–11.1, P < 0.001). W3 was 68.8 11.5 kg and W2 was 60 ± 12.7 kg, corresponding to 171
a mean gain of 80% of weight lost during intensive care. This change occurred over 3.9 3.4 172
months, the mean duration of stay in our PMR unit. Between the end of PMR (W3) and the 173
end of follow-up (W4) there was a mean weight increase of 3 ± 6.6 kg (IC 95% = 1.2–4.8) 174
over a 32 ± 16.6 month period. 175
W1 to W4: 176
Mean BMI at W4 (23.8 ± 4.1) was not different to W1 (pre-TBI) (23.3 ± 3.9) (P = 0.08). 177
However, we found that the patients could be categorized in three different groups at the end 178
of the follow up: group 1, weight loss (n = 30, 28%: −8 ± 7 kg), group 2, weight stabilization 179
(n = 32, 30%), and group 3, weight gain (n = 45, 42%: +9 ± 6 kg). 180
181
Factors associated with changes in weight
182
Changes in weight and BMI showed that patients with a lower initial BMI tended to become 183
more overweight at the end of follow-up than patients with a higher initial BMI (Figure 1). 184
There was a statistically significant relationship between weight change at W4 and pre-TBI 185
BMI class for each of the three groups (P = 0.015): 54% of pre-TBI patients with a BMI > 25 186
lost weight during the follow-up compared to 14% with a BMI < 20. In addition, 59% of pre-187
TBI patients with a BMI < 20, and 25% of patients with a BMI > 25 gained weight during the 188
follow-up. Thus the weight loss during intensive care reversed for all patients on entry to 189
PMR (W2) and the weight time courses of each group crossed over during the stay in PMR 190
(W2-W3) (see Figure 1). 191
There was a significant relationship between the presence of hypophagia or 192
hyperphagia and W4 weight group (P = 0.001). Patients in group 3 ate more than patients in 193
the other two groups, with a 40% prevalence of hyperphagia compared with 16% and 10% in 194
groups 1 and 2 respectively. In contrast, hypophagia was observed in 50% of group 1 195
compared with 31% and 11% in groups 2 and 3 respectively. There was, however, no 196
statistically significant difference between the three groups for eating behavior (Table 3). The 197
prevalence of a behavioral dysexecutive syndrome was, however, more frequent in the weight 198
gain group (Table 3). There was no significant difference between the severity of TBI, 199
assessed by the initial type of cerebral lesions, the GCS and the duration of coma or intensive 200
care, for any group. There were no significant differences in the number of drug prescriptions 201
at discharge from PMR and during the follow-up between the three groups. Neither did the 202
level of physical activity, sex, age, weight loss during intensive care, level of physical 203
activity, or modification of alcohol or tobacco addiction differ significantly between the three 204
groups. 205
The multivariate analysis included categories of oral food intake, behavioral 206
dysexecutive syndrome and classes of initial BMI in the model. The results showed that the 207
factors which were independently related to weight gain were hyperphagic food intake 208
(P=0.003, OR 4.5 (IC 95%, 1.6–12.1) and the presence of a behavioral dysexecutive 209
syndrome (P=0.04, OR 2.5 (IC 95%, 1.03-6.3). Two factors (P < 0.01) were related to weight 210
loss, hypophagic food intake (OR 4.1 (IC 95%, 1.5–10.9) and higher pre-TBI BMI (OR 4.9 211
(IC 95%, 1.7–14.0). 212
Metabolic complications
214
Before the TBI, 15 patients (15%) had a pre-existing metabolic disease: 3 had type 2 diabetes, 215
5 had arterial hypertension and 7 had dyslipidemias. The occurrence of new metabolic 216
complications was 16% with no significant differences between the three weight change 217
groups. During the post-TBI follow-up, 4 patients (4%) developed arterial hypertension, 3 218
type 2 diabetes (3 %) and 9 (8 %) a dyslipidemia. In contrast, type 2 diabetes associated with 219
hyperlipidemia resolved in one patient with a normalization of previous obesity. 220
Discussion
222
The results of this study showed that weight change during the rehabilitation period 223
after TBI was correlated with level of oral food intake. Higher intakes (hyperphagia), and the 224
presence of a behavioral dysexecutive syndrome, were associated with a higher weight gain 225
than a low level of food intake (hypophagia), which was associated with lower weight gain or 226
weight loss. The second, more paradoxical result, was that the patients with the lowest pre-227
TBI BMI had the highest BMI at the end of follow-up, while patients with the highest pre-228
TBI BMI had the lowest BMI at the end of follow-up. Patients could be categorized in three 229
groups of weight change at the end of follow-up –loss, stabilization and gain. Only 3 230
independent factors were associated with the time course of weight change: nutritional state 231
before TBI, based on the BMI, level of food intake, which significantly changed in more than 232
one half (57 out of 107) of the patients after TBI, and dysexecutive syndrome for the weight 233
gain group. In contrast, type of medication, duration of intensive care, age, sex and physical 234
activity were not related to the type of weight change. All patients lost weight during 235
intensive care and gained weight during the stay in PMR. These findings suggest that the TBI 236
is responsible for changes in weight through the modification of food intake such as 237
hyperphagia and hypophagia, probably as a result of disruption of the appetite control 238
network following the brain lesions. However, it is difficult to establish the direct impact of 239
TBI on feeding behavior and weight. No significant association was found between the type 240
of cerebral injury according to the initial CT scan, and changes in nutritional status and eating 241
behavior at the subacute/chronic stage. However, this is not a surprising finding, as standard 242
CT and/or MRI assessment at the acute stage lack sensitivity to detect diffuse traumatic 243
axonal injury 19. It was therefore very unlikely that subtle functional or structural lesions 244
involving the hypothalamus, which could explain changes in eating habits, would be detected 245
with these techniques. A more detailed exploration of morphological lesions could be useful 246
to gain a better understanding of behavioral changes, including interest in food after a brain 247
injury. More sophisticated imaging techniques, such as functional magnetic resonance 248
imaging or Diffusion Tensor Imaging may in the future help to understand the relationship 249
between brain injuries, morphological lesions and eating behavior following TBI 20. 250
It is well accepted that the brain, notably the hypothalamus and its complex network, 251
plays a crucial role in the regulation of food intake 11. It can therefore be expected that TBI 252
will disrupt this regulation by altering the structures involved. Our study was the largest ever 253
conducted in this field in a cohort of TBI patients of varying severity, with initial management 254
in intensive care and secondary care in a specialized university center for TBI rehabilitation. 255
To limit bias, we included only patients who were not in a neurovegetative state and who had 256
not undergone previous digestive surgery that could disturb normal digestive physiology. We 257
also controlled for potential associated factors, such as medication or physical activity in 258
order to evaluate the specific effect of TBI on weight change. Given the low prevalence of 259
hypopituarism: 3% in our study, 5% in a multicenter study 9 and 2.5% in a cohort of children8, 260
it is unlikely that this pathology plays a major role in weight change. It must, however, be 261
noted that we did not carry out systematic hormonal examinations, as is considered to be 262
optimal practice 21. In addition, the results showed that there was no significant relationship 263
between weight gain and the various drugs prescribed for these patients. Data regarding food 264
intake and eating behavior were recorded at least twice in a 2-month period, through patient 265
inquiries and confirmation by the family and relatives in the case of cognitive sequelae. No 266
differences were found between the two inquiries, similarly to previous studies of alcohol 267
consumption 22. Most of the patients had recovered sufficient cognitive capacity to respond to 268
the inquiry: for example 49% had resumed normal work or school activities by the end of the 269
follow-up. 270
Weight change pattern after TBI was noteworthy: our results confirmed a constant 271
significant weight loss in the intensive care unit of a mean 11 kg, despite the use of enteral 272
nutrition. This is a well-known effect of severe post-traumatic aggression during the acute 273
phase 23. The goal of treatment is to maintain nitrogen balance but, more particularly, to 274
control stress and reduce malnutrition through nutritional assistance. During their stay in 275
PMR, patients regained an average of 8.8 kg, almost all of the weight lost, in an average time 276
of 3.9 ± 3.4 months, which is twice that spent in intensive care. This weight regain was 277
comparable to that found by Brooke 3, who evaluated the effect of nutritional status on 278
functional outcome in 53 TBI patients. Their study describes a significant weight gain in 279
patients during hospitalization in a rehabilitation unit, even exceeding their pre-morbid weight 280
such that 60% of patients left PMR significantly overweight. Various factors probably 281
contributed to the weight change during PMR. First of all, “intrinsic” factors related to the 282
TBI per se, notably a dysexecutive syndrome which was present in 68 patients during the 283
PMR hospitalization and was characterized by major cognitive disorders, including reduced 284
inhibition which can lead to increased food intake 24. This phenomenon is clinically similar to 285
the genetic Prader-Willi syndrome 25. Secondly, an “extrinsic” factor related to feeding 286
management may have been involved. Because of the undernutrition during intensive care 287
and the related potential complications such as bedsores, all the patients received 288
hyperenergetic and hyperproteic diets, however no metabolic evaluations (for example with 289
indirect calorimetry) were carried out to adapt the nutrition to each patient. Families also 290
appear to have played a role in weight gain by overfeeding despite instructions from the 291
dietician 2. It appears that seeing their loved ones regain the capacity to eat and gain weight 292
after a long period of artificial feeding and, for some, "wasting", could be seen by relatives as 293
part of the recovery process. These factors probably maintained and worsened disorders 294
which were directly related to the TBI. This illustrates the complexity of nutritional 295
management after brain injury. A diet adapted to the metabolic level of each patient could 296
help to improve the nutritional changes. To do this, the systematic assessment of metabolic 297
and morphological clinico-biological status is necessary at admission to PMR. Resting energy 298
expenditure and body composition could be evaluated by bioelectric impedance or DEXA 299
according to available resources, for example. Unfortunately, this was not done in the present 300
study. Indeed, the changes we observed in weight could be related to fat deposition in the 301
phase of regaining weight. 302
This study has important clinical implications. TBI is an important cause of eating 303
disorders, particularly in the subacute phase, i.e. during rehabilitation. The correlation of 304
weight change with hyperphagia or hypophagia and dysexecutive syndrome, suggests that 305
TBI strongly disturbs the central areas which control food intake and weight set-points. It is 306
therefore necessary to forestall these disturbances through a better assessment of nutritional 307
needs, tailored to each patient, depending on available resources and technical feasibility. It is 308
important to keep a watchful eye throughout the medium- and long-term follow-up, since we 309
found that 42% of patients significantly gained weight and 28% significantly lost weight over 310
a median of 38 months. The metabolic consequences of this weight gain in the medium term 311
were demonstrated in 16% of patients who developed arterial hypertension, dyslipidemia or 312
type 2 diabetes, although their average age was only 36 years. This could be a significant 313
problem. Monitoring in the longer term might reveal many more metabolic complications, 314
and therefore the extended follow-up of these patients should include weight and metabolic 315
management. The weight loss found in 28% of patients could also have significant somatic 316
consequences, since chronic undernutrition can impair functional recovery 26. 317
Conclusion
319
The results of this study showed that over 42% of adult TBI patients gained weight and 28% 320
lost weight over a period of 38 months. The amount of weight change was related to the level 321
of food intake and was strongly determined by behavioral changes. Initial weight was 322
inversely related to weight at the end of follow up and the time course of weight change was 323
independent from the amount of weight loss during intensive care. The results of this study 324
therefore suggest that TBI strongly disturbs quantitative eating behavior and body weight set-325
points. A study of the long-term metabolic consequences appears justified since in this 38-326
month study, 16% of patients developed a metabolic syndrome. Future studies should 327
evaluate the related changes in body composition, mainly fat free mass and fat mass. 328
Conflict of interest
330
The authors declared no potential conflicts of interest with respect to the authorship and/or 331
publication of this article. 332
333
Statement of authorship
334
PC, SH, JCM and PA contributed to the study design, analysis and interpretation. SH, ABM 335
and MH collected the data. The paper was written by PC, SH and PA and all the authors read 336
and approved the final manuscript. 337
References
339
1. Tagliaferri F, Compagnone C, Yoganandan N, Gennarelli TA. Traumatic brain injury 340
after frontal crashes: relationship with body mass index. J Trauma 2009;66:727-9. 341
2. Henson MB, De Castro JM, Stringer AY, Johnson C. Food intake by brain-injured 342
humans who are in the chronic phase of recovery. Brain Inj 1993;7:169-78. 343
3. Brooke M, Barbour P, LG. C, et al. Nutritional Status During Rehabilitation After 344
Head Injury. Neurorehabil Neural Repair 1989;3:27-33. 345
4. Fujii M, Fujita K, Hiramatsu H, Miyamoto T. Cases of two patients whose food 346
aversions disappeared following severe traumatic brain injury. Brain Inj 1998;12:709-13. 347
5. Miyasaki K, Miyachi Y, Arimitsu K, Kita E, Yoshida M. Post-traumatic hypothalamic 348
obesity--an autopsy case. Acta Pathol Jpn 1972;22:779-802. 349
6. Castano B, Capdevila E. Eating disorders in patients with traumatic brain injury: a 350
report of four cases. NeuroRehabilitation 2010;27:113-6. 351
7. Lewin J, Sumners D. Anorexia due to brain injury. Brain Inj 1992;6:199-201. 352
8. Jourdan C, Brugel D, Hubeaux K, Toure H, Laurent-Vannier A, Chevignard M. 353
Weight gain after childhood traumatic brain injury: a matter of concern. Dev Med Child 354
Neurol 2012;54:624-8. 355
9. Kokshoorn NE, Smit JW, Nieuwlaat WA, et al. Low prevalence of hypopituitarism 356
after traumatic brain injury: a multicenter study. Eur J Endocrinol 2011;165:225-31. 357
10. Klose M, Juul A, Poulsgaard L, Kosteljanetz M, Brennum J, Feldt-Rasmussen U. 358
Prevalence and predictive factors of post-traumatic hypopituitarism. Clin Endocrinol (Oxf) 359
2007;67. 360
11. Schwartz MW, Woods SC, Porte D, Jr., Seeley RJ, Baskin DG. Central nervous 361
system control of food intake. Nature 2000;404:661-71. 362
12. Ropper AH, Gorson KC. Clinical practice. Concussion. N Engl J Med 2007;356:166-363
72. 364
13. Krakau K, Omne-Ponten M, Karlsson T, Borg J. Metabolism and nutrition in patients 365
with moderate and severe traumatic brain injury: A systematic review. Brain Inj 2006;20:345-366
67. 367
14. Perel P, Yanagawa T, Bunn F, Roberts I, Wentz R, Pierro A. Nutritional support for 368
head-injured patients. Cochrane Database Syst Rev 2006:CD001530. 369
15. Marshall LF, Marshall SB, Klauber MR, et al. The diagnosis of head injury requires a 370
classification based on computed axial tomography. J Neurotrauma 1992;9 Suppl 1:S287-92. 371
16. WHO. Move for health. 2002. 372
17. Dolberg OT, Barkai G, Gross Y, Schreiber S. Differential effects of topiramate in 373
patients with traumatic brain injury and obesity--a case series. Psychopharmacology (Berl) 374
2005;179:838-45. 375
18. Godefroy O, Azouvi P, Robert P, Roussel M, LeGall D, Meulemans T. Dysexecutive 376
syndrome: diagnostic criteria and validation study. Annals of neurology 2010;68:855-64. 377
19. Azouvi P. Neuroimaging correlates of cognitive and functional outcome after 378
traumatic brain injury. Current opinion in neurology 2000;13:665-9. 379
20. Zappala G, Thiebaut de Schotten M, Eslinger PJ. Traumatic brain injury and the 380
frontal lobes: what can we gain with diffusion tensor imaging? Cortex; a journal devoted to 381
the study of the nervous system and behavior 2012;48:156-65. 382
21. Ghigo E, Masel B, Amairetti G, et al. Consensus guidelines on screening for 383
hypopituitarism following traumatic brain injury. Brain Inj 2005;19:711-9. 384
22. Sander AM, Witol AD, Kreutzer JS. Alcohol use after traumatic brain injury: 385
concordance of patients' and relatives' reports. Arch Phys Med Rehabil 1997;78:138-42. 386
23. Krakau K, Hansson A, Karlsson T, de Boussard CN, Tengvar C, Borg J. Nutritional 387
treatment of patients with severe traumatic brain injury during the first six months after 388
injury. Nutrition 2007;23:308-17. 389
24. Lezak MD. Neuropsychological Assessment. New York: Oxford University Press; 390
1995. 391
25. Ogura K, Shinohara M, Ohno K, Mori E. Frontal behavioral syndromes in Prader-392
Willi syndrome. Brain Dev 2008;30:469-76. 393
26. Denes Z. The influence of severe malnutrition on rehabilitation in patients with severe 394
head injury. Disabil Rehabil 2004;26:1163-5. 395
396 397 398
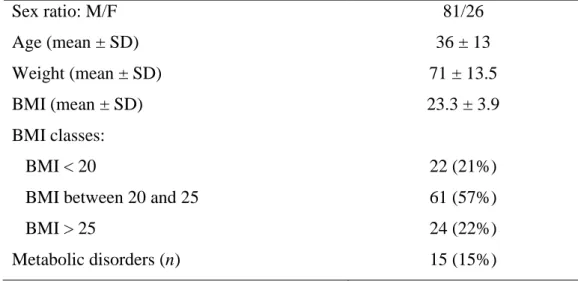
Table 1. Baseline characteristics of patients (n = 107) before traumatic brain injury 399 400 Sex ratio: M/F Age (mean ± SD) Weight (mean ± SD) BMI (mean ± SD) BMI classes: BMI < 20
BMI between 20 and 25 BMI > 25 Metabolic disorders (n) 81/26 36 ± 13 71 ± 13.5 23.3 ± 3.9 22 (21%) 61 (57%) 24 (22%) 15 (15%) 401 402
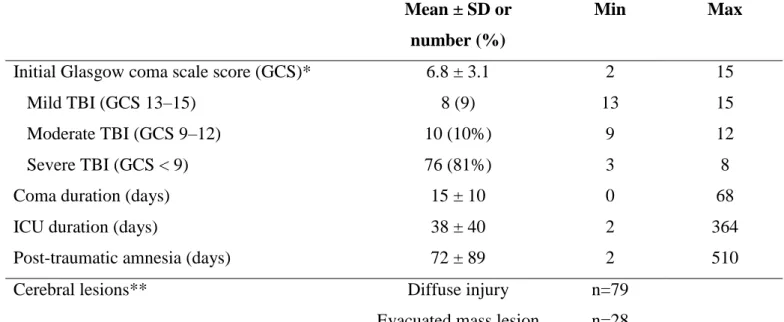
Table 2. Criteria of severity of traumatic brain injury (n = 107) 403 404 Mean ± SD or number (%) Min Max
Initial Glasgow coma scale score (GCS)* Mild TBI (GCS 13–15)
Moderate TBI (GCS 9–12) Severe TBI (GCS < 9) Coma duration (days) ICU duration (days)
Post-traumatic amnesia (days)
6.8 ± 3.1 8 (9) 10 (10%) 76 (81%) 15 ± 10 38 ± 40 72 ± 89 2 13 9 3 0 2 2 15 15 12 8 68 364 510 Cerebral lesions** Diffuse injury
Evacuated mass lesion
n=79 n=28 * For 94 patients in whom the GCS was documented
405
** according to Marshall CT-scan classification 406
TBI: traumatic brain injury 407
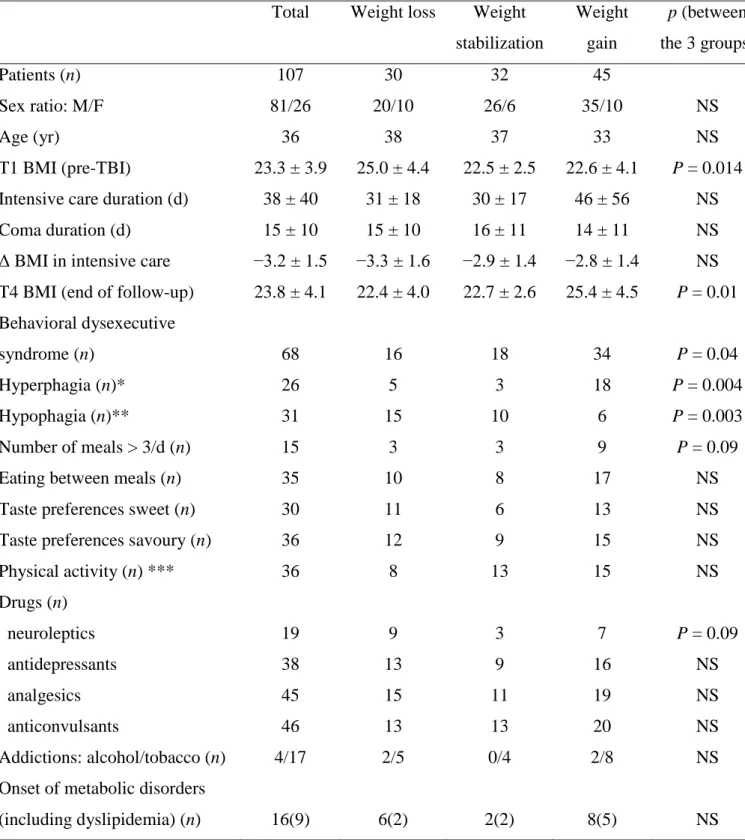
Table 3. Characteristics of patients (n = 107) according to weight change groups at the
409
end of follow-up [38(8-66) months after traumatic brain injury]
410
Total Weight loss Weight stabilization Weight gain p (between the 3 groups) Patients (n) Sex ratio: M/F Age (yr) T1 BMI (pre-TBI)
Intensive care duration (d) Coma duration (d)
Δ BMI in intensive care
T4 BMI (end of follow-up) Behavioral dysexecutive syndrome (n)
Hyperphagia (n)* Hypophagia (n)**
Number of meals > 3/d (n) Eating between meals (n) Taste preferences sweet (n) Taste preferences savoury (n) Physical activity (n) *** Drugs (n) neuroleptics antidepressants analgesics anticonvulsants Addictions: alcohol/tobacco (n) Onset of metabolic disorders (including dyslipidemia) (n) 107 81/26 36 23.3 ± 3.9 38 ± 40 15 ± 10 −3.2 ± 1.5 23.8 ± 4.1 68 26 31 15 35 30 36 36 19 38 45 46 4/17 16(9) 30 20/10 38 25.0 ± 4.4 31 ± 18 15 ± 10 −3.3 ± 1.6 22.4 ± 4.0 16 5 15 3 10 11 12 8 9 13 15 13 2/5 6(2) 32 26/6 37 22.5 ± 2.5 30 ± 17 16 ± 11 −2.9 ± 1.4 22.7 ± 2.6 18 3 10 3 8 6 9 13 3 9 11 13 0/4 2(2) 45 35/10 33 22.6 ± 4.1 46 ± 56 14 ± 11 −2.8 ± 1.4 25.4 ± 4.5 34 18 6 9 17 13 15 15 7 16 19 20 2/8 8(5) NS NS P = 0.014 NS NS NS P = 0.01 P = 0.04 P = 0.004 P = 0.003 P = 0.09 NS NS NS NS P = 0.09 NS NS NS NS NS * defined by an increase of usual food intake compared with pre-TBI (T1); ** defined by a 411
decrease in usual food ingestion compared with pre-TBI (T1) 412
*** According to WHO (World Health Organization) 413
TBI: traumatic brain injury 414
Figure 1: Time course of body mass index in 107 adult traumatic brain injured patients
416 417
P+: weight gain group. P−: weight loss group. P=: weight stabilization group.
418
T1: before traumatic brain injury. T2: end of intensive care. T3: discharge from rehabilitation. 419
T4: end of follow-up. 420
BMI = body mass index 421
423 424 425 426 427 428 429 430 431 432 433 434 435 436 437 438 439 440 441 442 443 18 20 22 24 T1 T2 T3 T4 Global (47 p.) P+ (22 p.) P- (12 p.)P− P= (13 p.) n = 30 P= n = 32 BMI All n = 107 P+ n = 45