HAL Id: halshs-01256600
https://halshs.archives-ouvertes.fr/halshs-01256600
Preprint submitted on 15 Jan 2016
HAL is a multi-disciplinary open access archive for the deposit and dissemination of sci-entific research documents, whether they are pub-lished or not. The documents may come from teaching and research institutions in France or abroad, or from public or private research centers.
L’archive ouverte pluridisciplinaire HAL, est destinée au dépôt et à la diffusion de documents scientifiques de niveau recherche, publiés ou non, émanant des établissements d’enseignement et de recherche français ou étrangers, des laboratoires publics ou privés.
Assessment of Protected Areas Effectiveness on
Deforestation in the Brazilian Amazônia
Eric Nazindigouba Kere, Johanna Choumert, Pascale Combes Motel,
Jean-Louis Combes, Olivier Santoni, Sonia Schwartz
To cite this version:
Eric Nazindigouba Kere, Johanna Choumert, Pascale Combes Motel, Jean-Louis Combes, Olivier Santoni, et al.. Addressing Contextual and Location Biases in the Assessment of Protected Areas Effectiveness on Deforestation in the Brazilian Amazônia. 2016. �halshs-01256600�
C E N T R E D'E T U D E S E T D E R E C H E R C H E S S U R L E D E V E L O P P E M E N T I N T E R N A T I O N A L
SÉRIE ÉTUDES ET DOCUMENTS
Addressing Contextual and Location Biases in the Assessment of
Protected Areas Effectiveness on Deforestation in the Brazilian
Amazônia
Éric N. Kéré
Johanna Choumert
Pascale Combes Motel
Jean-Louis Combes
Olivier Santoni
Sonia Schwartz
Études et Documents n° 2
January 2016
To cite this document:
Kéré E. N., Choumert J., Combes Motel P., Combes J.-L., Santoni O., S. Schwartz (2016)
“Addressing Contextual and Location Biases in the Assessment of Protected Areas Effectiveness on Deforestation in the Brazilian Amazônia”, Études et Documents, n° 2, CERDI.
http://cerdi.org/production/show/id/1777/type_production_id/1 CERDI
65 BD. F. MITTERRAND
63000 CLERMONT FERRAND – FRANCE TEL.+33473177400
FAX +33473177428
2
The authors
Eric N. Kéré
PhD in Economics, Postdoctoral research fellow, CERDI – Clermont Université, Université d’Auvergne, UMR CNRS 6587, F-63009 Clermont-Ferrand. Email: kereneric@yahoo.fr
Johanna Choumert
Senior Research Manager, Economic Development Initiatives (E.D.I.) P.O. Box 393, Bukoba, Kagera region, Tanzania. Email : J.choumert.nkolo@surveybe.com
Pascale Combes Motel
Professor, CERDI – Clermont Université, Université d’Auvergne, UMR CNRS 6587, F-63009 Clermont-Ferrand. Email: P.Motel_Combes@udamail.fr
Jean-Louis Combes
Professor, CERDI – Clermont Université, Université d’Auvergne, UMR CNRS 6587, F-63009 Clermont-Ferrand. Email: J-L.Combes@udamail.fr
Olivier Santoni
Engineer, CERDI and FERDI (Fondation pour les Études et la Recherche sur le Développement International), F-63009 Clermont-Ferrand. Email: olivier.santoni@udamail.fr
Sonia Schwartz
Professor, CERDI - Clermont Université, Université d'Auvergne, UMR CNRS 6587, F- 63009 Clermont Ferrand. Email: Sonia.Schwartz@udamail.fr
Corresponding author: Eric N. Kéré
This work was supported by the LABEX IDGM+ (ANR-10-LABX-14-01) within the program “Investissements d’Avenir” operated by the French National Research Agency (ANR).
Études et Documents are available online at: http://www.cerdi.org/ed
Director of Publication: Vianney Dequiedt Editor: Catherine Araujo Bonjean
Publisher: Mariannick Cornec ISSN: 2114 - 7957
Disclaimer:
Études et Documents is a working papers series. Working Papers are not refereed, they constitute
research in progress. Responsibility for the contents and opinions expressed in the working papers rests solely with the authors. Comments and suggestions are welcome and should be addressed to the authors.
3
Abstract
Using a remotely sensed pixel data set, we develop a multilevel model and propensity score weighting with multilevel data to assess the impact of protected areas on deforestation in the Brazilian Amazon. These techniques allow taking into account location bias, contextual bias and the dependence of spatial units. The results suggest that protected areas have slowed down deforestation between 2005 and 2009, whatever the type of governance. The results also evidence that protected and unprotected areas do not share the same location characteristics. In addition, the effectiveness of protected areas differs according to socioeconomic and environmental variables measured at municipal level.
Keywords
Brazilian Legal Amazon, Protected areas, Deforestation, Impact analysis.
JEL Codes
4
1 Introduction
Protected areas (PAs hereafter) play a critical role in conserving biodiversity and the provision of ecosystem services (Millennium Ecosystem Assessment 2005; Nagendra et al. 2013). They benefit from the support from the international community. The Convention on Biological Diversity (CBD) has committed to a specific set of actions targeted on PAs especially since 2004.
PAs take up a significant part of financial resources devoted to conservation. According to The Economics of Ecosystem and Biodiversity report, an estimated 6.5 to 10 billion USD are devoted to the support of PAs over the world (TEEB 2008, chap.8). Moreover the Global Environment Fund has granted more than 3 billion USD with a 12 billion USD co-financing to terrestrial PAs over the past 24 years (Global Environmental Facility 2015). Even if several authors underlined the significant financial shortfall to manage existing and expand PAs (Bruner et al. 2004), it is essential to assess their effectiveness especially in biodiversity hotspots like the Brazilian Amazonia. This is consistent with the 2011-2020 Strategic Plan for Biodiversity including the Aichi targets, which focuses on the effectiveness of existing terrestrial PAs rather than on further increases in protected areas (Target 11).
Brazil has dramatically increased the surfaces for conservation purposes in the Amazonian forest for several years. According to INPE (Brazilian Institute of Space Research), PAs of various types covered more than 1.2 million square kilometers up to 2012. These PAs have continuously expanded since the beginning of the 2000s. In the meantime, several studies documented a net decrease in deforestation rates. The decrease seems however to be more uncertain since 2012. Scholars do not necessarily agree on the causal link between PAs expansion and the downward dynamics of deforestation. Several authors advocated the role of economic conditions and especially the global financial crisis (Nepstad et al. 2009). Other authors rather put emphasis on the role of public policies (Arima et al. 2014; Cisneros et al. 2015) with a particular interest on PAs (Pfaff et al. 2014; Pfaff et al. 2015) since Brazil has an ancient history with them (Rylands & Brandon 2005).
Aggregate data as from the FAO Forest Resource Assessments or national data from existing censuses are not appropriate to highlight the effect of PAs on deforestation. Deforestation decisions are subject to interactions between decision makers who operate at
5
different administrative levels. For instance, forest dwellers are embedded and influenced by local conditions. There is therefore a need for micro level studies using fine resolution data which are more relevant for impact analyses.1 Satellite imagery provides high resolution data on land uses and therefore enables micro level empirical analyses of deforestation. (Nelson & Geoghegan 2002) underline how important is remotely sensed data for land use analysis. Early examples of such uses are contributions to the determinants of deforestation (e.g. (Chomitz & Gray 1996) on Belize or (Vance & Geoghegan 2002) on Mexico); (Cropper et al. 2001) evidenced that wildlife sanctuaries may have reduced the likelihood of forest clearing in Thailand.
Recent studies on the effectiveness of PAs on deforestation relied on remotely sensed pixel data. (Nelson & Chomitz 2011) studied the impact of PAs on deforestation on a worldwide sample of tropical forest countries while proxying tropical deforestation with the occurrence of forest fires. As for studies dedicated to Latin American countries, authors found a positive impact of PAs on deforestation while controlling for the location bias (Cropper et al. 2001; Joppa & Pfaff 2009). For instance (Andam et al. 2008; Pfaff et al. 2009; Robalino et al. 2015) focused on the well-known protected-area system in Costa Rica. The same methodology was used by (Bray et al. 2008) on the Maya forest of Guatemala and Mexico. Brazil was also intensively studied by (Pfaff et al. 2014) for the state of Acre and (Pfaff et al. 2015) for the entire Legal Amazonia.
From a general point of view, these studies take the location bias into account. They control for the fact that PAs are not randomly distributed i.e. they are more likely to be localized in remote areas with lower agricultural profitability and henceforth the deforestation pressure is lower. Fine scale (pixelised data) combined with hierarchical data (data municipal for instance) however raises other potential biases. They stem from contextual and correlated effects (Manski 1993). Contextual effects mean that several exogenous characteristics at municipal level could have an impact on deforestation decisions at pixel level. Correlated effects mean that pixels belonging to the same municipality share common unobservable characteristics which in turn generate similar deforestation behavior.
1
It refers to the modifiable areal unit problem (MAUP) when the way data is aggregated has an effect of the results.
6
This paper adds to this strand of micro focused literature on the effect of PAs on deforestation in several ways. We take advantage of the hierarchical structure of Brazilian data which are available at pixel and municipal levels. This was done for instance by (Holland et al. 2014) who studied the effect of land tenure on deforestation in the Ecuadorian Amazon. In our paper, contextual and correlated effects are explicitly addressed in addition to location bias. The remotely sensed pixel data set generated from satellite imagery is exhaustive i.e. is not drawn at random. Two complementary estimators are run. Multilevel models allow for taking the hierarchical nature of our data into account. Propensity score weighting with multilevel data allow for comparing treated and untreated pixels with similar location and contextual characteristics. Our main result is that PAs – all categories taken together – allowed avoiding 36,686 square kilometers of deforestation compared to the observed 65,326 over the period 2005-2009.
The rest of the paper is organized as follows. Section 2 presents how the data set was constructed and provides background on the Brazilian conservation policy. Section 3 is devoted to the empirical strategy. Section 4 concludes.
2 Data elaboration and background on the Brazilian Amazonia
A rich data set is constructed on the Brazilian Legal Amazon that combines high resolution data obtained from satellite imagery and municipal data compiled from the agricultural census conducted at municipal level under the auspices of the Brazilian Institute of Geography and Statistics (IBGE: Instituto Brasileiro de Geografia e Estatistica).
2.1 Forest cover
We have built the forest cover and PAs data using remotely sensed pixel data from the PRODES System of the Instituto Nacional de Pesquisa Espacial - INPE (National Institute of Space Research Center). The original 2012 PRODES dataset was downloaded in vector format from INPE's website in Geographic Coordinate System "South American Datum 1969". For the analysis, the dataset was transformed into Projected Coordinate System "SIRGAS 2000 / Brazil Polyconic" (EPSG 5880). INPE's analysis of the original Landsat images produced a dataset with a precision of 60m approximately.
7
We chose to work with information directly measured on the pixels in order to have accurate information on the location (distance to roads, slope, altitude, fertility). As illustrated in Figures 1 and 2, we created square grids with sides measuring 10 km throughout the Legal Amazon with ArcGIS software. Observations are centroids of these grids, therefore we have a unique observation for each pixel. For instance, for each pixel, the data indicate a single class of land cover: forest or protected area or deforestation. Among the pixels obtained, we selected those corresponding to the forest in 2004 which gives 32,569 pixels. The spacing between two pixels reduces the problem of spatial autocorrelation of the error terms (Cropper et al., 2001). Finally, to avoid overestimating the impact of PAs, we removed 4,135 pixels that became PAs after 2004. Deforestation is a binary variable that takes the value of 1 if the pixel was cleared between 2005 and 2009. In other words, a pixel is considered as deforested if it was a forested in 2004 but no longer in 2009. Figure 1 provides a map of pixels distribution in the Brazilian Amazon.
Figure 1. Distribution of pixels across Brazilian Amazônia
Source: INPE and authors’ calculations
Through the ARPA project, Brazil has significantly increased the surface of PAs in the Brazilian Legal Amazon. PAs represented more than 30% of the surface area of the Brazilian Amazon in 2004 and about 44% in 2009. Two thirds of these areas were thus created before 2005, hence we will focus on the impact of the PAs created until 2004 on deforestation from 2005 to 2009. This time lag between the creation of protected areas and measurement
8
deforestation also allows us to avoid a simultaneity bias between deforestation and the creation of PAs. Figure 2 provides a map of protection before and after 2004.
Figure 2. Brazilian Amazônia’s protection before and after 2004
Source: INPE and authors’ calculations
Figure 3 show that after 2004 the Brazilian Amazon experienced a decline in the annual deforestation rate decreased by 75% between 2005 and 2009.
Figure 3. Evolution of protected areas and deforestation in the Brazilian Legal Amazon, square kilometers
Source : INPE, authors’ calculations. Note that protected areas are from federal and state entities but indigenous lands are not included.
The creation of PAs takes into account several criteria including the preservation of biodiversity, the presence of indigenous peoples, land property rights and the pressure on
0 10 000 20 000 30 000 40 000 50 000 60 000 0 200 000 400 000 600 000 800 000 1 000 000 1 200 000 1 400 000 20012002200320042005200620072008200920102011 protected areas (left) deforested areas (right)
9
resources. Three types of protected areas have been defined: integral protection areas, sustainable use areas and indigenous land. Integral protection areas are intended to protect biodiversity and no production activity is allowed. They can be classified in the categories I, II and III of the International Union for Conservation of Nature (IUCN) classification and represented 19% of the surface of PAs in 2004. Then, the sustainable use areas correspond to the categories IV, V, and VI of the IUCN classification. In these areas the production activities are allowed provided natural resources are used sustainably. They represented 36% of PAs in 2004. Finally, the indigenous lands, created at the request of indigenous people to protect their living environments, represented 44% of PAs in 2004. These areas have no equivalent in the IUCN classification. We have therefore three variables for PAs (integral protection areas, sustainable use areas and indigenous lands). For each type of PAs, a pixel is considered as protected area if it was protected in 2004.
We can analyze the representativeness of our sample by comparing some descriptive statistics in our sample with those observed in the Brazilian Amazon. The distribution of land uses in our sample is consistent with what is observed in the Brazilian Legal Amazônia. Indeed, indigenous lands, sustainable use areas and integral protection areas represented in 2004 respectively 20.29%, 10.05% and 6.07% of the forest area of the Amazon and in our sample they represent respectively 20.13%, 8.57% and 5.01% of forest. The rate of deforestation in Amazonia observed between 2005 and 2009 is 2.42% and 2.54 % in our sample.
2.2 Location characteristics
Several studies have shown that the location of the forest can influence the profit obtained from cleared land. Indeed, the profitability of agricultural land depends on fertility, slope and proximity to the nearest road, river and markets (towns). When looking at the descriptive statistics presented in Table 1, we observe that PAs are on average located in high slope areas with low fertility, important rainfall and distant from roads, rivers and town. Thus it is important to consider these factors to properly identify the impact of PAs in terms of avoided deforestation (Pfaff et al., 2014).
10
2.3 Municipal context
Legal Amazon is an administrative division of Brazil with a surface of 5 million sq. km. It includes seven states (Rondonia, Acre, Amazonas, Roraima, Para, Amapa, Tocantins, Mato Grosso, and parts of Maranhão and Goias) and 788 municipalities.
Table 1. Location and municipal level characteristics
Mean Mean-comparison tests
(protected areas vs unprotected areas) Type of areas Unprotected
areas Protected areas (overall) Sustainable use areas Integral protected areas Indigenous lands Deforestation rate 2005-2009 0.0444 0.0027 -0.0385*** -0.0412*** -0.0428*** Location characteristics (measured in 2004) Slope (degree) 0.7615 0.9408 -0.0705*** 0.1982*** 0.2576*** Unsuitable lands (%) 0.0452 0.0919 -0.0425 -0.1239*** -0.1019***
Moderate fertile lands (%) 0.6369 0.6209 0.0143*** -0.0421*** -0.0208***
Very fertile lands (%) 0.3063 0.2798 -0.0173*** -0.0351*** -0.0278***
Distance to the nearest road (km) 151.83 197.07 6.9215*** 33.519*** 60.061*** Distance to the nearest river (km) 93.911 117.30 14.454*** 35.010*** 24.100*** Distance to the nearest town (km) 338.40 446.04 51.337*** 16.788*** 107.64***
Rainfall (millimeters) 1151 1199 31.613*** 64.380*** 49.412***
Municipal context
(average between 2005 and 2009)
Forest cover (%) 74.628 80.277 4.529*** 5.0383*** 6.1338***
GDP per capita (Constant 2000 R$) 4.9175 4.1290 -0.5331*** -0.3152*** -0.9630***
Population density 3.8953 2.8703 1.5394*** -0.8233* -1.9046***
Number of mammal species 164.81 171.62 7.6073*** 11.943*** 5.5778***
Number of pixels 15,012 12,539 2,706 1,582 8,251
Source: authors’ calculations based on IBGE and INPE data. * Significance at 10%, ** Significance at 5%, *** Significance at 1%.
The municipal context of a pixel has a strong chance to influence the likelihood that a pixel is cleared (or protected). Taking these contextual effects (Manski, 1993) into account implies that two pixels sharing the same location characteristics but with a different municipal context do not have the same probability of being cleared. Contextual effects can be captured at the municipal level by explanatory variables measuring the pressure on the resource (population density), the level of wealth (GDP per capita), forest cover and a proxy for biodiversity (the number of mammals). Indeed these species are generally used as umbrellas species (Carroll et al., 2001) and can help to protect others species like amphibians, reptiles, birds or plants species. Omitting contextual effects is a source of bias
11
when assessing the impact of PAs on deforestation. Statistics presented in Table 1 show that, as a matter of fact, PAs are localized in municipalities with high forest cover, high biodiversity, low GDP per capita and low population density.
3 Did protected areas slowdown deforestation in Legal Amazon?
The empirical strategy is implemented in two steps. First, we use multilevel nonlinear models to take into account the hierarchical nature of our data. These models allow us to control for the correlation of observations within the MCAs. Indeed in non-multilevel estimates, not only can this correlation affect the value of the coefficients but also their significance (Rabe-Hesketh and Skrondal, 2008). In these models we control for location characteristics to take into account the location bias. In the second part we use propensity score matching methods that allow for creating a control untreated group with similar location characteristics and municipal contexts when compared to pixels from the treated group.
3.1 Baseline estimates of the effect of protected areas
Land can either be kept forested or cleared for agricultural development purposes. The deforestation decision depends on the net benefit or net present value generated from forest conversion into agricultural lands (e.g. Perman et al 2003 p. 273; Fisher et al. 1972). The decision is either influenced by location characteristics measured at the pixel level (indexed by i) or by contextual characteristics at the municipal level (indexed by j). Characteristics at the pixel level include the status of the pixel which can either be located in a PA or not. Variables that affect the profitability of agriculture and henceforth enter into the net benefit of clearing (slope, distance to roads, etc.) are also measured at the pixel level (see the complete list of variables in table 1). The municipal context is represented by the initial forest cover, GDP, population density and biodiversity.
We thus consider a latent variable 𝑦𝑖𝑗∗ defined as the net present value of forested land conversion of plot i in municipality j that depends on the protection status of the land, the location of features and contextual effects: 𝐼𝑃𝐴𝑖𝑗, 𝑆𝑈𝑖𝑗 and 𝐼𝐿𝑖𝑗 are binary variables representing respectively integral protection areas, sustainable use areas and indigenous
12
lands; location characteristics: 𝑋𝑖𝑗 ; and municipal context: 𝑍𝑗. Since the net present value of forest conversion is not observed, we therefore have:
𝐷𝑒𝑓𝑖𝑗 = 1 if 𝑦𝑖𝑗∗ > 0
𝐷𝑒𝑓𝑖𝑗 = 0 if 𝑦𝑖𝑗∗ ≤ 0
The results of multilevel models can be biased if unobserved heterogeneity at the level of the municipality (𝜇𝑗) is correlated with the explanatory variables. We dealt with this problem by using a within (municipality) transformation of the continuous explanatory variables (i.e. 𝑋𝑖𝑗 − 𝑋̅ ) and the inclusion of their municipal group means (i.e. 𝑋̅𝑗 𝑗) in the regression. The estimated model corresponds to the well-known Mundlak’s model (1978) and averaged variables also capture contextual effects. Therefore the reduced form equation of the probability 𝐷𝑒𝑓𝑖𝑗 is as follows:
𝐷𝑒𝑓𝑖𝑗 = 𝛼1𝐼𝑃𝐴𝑖𝑗 + 𝛼2𝑆𝑈𝑖𝑗 + 𝛼3𝐼𝐿𝑖𝑗 + 𝛽1(𝑋𝑖𝑗 − 𝑋̅𝑗) +
𝛾1𝐼𝑃𝐴̅̅̅̅̅𝑗+ 𝛾2𝑆𝑈̅̅̅̅𝑗+ 𝛾3𝐼𝐿̅𝑗+ 𝛾4𝑋̅𝑗+ 𝛾5𝑍𝑗+ 𝜇𝑗+ 𝑒𝑖𝑗 (1)
where 𝐷𝑒𝑓𝑖𝑗 a binary variable equal to 1 if the pixel i was cleared between 2005 and 2009. The error term (𝜀𝑖𝑗 = 𝜇𝑗+ 𝑒𝑖𝑗) of equation (1) is broken down into two parts. The first component is the unobserved heterogeneity 𝜇𝑗 ∼ 𝑁(0, 𝜎𝜇2), it is specific to each municipality and constant between pixels in the same municipality. The second component 𝑒𝑖𝑗 ∼ 𝑁(0, 𝜎𝑒2) varies between both pixels and municipalities. This decomposition of the error term of the model into its nesting components allows taking into account the spatial correlation of the error term in municipalities (Anselin, 2002; Wendland et al., 2011).
The χ2 statistic of the Hausman test allows accepting the null hypothesis of independence between errors and explanatory variables at the 1% level. Moreover, the statistics of the likelihood ratio test (3.9) between the model without multilevel (restricted model) and unrestricted model (with multilevel model) allows rejecting the null hypothesis of random effects. We then calculate the intra-municipality correlation 𝜌 =𝜎²𝜎²𝜇
𝜇+ 𝜎²𝑒, According to the
result, 24.15% of the total variance in deforestation is explained at the municipal level. Finally, the joint nullity of all coefficients of contextual effects at the 1% level is also rejected. Therefore, the multilevel model is more statistically efficient than fixed effects and can
13
produce policy-relevant estimates while allowing a wider range of research questions to be addressed, for instance, the analyze of the impact of contextual effects.
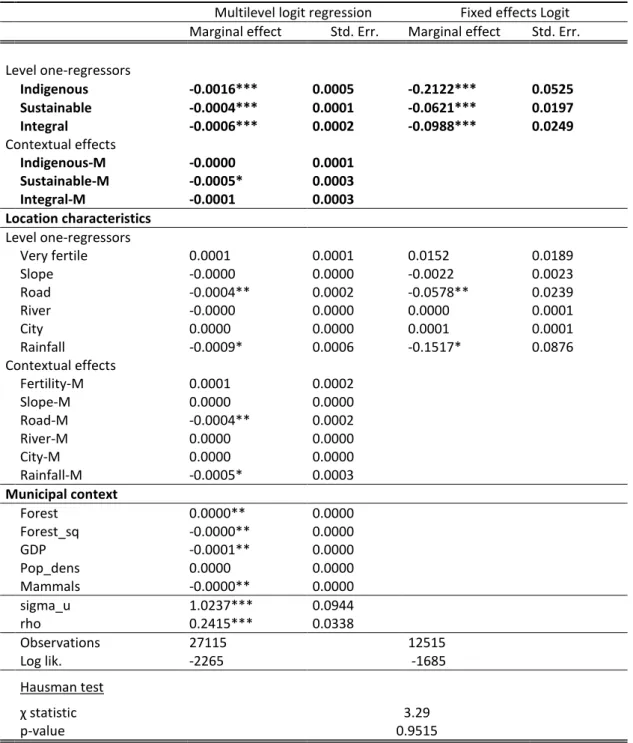
The estimation results are presented in Table A1 in the appendix and the marginal effects in Table 2. Whatever the specification these results show that the parameters associated with PAs variables have a negative and very significant effect on the probability that a pixel is cleared. Based on the marginal effects of the multilevel logit model, we can say that the probability that a pixel is cleared decrease of 0.16 %, 0.04 % and 0.06 % respectively if the pixel is an indigenous lands, a sustainable use area and an integral protection area. Indigenous lands seem more efficient because in all specifications their marginal effect is larger than those of sustainable use areas and integral use areas. The low level of marginal effects can be explained by the low rate of deforestation during the period studied: only 2.54% of the pixels have been cleared.2
Among the characteristics of location, accessibility of the pixel (distance to the nearest road) appears to be the most important determinant. Indeed, the more a pixel is away from the road, the more the probability to be cleared is low: this is the infrastructure effect (Angelsen, 2001). This variable seems to capture the whole effect of accessibility because, the distance to a river or large cities have no impact on deforestation. Rainfall tends to decrease deforestation: too much rain reduces agricultural profitability of the land to cleared. Finally the lack of significant effects of the slope and fertility can be explained by the low variability of these variables. Indeed, the Legal Amazon is mostly composed of fertile areas (92% of the land) with low slope (0.84% in average).
The average of sustainable use areas at the municipal level has a significantly negative impact on deforestation. In other words, sustainable use areas not only help to avoid deforestation at the pixel level but also contribute to reduce the deforestation rate in the municipality. This is a synergy effect. In contrast, the distance to the nearest road and rainfall contribute to reduce deforestation.
As regards the municipal context, forest area is an important factor of deforestation. A large forest area favors deforestation because it is a signal of the abundance of the land and
2
In addition, in the computation of the probability of a positive outcome by the Stata command xtlogit it is assumed that the random and fixed effects are zero.
14
the agricultural potential. However beyond 53% forest in the municipality, the availability of forest area reduces deforestation. Generally municipalities with high forest cover are far from main roads and the main markets. A high level of income per head reduces deforestation. Finally, as expected, a large number of mammal species is associated with lower levels of deforestation.
Table 2. Marginal effects: Deforestation and protected areas
Multilevel logit regression Fixed effects Logit
Marginal effect Std. Err. Marginal effect Std. Err.
Level one-regressors Indigenous -0.0016*** 0.0005 -0.2122*** 0.0525 Sustainable -0.0004*** 0.0001 -0.0621*** 0.0197 Integral -0.0006*** 0.0002 -0.0988*** 0.0249 Contextual effects Indigenous-M -0.0000 0.0001 Sustainable-M -0.0005* 0.0003 Integral-M -0.0001 0.0003 Location characteristics Level one-regressors Very fertile 0.0001 0.0001 0.0152 0.0189 Slope -0.0000 0.0000 -0.0022 0.0023 Road -0.0004** 0.0002 -0.0578** 0.0239 River -0.0000 0.0000 0.0000 0.0001 City 0.0000 0.0000 0.0001 0.0001 Rainfall -0.0009* 0.0006 -0.1517* 0.0876 Contextual effects Fertility-M 0.0001 0.0002 Slope-M 0.0000 0.0000 Road-M -0.0004** 0.0002 River-M 0.0000 0.0000 City-M 0.0000 0.0000 Rainfall-M -0.0005* 0.0003 Municipal context Forest 0.0000** 0.0000 Forest_sq -0.0000** 0.0000 GDP -0.0001** 0.0000 Pop_dens 0.0000 0.0000 Mammals -0.0000** 0.0000 sigma_u 1.0237*** 0.0944 rho 0.2415*** 0.0338 Observations 27115 12515 Log lik. -2265 -1685 Hausman test χ statistic 3.29 p-value 0.9515
* Significance at 10%, ** Significance at 5%, *** Significance at 1%. Level one regressors are indexed by 𝑖 and ; contextual and municipal level regressors are indexed by 𝑗.
15
3.2 Propensity score weighting with multilevel data analysis
Following Pfaff et al. (2014), we use matching methods to better assess the impact of PAs. First, matching methods are nonparametric while in the previous regressions we have assumed a nonlinear relationship between deforestation PAs. Second, matching methods allow comparing the treated and untreated pixels similar in terms of observable characteristics. Finally, they are better adapted to the evaluation of public policies and allow to directly obtain the effect of treatment. However, the hierarchical nature of our data could bias the results of matching methods commonly used. To account for this potential bias we use the techniques of propensity score weighting with multilevel data that include fixed effects or random effects developed by Li et al. (2012).
The propensity score is the probability of being treated given the observable characteristics and is generally estimated using a logistic regression model (See for review Rosenbaum and Rubin 1983; Dehejia and Wahba 2002; Heckman et al. 1998). Let 𝑃𝐴𝑖𝑗 a binary variable equal to 1 if the pixel is a protected area and 0 otherwise. We want to compare a pixel i in the municipality j that is protected to a similar pixel, i.e. having the same individual and contextual characteristics but that is not protected. We compute the Average Treatment on the Treated (ATT): the difference in the probability of being cleared between those treated (Protected areas) and those untreated with the same probability of being treated.
We first estimate the likelihood or propensity score for a pixel to be protected using logit models:
𝑃𝐴𝑖𝑗= 𝜃1(𝑋𝑖𝑗− 𝑋̅ ) + 𝜃𝑗 2𝑋̅𝑗+ 𝜃3𝑍𝑗+ 𝛾𝑗+ 𝜔𝑖𝑗 (2)
with 𝑋𝑖𝑗 location variables measured on the pixels, 𝑍𝑗 contextual variables, 𝛾𝑗 specific effects to municipalities, 𝜔𝑖𝑗 the error term identically and independently distributed. In this equation we exclude PAs explanatory variables because they are endogenous; according to Wooldridge (2009) the use of endogenous variable in matching can make the estimators inconsistent. This propensity score enables building a control group of pixels that is statistically comparable to the set of pixels located in PAs. This counterfactual analysis allows for calculating the effect of PAs in terms of avoided deforestation:
16
𝐴𝑇𝑇 = [𝐷𝑒𝑓𝑖𝑗(1) − 𝐷𝑒𝑓𝑖𝑗(0)| 𝑃𝐴𝑖𝑗 = 1] (3)
We estimate the propensity score equation (Equation 2) for each type of protected area in two ways: i) with a multilevel logit model including the location variables and context variables, ii) and fixed effects logit model with location variables (contextual variables not varying within municipalities disappear). First, we calculate the ATT using the inverse-probability weighting method. This way of calculating allows two pixels having the same observable characteristics to be considered comparable even if they are not in the same municipality. The nonparametric clustered estimator allows for limiting the comparison between pixels of the same municipality. To calculate this effect we first calculate the ATT for each municipality using propensity scores computed with multilevel logit and logit fixed effect model:
𝐴𝑇𝑇𝑗= [𝐷𝑒𝑓𝑖𝑗(1) − 𝐷𝑒𝑓𝑖𝑗(0)| 𝑃𝐴𝑖𝑗= 1] (4)
The ATT of nonparametric clustered estimator is calculated as follows:
𝐴𝑇𝑇𝑐𝑙 =∑ 𝑝𝑗 𝑗𝐴𝑇𝑇̂𝑗 ∑ 𝑝𝑗 𝑗
with 𝑝𝑗 = ∑ 𝑝𝑖 𝑖𝑗 and 𝑝𝑖𝑗 is the probability for a pixel 𝑖 to be a protected area in municipality 𝑗, this probability is calculated as specified in equation 2. Tables A3, A4 and A5 in the appendix report the results of regressions on the determinants of protected areas. 3.2.1 Matched unprotected versus protected areas (by protection type)
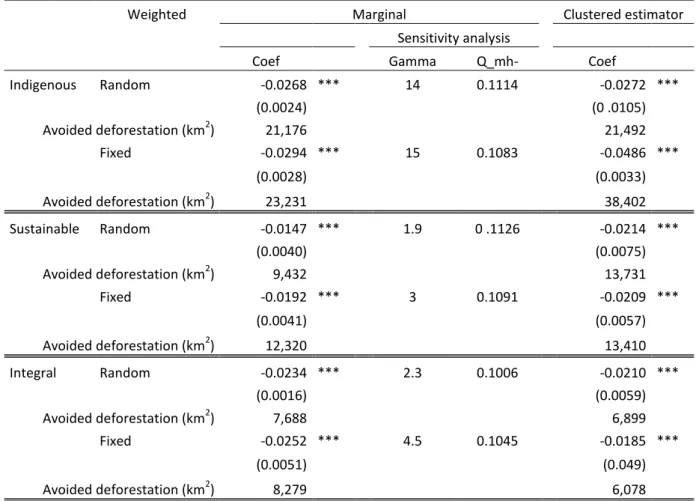
The estimation results are shown in table 3. For all estimation methods used, the results show that whatever the type of PAs, the impact is robust. The impact of indigenous lands in terms of avoided deforestation is more important than the impact of integral protection areas and sustainable use areas. Avoided deforestation is at least 21,176 km2, 9,432 km2 and 6078 km2 respectively by the indigenous areas, sustainable use areas and integral areas; or at least 36,686 km2 of avoided deforestation by all types of protected areas between 2005 and 2009. These results reinforce those obtained in the previous section.
The PSM is essentially based on observable characteristics of pixels. Unobservable characteristics (the lack of important explanatory variables) may bias the results. To analyze the impact of unobserved heterogeneity on our estimates we carry out a sensitivity analysis
17
using the bounding approach proposed by Rosenbaum (2002). For binary outcomes, Aakvik (2001) suggests to use the Mantel and Haenszel (1959) test statistic. The negative selection bias occurs when the pixels most likely to be PAs tend to have lower rates of deforestation even if they were not protected and given that they have the same explanatory variables as the pixels in the comparison group.3 The computation of this test is possible only for the marginal estimator PSM. Based on the assumption of negative bias selection, the tests suggest that our study is insensitive to a bias that would double the odds to be protected area for all specifications. The critical values suggest that our results are very little affected by a hidden bias.
Table 3. Marginal and nonparametric clustered analysis
Weighted Marginal Clustered estimator
Sensitivity analysis
Coef Gamma Q_mh- Coef
Indigenous Random -0.0268 *** 14 0.1114 -0.0272 *** (0.0024) (0 .0105) Avoided deforestation (km2) 21,176 21,492 Fixed -0.0294 *** 15 0.1083 -0.0486 *** (0.0028) (0.0033) Avoided deforestation (km2) 23,231 38,402 Sustainable Random -0.0147 *** 1.9 0 .1126 -0.0214 *** (0.0040) (0.0075) Avoided deforestation (km2) 9,432 13,731 Fixed -0.0192 *** 3 0.1091 -0.0209 *** (0.0041) (0.0057) Avoided deforestation (km2) 12,320 13,410 Integral Random -0.0234 *** 2.3 0.1006 -0.0210 *** (0.0016) (0.0059) Avoided deforestation (km2) 7,688 6,899 Fixed -0.0252 *** 4.5 0.1045 -0.0185 *** (0.0051) (0.049) Avoided deforestation (km2) 8,279 6,078
Bootstrapped standard errors are reported in parenthesis. * Significance at 10%, ** Significance at 5%, *** Significance at 1%. Gamma: odds of differential assignment due to unobserved factors and Q_mh- : Mantel-Haenszel statistic (assumption: underestimation of treatment effect).
3
Given the negative estimated treatment effect, the bounds under the assumption of positive bias selection are somewhat less interesting.
18
3.2.2 Impact of protected areas by establishment's period (before 2000 and between 2000 and 2004)
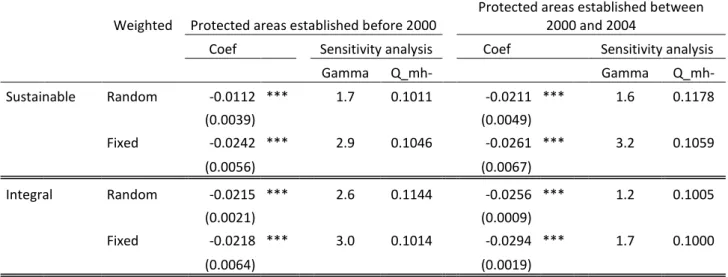
The impact of protected areas should vary according to its creation period for two main reasons. First, from the 2000s, Brazil has undertaken a rigorous policy against deforestation. We can assume that this policy has affected the choice of location of PAs to improve their efficiency. However, one could also think that the older a protected area is, the more restrictions of use are met and efficient.
Regression results shown in Table 4 are from sustainable use and integral protected areas data. The reason is that the creation dates of the indigenous areas are not always available. In addition very few have been created between 2000 and 2004. Those recent PAs are found to be more effective than the old ones. Put differently, the localization of recent PAs seems more important than seniority. Indeed, new PAs have a greater agricultural potential since they are mostly located on fertile lands with a low slope and near the roads.
Table 4. The impact of protected areas by year of establishment
Weighted Protected areas established before 2000
Protected areas established between 2000 and 2004
Coef Sensitivity analysis Coef Sensitivity analysis
Gamma Q_mh- Gamma Q_mh- Sustainable Random -0.0112 *** 1.7 0.1011 -0.0211 *** 1.6 0.1178 (0.0039) (0.0049) Fixed -0.0242 *** 2.9 0.1046 -0.0261 *** 3.2 0.1059 (0.0056) (0.0067) Integral Random -0.0215 *** 2.6 0.1144 -0.0256 *** 1.2 0.1005 (0.0021) (0.0009) Fixed -0.0218 *** 3.0 0.1014 -0.0294 *** 1.7 0.1000 (0.0064) (0.0019)
Bootstrapped standard errors are reported in parenthesis. * Significance at 10%, ** Significance at 5%, *** Significance at 1%. Gamma: odds of differential assignment due to unobserved factors and Q_mh- : Mantel-Haenszel statistic (assumption: underestimation of treatment effect).
3.3 Propensity Score Matching for Multiple treatments
In the previous sections, we assessed separately the impact of each protected area on deforestation. Now, we consider that the protected area variable 𝑃𝐴̆𝑖𝑗 as a polytomous variable that can have one of the following four statuses: 0 for non-protected areas, 1 for indigenous lands, 2 for sustainable use areas or 3 for integral protection areas. The joint estimation of all of these effects improves statistical inference and allows to better define
19
the control group and the comparison group. Thus equation (2) becomes a multinomial logit without specific unobserved heterogeneity to the group but with contextual effects. According to Li et al., (2012), the introduction of contextual effects significantly reduces the bias linked to the hierarchical nature of our data.
𝑃𝐴̆𝑖𝑗 = 𝜃1𝑋𝑖𝑗+ 𝜃2𝑍𝑗+ 𝜔𝑖𝑗
Based on the work of Cattaneo (2010), Wooldridge (2010), Cattaneo et al. (2013), we use the three main existing methods4 to estimate multivalued treatments causal effects: Regression Adjustment (RA), Inverse Probability Weighting (IPW), and Inverse-Probability-Weighted Regression Adjustment (IPWRA). The IPW estimator uses the inverse-probability weights, calculated using the treatment equation (multinomial logit model), to estimate the average treatment effects on the treated (ATETs) for each type of protected areas (𝐴𝑇𝑇 = [𝐷𝑒𝑓𝑖𝑗(1) − 𝐷𝑒𝑓𝑖𝑗(0)| 𝑃𝐴̆𝑖𝑗 = 𝑡]), with t the treatment level of the treated potential outcome. The RA estimator uses separate estimates of deforestation on the explanatory variables to obtain the average of the predicted outcomes for each type of protected areas. The ATETs are obtained by taking the contrasts of the averages of predicted outcomes for each treatment level on the subsample of treated. Finally, using the estimated inverse probabilities (of treatment) weighting with regression adjustment IPWRA estimator allows to compute averages of treatment-level predicted deforestation. ATETs are the contrasts of these averages on the subsample of treated. The results are reported in Table 5. These results confirm the negative impact of PAs on deforestation at the 1% level obtained of separate estimates of the impact of protected areas. Furthermore we show that indigenous lands have been more efficient to avoid deforestation than sustainable use areas and integral protection areas. But we find no significant difference between the efficiency of sustainable use areas and that of integral protection areas.
4
We don’t present Augmented Inverse Probability Weighting (AIPW) because it is not currently possible to compute ATT with this estimator.
20
Table 5. Multivalued treatments analysis
ATET
Regression
Adjustment Inverse Probability
Inverse-Probability-Weighted
Weighting Regression Adjustment
Indigenous vs none -0.0178 *** -0.0242 *** -0.0156 *** (0.0015) (0.0017) (0.0022) Sustainable vs none -0.0141 *** -0.0195 *** -0.0134 *** (0.0019) (0.0022) (0.0019) Integral vs none -0.0154 *** -0.0212 *** -0.0134 *** ( 0.0019) (0.0022) (0.0021) Indigenous vs Sustainable -0.0037 *** -0.0022 *** -0.0046 *** (0.0013) (0.0007) (0.0014) Indigenous vs Integral -0.0024 * -0.0021 ** -0.0030 ** (0.0014) (0.0010) (0.0014) Integral vs Sustainable -0.0013 -0.00006 -0.0016 (0.0019) (0.0018) (0.0020)
Standard errors are reported in parenthesis. * Significance at 10%, ** Significance at 5%, *** Significance at 1%.
4 Concluding remarks
The Brazilian Legal Amazon has already been the subject of numerous studies focusing on the impact of protected areas on deforestation. This paper adds to these studies while innovating on several methodological aspects. First we constructed a new remotely sensed data set constituted of 27,551 forested pixels in 2004 which could either be still forested or cleared in 2009. Second several estimators were implemented in order to control for location and contextual bias induced by the hierarchical structure of our remotely sensed pixel data set.
Multilevel models showed that whatever the specification the parameters associated with protected areas dummies reduced significantly the probability that a pixel is cleared. Moreover it appears that indigenous protected areas are marginally more efficient than sustainable use areas and integral use areas. This is line with previous results suggesting that indigenous lands are more amenable to bring about support from local populations (Nolte et al. 2013).
Propensity score matching confirmed this result while evidencing a 36,686 square kilometers area of avoided deforestation between 2005 and 2009. Moreover recent
21
protected areas are more efficient than older ones because they are mostly located in high deforestation pressure areas. Propensity score matching for multiple treatments do not however evidence a significant difference between the effectiveness of sustainable use and integral protection areas.
Impact analyses of protected areas on deforestation share a common feature. They only focus on the environmental benefits. An important question has not been explored so far that is related to a general cost-benefit analysis. Protected areas have been shown to generate avoided deforestation benefits, but their effects on other aspects such as poverty alleviation or local population welfare and income need more investigation. This would be in line with the so-called environment development dilemma.
22
References
Aakvik, A., 2001. Bounding a matching estimator: The case of a Norwegian training program. Oxford
Bulletin of Economics and Statistics, 63, 115-143.
Angrist, J. D., 2001. Estimation of Limited Dependent Variable Models with Dummy Endogenous Regressors: Simple Strategies for Empirical Practice. Journal of Business & Economic Statistics 19, 2-16.
Angrist, J. D. and Pischke J., 2009. Mostly Harmless Econometrics. Princeton, NJ: Princeton University
Press.
Angelsen A., 2001. Playing Games in the Forest: State-Local Conflicts of Land Appropriation. Land
Economics, 77(2), 289-299.
Anselin, L. (2002). Under the hood: Issues in the specification and interpretation of spatial regression models. Agricultural Economics, 2(27), 247–267.
Carroll, C., Noss, R.F., Paquet, P.C., 2001. Carnivores as focal species for conservation planning in the Rocky Mountain region. Ecological Applications, 11:961-980.
Cattaneo, M. D., 2010. Efficient semiparametric estimation of multi-valued treatment effects under ignorability. Journal of Econometrics Vol.155, 138–154.
Cattaneo, M. D., D. M. Drukker, and Holland A. D., 2013. Estimation of multivalued treatment effects under conditional independence. Stata Journal, Vol 13, 407–450.
Cropper, M., Puri, J. and Griffiths, C., 2001. Predicting the location of deforestation: The role of roads and protected areas in north Thailand. Land Economics, 77 (2), 172-186.
Dehejia, R., Wahba, S., 2002. Propensity score-matching methods for non-experimental causal studies. Review of Economics and Statistics, Vol. 84, 151–161.
Heckman, J., Ichimura, H., Todd, E., 1998. Matching as an econometric evaluation estimator. Review
of Economic Studies, Vol. 65, 261–294.
Li, F., Landrum, M., and Zaslavsky, A. (2013). Propensity score weighting with multilevel data.
Statistics in Medicine, 32(19), 3373–3387.
Mantel, N., & Haenszel, W., 1959. Statistical Aspects of the Analysis of Data from Retrospective Studies of Disease. Journal of the National Cancer Institute, 22(4), 719-748.
Manski, C. F., 1993. Identification of endogenous social effects: the reflection problem. Review of
Economic Studies 60(3), 531–542.
Mundlak, Y., 1978. On the pooling of time series and cross section data. Econometrica 46(1), 69–85. Pfaff, A., Robalino, J., Lima, E., Sandoval, C. and Herrera L.S., 2014. Governance, location and avoided deforestation from protected areas: Greater restrictions can have lower impact, due to differences in location. World Development, 55, 7–20.
23
Rabe-Hesketh, S. and Skrondal, A., 2008. Review of multilevel and longitudinal modeling using stata, second edition. Stata Journal 8(4), 579–582.
Rosenbaum, P.R., 2002. Observational Studies, New York: Springer.
Rosenbaum, P., Rubin, D. 1983. The central role of the propensity score in observational studies for causal effects. Biometrika, Vol. 70, 41–55.
Wendland, Kelly J., Lewis, D. J., Alix-Garcia, J., Ozdogan, M., Baumann, M., & Radeloff, V. C. (2011). Regional- and district-level drivers of timber harvesting in European Russia after the collapse of the Soviet Union. Global Environmental Change, 21(4), 1290–1300.
Wooldridge, J. M., 2009. Should Instrumental Variables be Used as Matching Variables?. Working paper. http://econ.msu.edu/faculty/wooldridge/docs/treat1r6.pdf
Wooldridge, J. M., 2010. Econometric Analysis of Cross Section and Panel Data. 2nd ed. Cambridge, MA: MIT Press.
24
Appendices
Table A1: Deforestation and protected areas
Multilevel logit regression Fixed effects Logit
Coef. Std. Err. Coef. Std. Err.
Level one-regressors Indigenous -3.1083*** 0.3005 -3.0755*** 0.3007 Sustainable -1.0185*** 0.3045 -1.0858*** 0.3029 Integral -1.6518*** 0.489 -1.6579*** 0.4832 Contextual effects Indigenous-M -0.0613 0.4234 Sustainable-M -1.5832*** 0.5924 Integral-M -0.3326 0.9522 Location characteristics Level one-regressors Very fertile 0.2701 0.2849 0.2914 0.2945 Slope -0.0310 0.0414 -0.0398 0.0403 Road -1.1558*** 0.2243 -1.0328*** 0.2319 River -0.0002 0.0013 0.0008 0.0013 City 0.0009 0.001 0.0010 0.001 Rainfall -2.7705** 1.261 -2.7646** 1.3033 Contextual effects 0.3072 Fertlity-M 0.3072 0.6926 Slope-M 0.0883 0.1318 Road-M -1.0274*** 0.3471 River-M 0.0010 0.001 City-M 0.0001 0.0007 Rainfall-M -1.4485** 0.5754 Municipal context Forest 0.0969*** 0.0162 Forest_sq -0.0009*** 0.0002 GDP -0.2067*** 0.0317 Pop_dens 0.0019 0.0014 Mammals -0.0304*** 0.0074 sigma_u 1.0237*** 0.0944 rho 0.2415*** 0.0338 Observations 27115 12515 Log lik. -2265 -1685 Hausman test χ statistic 3.29 p-value 0.9515
25
Table A2: Propensity score equation of indegenous lands
Multilevel logit regression Fixed effects Logit
Coef. Std. Err. Coef. Std. Err.
Location characteristics Level one-regressors Very fertile -0.6539*** 0.1153 -0.6537*** 0.1147 Slope 0.0321** 0.0159 0.0294* 0.0158 Road 0.2038*** 0.0774 0.2003*** 0.0771 River 0.0026*** 0.0006 0.0027*** 0.0006 City -0.0043*** 0.0006 -0.0042*** 0.0006 Rainfall -1.2296** 0.5256 -1.2316** 0.522 Contextual effects Fertlity-M 0.3578 2.1788 Slope-M -0.9508* 0.4943 Road-M 0.0341 0.5042 River-M 0.0061* 0.0034 City-M 0.0045** 0.0019 Rainfall-M -3.8448* 1.983 Municipal context Forest 0.1186* 0.0623 Forest_sq -0.0015*** 0.0005 GDP 0.1002** 0.0508 Pop_dens -0.0130 0.0198 Mammals 0.1286*** 0.0265 sigma_u 0.2538 5.1129 rho 0.7981*** 0.0372 Observations 27115 10339
* Significance at 10%, ** Significance at 5%, *** Significance at 1%.
26
Table A3: Propensity score equation of sustainable use areas
Multilevel logit regression Fixed effects Logit
Coef. Std. Err. Coef. Std. Err.
Location characteristics Level one-regressors Very fertile 0.8961*** 0.1329 0.8038*** 0.1301 Slope 0.0192 0.0249 0.0471** 0.0214 Road 0.5988*** 0.0671 0.6103*** 0.0667 River -0.0033*** 0.0006 -0.0032*** 0.0006 City -0.0050*** 0.0005 -0.0047*** 0.0005 Rainfall 0.1099 0.6985 -0.2967 0.6957 Contextual effects Fertlity-M -4.5530*** 1.0337 Slope-M 0.2573 0.2633 Road-M 1.6055*** 0.4684 River-M 0.0063*** 0.0021 City-M -0.0113*** 0.0016 Rainfall-M 0.7775 1.3347 Municipal context Forest -0.1568*** 0.034 Forest_sq 0.0019*** 0.0003 GDP -0.1068 0.0794 Pop_dens -0.0016 0.0028 Mammals -0.0321* 0.017 sigma_u 2.5657*** 0.1457 rho 0.7981*** 0.0234 Observations 27115 12515
27
Table A4: Propensity score equation of integral protection areas
Multilevel logit regression Fixed effects Logit
Coef. Std. Err. Coef. Std. Err.
Location characteristics Level one-regressors Very fertile -0.6539*** (0.1153) -0.6537*** (0.1147) Slope 0.0321** (0.0159) 0.0294* (0.0158) Road 0.2038*** (0.0774) 0.2003*** (0.0771) River 0.0026*** (0.0006) 0.0027*** (0.0006) City -0.0043*** (0.0006) -0.0042*** (0.0006) Rainfall -1.2296** (0.5256) -1.2316** (0.5220) Contextual effects Fertlity-M 0.3578 (2.1788) Slope-M -0.9508* (0.4943) Road-M 0.0341 (0.5042) River-M 0.0061* (0.0034) City-M 0.0045** (0.0019) Rainfall-M -3.8448* (1.9830) Municipal context Forest 0.1186* (0.0623) Forest_sq -0.0015*** (0.0005) GDP 0.1002** (0.0508) Pop_dens -0.0130 (0.0198) Mammals 0.1286*** (0.0265) sigma_u 2.5986*** (0.2017) rho 0.8034*** 0.0318 Observations 27115 10339