HAL Id: hal-01362216
https://hal.sorbonne-universite.fr/hal-01362216
Submitted on 8 Sep 2016
HAL is a multi-disciplinary open access archive for the deposit and dissemination of sci-entific research documents, whether they are pub-lished or not. The documents may come from teaching and research institutions in France or abroad, or from public or private research centers.
L’archive ouverte pluridisciplinaire HAL, est destinée au dépôt et à la diffusion de documents scientifiques de niveau recherche, publiés ou non, émanant des établissements d’enseignement et de recherche français ou étrangers, des laboratoires publics ou privés.
Dew observed on cars as a proxy for quantitative
measurements
D. Beysens, V. Pruvost, B. Pruvost
To cite this version:
D. Beysens, V. Pruvost, B. Pruvost. Dew observed on cars as a proxy for quantitative measurements. Journal of Arid Environments, Elsevier, 2016, 135, pp.90-95. �10.1016/j.jaridenv.2016.08.014�. �hal-01362216�
DEW OBSERVED ON CARS AS A PROXY FOR QUANTITATIVE MEASUREMENTS
D. Beysens1, 2, V. Pruvost2 and B. Pruvost2 1
Physique et Mécanique des Milieux Hétérogènes, UMR 7636 CNRS - ESPCI - Université Pierre et Marie Curie - Université Paris Diderot, 10 rue Vauquelin, 75005 Paris, France
2
OPUR, 60 rue Emeriau, 75015 Paris (France)
Email: [email protected] ph: +33140795806 fax: +33140794523
Abstract
We describe a simple method to obtain absolute dew determination in any environment, based on observing dew formed at sunrise on cars. Cars are used as dew condensers where dew yield varies on three different parts that nearly all car exhibits: roof top, windshield and window side. The presence or absence of dew at the sunrise at these particular positions provides an observation scale index n with 4 levels, which is used to quantify dew yield. We show that the index n is proportional to the condensed dew volume h (mm) as measured on a standard planar condenser, inclined 30 ° from horizontal, following h=Kn. The validation of this scale and the determination of K (= 0.067 mm within 20-30% uncertainty) is performed with long term experiments in different areas where dew is observed on several cars, either directly weighted on rooftops or calculated from meteo data. This method can thus be of great help to determine without sophisticated measurements or trained observers the dew potential in many places in the world, in particular in arid and semi-arid environment, where dew can help to answer water demand and means to evaluate the dew potential are often limited or lacking.
1. Introduction
Natural dew is an ubiquitous phenomenon: It forms in nearly all part of the world. Its determination is of importance in different areas. In agriculture, dew can either bring moisture to plants (Duvdevani, 1957, 1964; Zangvil, 1996; Malek, 1999; Ninari & Berliner 2002; Kidron et al. 2002; Agam and Berliner, 2006; Berliner et al., 2006; del Campo et al., 2006; del Prado & Sancho 2007; Rao et al. 2009; Limm and Dawson, 2010; Kidron et al., 2011; Zhuang et al., 2012; Kidron and Temina, 2013; Ucles et al., 2013) or favor the development of pathogenic germs (Goheen, 1988; Pitblado et al., 1988; Sriva et al., 1993; Franci et al., 1999; Luo et al., 2000). Dew can have a corrosive action on external structures and even on car paints (Schulz and Trubiroha, 1995). Water brought by dew can be benefital to vegetation; it can be harvested to produce water. It can even become potable water in places where it is cruelly lacking (Nilson et al. 1994; Awanou & Hazoumé, 1997, Sharan, 2006; Nikolayev et
al. 1996; Beysens et al. 2003; Beysens et al. 2007; Sharan et al. 2007; Sharan et al. 2011;
Clus et al. 2013).
Although dew water can be a crucial issue where water is lacking the most, that is, in arid and semi-arid environment there is no real standard way of measuring dew amount. Dew is atmospheric water condensation on a substrate resulting from a nocturnal radiative deficit between atmosphere and substrate. As such, dew yield depends not only on local atmospheric factor (air temperature, air relative humidity, cloud coverage, wind velocity) but also on the precise characteristics of the substrate: infra-red emisivity, shape and orientation with respect to wind and open sky, thermal characteristics, and its precise location (sky view: presence of neighboring constructions or vegetals, etc.) (see e.g. Agam and Berliner, 2006; Tomaszkiewicz et al., 2015; Beysens, 2016). Then, although the environment (tropical, dry, temperate, continental) and sky view will be the same for any condensers at the same location, the precise shape and materials of the condenser do matter, in particular its infra-red emissivity, shape and thermal characteristics. Standard planar condensers of 1m × 1m collection area, inclined 30° from horizontal (which enable water collection by gravity) and thermally insulated from below are currently used (Berkowicz, 2007; Jacobs et al., 2008; Maestre-Valero et al., 2012, Sharan, 2006; Lekouch et al., 2012). Their yield can vary by at least 20% at the same location depending on their orientation as regards to wind direction and nearby obstacles (Lekouch et al., 2012; Clus et al., 2009). Therefore, it is unrealistic to look for dew estimation at a given place with a better accuracy than 20-30%. We thus propose a simplified method that uses cars as condensers and which has the merit to be based on visual
observation only. This method authorizes an accuracy around 30% and could be used to easily obtain dew potential in all part of the world where cars are present.
It is important to realize that using cars as condensers is of general use and is not limited to a particular climate or situation nor the origin of water vapor from which dew condenses (e.g. dew fall or distillation following Monteith, 1957). Measuring dew needs the use of a passive condenser as e.g. the planar, tilted condenser detailed above or, as we propose, a car whose thermal and radiative characteristics to condense dew are similar to those planar condensers. The problem of localization of the car with respect to obstacles, dominant wind direction, etc. and the period of study (seasonality) is the same as with any dew condensers, whose location has to be carefully considered to be representative of the measurements. For instance, in rural areas, the condenser (or car) has to be placed in an open area with large sky view factor. In urban areas, its location has to be carefully chosen to account for desired sky factor (Richards, 2005). The location concern is obviously not dependent on the type of condenser used and applies either to cars.
The method studied here is based on the recognition that cars display all the same specific features than standard dew collectors: (i) horizontal flat roof top, painted and thermally isolated, (ii) 20°-40° inclined non isolated glass windshield and (iii) near vertical, about 70° inclined non isolated glass side windows. The rear window often presents the same inclination than the windshield. Emissivity of glass is high (0.92-0.95), emissivity of paints also (0.92-0.96). On these three different substrates, dew forms with different yields because of distinct angles and variant thermal insulation. Rear windows are not considered as their angle with horizontal vary considerably according to the models. The visual observation of dew occurrence or absence on these different locations on the car can thus provide information on the amount of dew yield. We thereby propose a 4 level scale (n = 0, 1, 2, 3) depending whether dew does not form (n=0), forms on roof top (n=1), windshield (n=2) or side windows (n=3). We show that the nocturnal dew yield h (mm/day) is proportional to n, and determine from experiments the proportionnality constant. It results that the simple observation of dew formation on different parts of a car can give an estimation of the local dew potential, with an accuracy that can be estimated within 20-30%. As a car can be considered as a dew condenser, its range of use and the measurements uncertainty are not dependent on the environment. It only depends on the approximation made with the 4-level scale. Then this uncertainty will remain the same in any environment, including arid and semi-arid environment, as it is the case for any dew condenser.
Note that measurements on car roof top are not dependent on wind direction. Concerning side windows, the effect is averaged on two wind directions and corresponds to using two symmetric standard planar condensers. It is also the case when the windshield and rear windows have the same inclination.
The distinction between dew (water vapor passively condensed) and fog (micrometer liquid water droplets in suspension in the air) can easily be made visually by looking at the atmosphere visibility at the same time that the car is observed. By definition, fog indeed reduces visibility to less than 1 km (Federal Meteorological Handbook (2005)).
The use of simple means (cars) and simple evaluation (one observation per day) by non-experts in arid and semi-arid countries is thus particularly appealing as those countries which, in addition to suffer from water scarcity, quite often lack of financial and intellectual resources, making dew water evaluation a challenging process.
The paper is organized as follows: Firstly, the proportionality between h and n is established, secondly, an experimental procedure to obtain the correlation between h and n is given, and eventually, the data are analysed to give the relationship between h and n.
2. Relation dew yield - observation scale
The nocturnal yield h of a condenser of 1m2 (or similar), inclined at 30° and thermally insulated from below can be written as follows (Beysens, 2016). In its simplest form where the measurement is made once perday, just before sunrise, one gets
(
)
− − × + × − + = 20 0 0 006 1 100 1 exp V V T T . h h d a if positive h= 0 if negative (1)Here Td is dew point temperature and Ta is air temperature and
(
)
[
]
(
1 8)
285 15 273 10 21891 0 04963 1 0132 18 0238893 0 204323 0 1 37 0 4 3 2 2 0 -N/ . T T H . H + . - . - H . H - . + . h d d - + × × × = (2)The parameter H is the site elevation (km); N is the cloud coverage (okta); V is windspeed (m.s-1) at 10m elevation.
The car can be schematized as being constituted with 3 (or 4 when the rear window has the same inclination than the windshield) planar condensers of size on order m2, the roof (R) being horizontal and thermally insulated from below, the windshield (W) being not insulated and making an angle with horizontal of α1 = 30° (±10°, depending on the models) and the side windows (S) being not insulated and making an angle α2 close to 70° with horizontal. Beysens et al. (2003) studied the influence on condenser radiative cooling of angle α with horizontal, using radiative foil thermally isolated with styrofoam or not isolated. Surface temperature was measured and the α-dependence of a performance ratio ∆ was obtained:
a ref a s T T T T − − = ∆ (α) (3)
Here Ts is the surface temperature of the condenser and Tref is the surface temperature of an identical, thermally insulated, horizontal condenser placed aside the condenser under study. Cooling efficiency Ts−Ta and dew water yield are well correlated. As shown in Clus et al., 2009, the dew yield factor h/h0 ∼ ∆. Kidron (2005) also studied dew yield h as a function of tilt angle by weighing cloths attached on wooden boxes. A reduced yield h*= h(α)/h(0°) can
be deduced. The thermal experimental conditions can be considered as intermediate between the non-isolated and isolated cases above as wood thermal conductivity (∼ 0.1 – 0.35 Wm-1
K -1) is significantly larger than Styrofoam (∼ 0.033 Wm-1
K-1) (CRC Handbook of Chemistry and Physics, 2006).
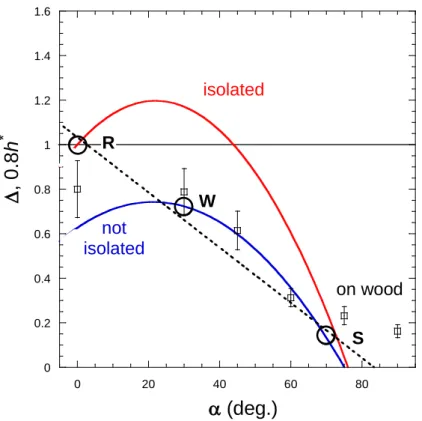
In Fig. 1 are reported the variations with α of ∆ and 0.8h*
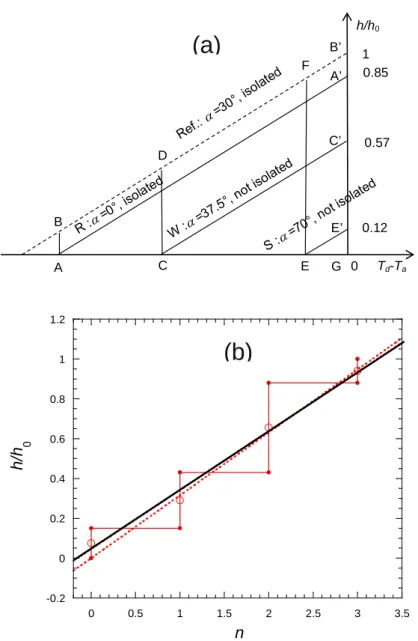
(mean between isolated and non-isolated cases); good agreement is seen between both experimental determinations. The three corresponding observation location on the car (R, W, S; isolated – non-isolated) are also shown in Fig. 1. By taking as reference the maximum yield h0 (α =30°; isolated; ∆ =1.18 ± 0.05), one finds the correspondence between the three levels n=0 (no dew on R, W, S), n=1 (dew on R, no dew on W, S), n=2 (dew on R and W), n=3 (dew on R, W, S). The corresponding values in units of h/h0 are listed in Table 1. They correspond to Fig. 2a where
n=0 corresponds to a reduced dew yield between a very small value ε ≈0 and AB=A’B’=0.15,
CD=C’B’=0.40, that is h/h0 =0.275±0.125. n=2 corresponds to a value between CD and EF=E’B’ (h/h0=0.64±0.24) and n=3, to a value between EF and GB’ (h/h0 = 0.94±0.06). The corresponding values are reported in Table 1. They are used in Fig. 2b where a near linear relationship is revealed between the mean h/h0 and n:
h/h0 = a + bn, (4)
with a =0.05±0.1 and b=0.30±0.05 (error: one standard deviation). Due to the very small a-value one can impose a=0 in the relationship. In that case h/h0 and n become proportional:
h/h0 = bN (5)
with b=0.32±0.03 (error: one standard deviation). Note that the relative uncertainty on h/h0 decreases when n increases, from 100% for n=0 to 6% for n=3.
Fig. 1. Variation with tilt angle α with horizontal of reduced dew yield h*
for cloth on wood (adapted
from Kidron, 2005; see text) and for isolated and non-isolated planar condensers (adapted from Beysens et al., 2003). The bold circles correspond to car roof top (R), windshield (W) and side windows (S) angles. The interrupted line is a guide for the eye.
0 0.2 0.4 0.6 0.8 1 1.2 1.4 1.6 0 20 40 60 80 α (deg.) isolated not isolated ∆ , 0 .8 h * W S R on wood
Fig. 2. (a). Variation of h/h0, the ratio of dew yield h reduced to its value h0 for a thermally isolated plane at 30° from horizontal, as a function of Td-Ta for car rooftop (R), windshield (W), side window (S). (b). Correlation between h/h0 (full circles; mean value: open circles) and n showing proportionality. The interrupted line is a fit to Eq. 4 and the full line a fit to Eq. 5. Td-Ta 0 1 h/h0 0.85 0.57 0.12 C E E’ C’ B’ D F G A B A’
(a)
-0.2 0 0.2 0.4 0.6 0.8 1 1.2 0 0.5 1 1.5 2 2.5 3 3.5 h /h 0 n(b)
Reduced dew yield h/h0 Angle α (deg.) Thermal isolation
Case N level Reduced dew
yield h/h0
1.0±0.05 30 Y Reference (Ref.) - - -
0.85±0.04 0 Y Roof top (R) dew / R 1 0.275±0.125
0.60±0.03 30 N Windshield, rear
window (W)
dew /
T+W
2 0.64±0.24
0.12±0.006 70 N Side window (S) dew /
T+W+S
3 0.94±0.06
no dew / T+W+S
0 0.075±0.075
Table 1. Data used to determine the relation between h/h0 and n, with h0 the maximum dew yield in Fig. 1 (thermally isolated planar condenser at 30° from horizontal).
3. Experiments
Two kinds of experiments on 3 different sites have been performed. In experiment-type 1, which lasted 3 months, correlation between mass collected on rooftops of cars and weighted, was correlated with n as deduced from the observations. In experiment-type 2, only the observation of car was done, on a long term, near 4 years basis. A calculation of the dew yield as based on the theoretical model above Eq. 1 using meteo data was then used to provide the correlation h –n.
Meteo data are taken from internet meteo sites (weather underground and accuweather) at the nearest meteo station from the studied sites. A conversion table (NOAA/NWS, 1998) as indicated in Table 2 is used to relate the sky observation with cloud coverage in okta.
Cloud descriptor data Cloud cover N (okta)
Clear (CLR) 0
Few clouds (FEW) 1-2
Scattered clouds (SCT) 3-4
Broken clouds (BKN) 5-7
Table 2. Cloud descriptor data and equivalent coverage in okta (NOAA/NWS, 1998).
3.1. Experiment-type 1
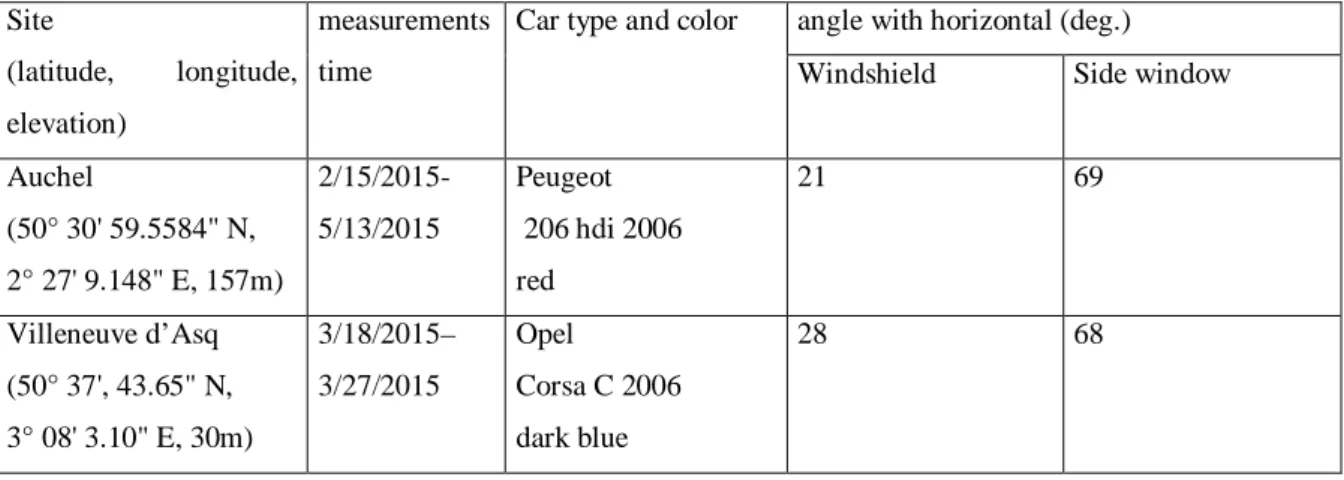
Experiments of dew collection on cars have been performed between Feb. 15, 2015 and May 13, 2015. The observation sites are in open parking lots at Auchel (latitude 50° 30' 59.5584" N, longitude 2° 27' 9.1476" E) and Villeneuve d'Ascq (latitude 50° 37' 43.65" N, longitude 3° 08' 3.10" E) (France). Two cars (Peugeot 206 hdi 2006 at Auchel and Opel Corsa C 2006 at Villeneuve d'Ascq) were used for observation. The window angles are listed in Table 3 together with the sites used and the measurement time.
Observation of dew formation is done just before sunrise. Dew is collected on the roof top by a tissue of 0.25m², which is then weighted with an electronic balance of 0.1g accuracy. The difference of mass between dry and wet tissue gives the dew mass. It corresponds to a measurement uncertainty of about 10-3 mm. Meteo data are from (Auchel) a station located within 2 km (FERFAY2) and at Lille Lesquin airport, within 6km from Villeneuve d'Asq.
3.2. Experiment-type 2
Other measurements are concerned with long term visual observation. They are performed at Le Mesnil-en-Thelle (latitude 49° 10' 41'' N, longitude 02° 17' 10'' E). From Jan.1st, 2011 to Dec. 31st, 2013, observation has been made on a Volskwagen Golf GTI 1991, then, until Sept. 30, 2014, on a Ford Focus break 2009. Another car has been observed during all the course of the experiment, a Renault Scenic 2009. Window angles are listed in Table 3 together with the site characteristics. Meteo data are collected from a station located in Creil (LFPC (07057)), 15 km away from Le Mesnil en Thelle.
Site
(latitude, longitude, elevation)
measurements time
Car type and color angle with horizontal (deg.)
Windshield Side window
Auchel (50° 30' 59.5584" N, 2° 27' 9.148" E, 157m) 2/15/2015-5/13/2015 Peugeot 206 hdi 2006 red 21 69 Villeneuve d’Asq (50° 37', 43.65" N, 3° 08' 3.10" E, 30m) 3/18/2015– 3/27/2015 Opel Corsa C 2006 dark blue 28 68
Le Mesnil-en-Thelle (49° 10' 41'' N, 2° 17' 10'' E, 50m) 1/1/2011- 12/31/2013 Volkswagen Golf GTI 1991 white 34 70 1/1/2014- 9/30/2014 Ford Focus break 2009 grey 30 68 1/1/2011- 9/30/2014 Renault Scenic 2009 black 28 70
Table 3. Characteristics of the studied sites, measurement dates and observed cars.
4. Data analysis
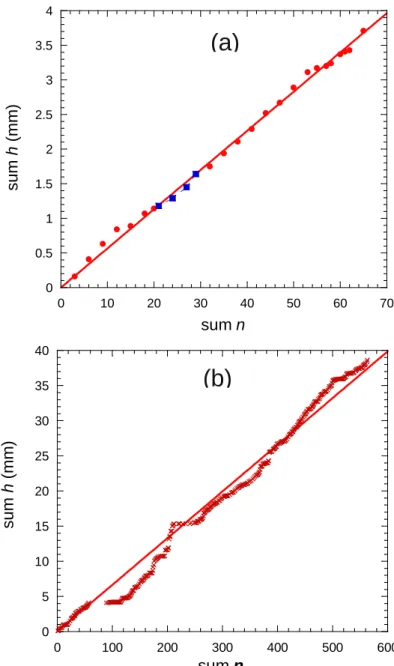
In experiment-type 1 dew mass m collected at the sunrise is converted into daily yew yield h (mm/day) and correlated with scale index n coming from cars observation. In Fig. 3a one sees a good proportionality between the summation of events in h (mm) and n. A fit to
sum h = k sum n (6)
gives k=(5.66 ± 0.03)×10-2
mm (uncertainty: one standard deviation). This factor corresponds to dew forming on a thermally isolated flat plane. When compared to dew forming on a standard collector (isolated plane at 30° from horizontal) a factor 1.2 has to be added. In that case the connection h-n can be written as
h = K n (7)
with K = (6.80 ± 0.04)×10-2 mm.
Fig. 3. (a) Experiment-type 1. Linear correlation between dew collected on roof top of cars, h, and observation scale index, n (see text). Sum corresponds to the summation of daily events. Full circles: Auchel (France) data. Full squares: Villeneuve d’Asq (France) data. (b) Same with experiment-type 2 (Le Mesnil-en-Thelle, France) where h is calculated from Eq.1.
The same kind of correlation (Fig. 3b) can be obtained from experiment-2 data by estimating dew yield on a standard collector (thermally isolated, 30° from horizontal) from Eq. 1 and meteo data. A fit to Eqs. 6-7 gives K=(6.664 ± 0.003)×10-2
mm mm (uncertainty: one standard deviation). This value compares well with the value obtained from mass measurements, K= (6.80 ± 0.04)×10-2 mm. Because of the number of approximations made, the uncertainty can
0 0.5 1 1.5 2 2.5 3 3.5 4 0 10 20 30 40 50 60 70 s u m h (mm ) sum n
(a)
0 5 10 15 20 25 30 35 40 0 100 200 300 400 500 600 sum h (mm ) sum n(b)
be estimated to be within 20-30 % and the correlation factor in Eq. 7 can be eventually estimated as K=(6.7 ± 2)×10-2
mm.
5. Concluding remarks
It appears from that study that simple observation of dew formed at sunrise on cars can give an easy quantitative evaluation of natural dew condensation, independently of the environment (tropical, dry, temperate, continental). Despite the broad range of the measures (the accuracy of measurement, based on a 4-level scale, can be estimated to be within 20-30% tangible accuracy) the relevance of this method lays in the fact that the observation can be performed in nearly all parts of the world with few material needed, and still provide a valuable estimation of the dew potential of wide range of areas, even in remote areas. Another asset of this process is that it can be effortlessly implemented since few time and material are required and that no special skills are mandatory to collect the data, apart from regular observation. That being so, it allows to produce easily a significant amount of data which can help to estimate dew yields in an area without committing a lot of resources and distinguish quickly the potential of action in the place observed, and the necessity or not to carry out further experiments.
It is eventually anticipated that this method could be of great help in many places in the world where water is lacking and dew can help to answer the demand. The plainness of the mode of operation is also a powerful tool in all programs or projects related to raising awareness concerning water issues.
Acknowledgments
We gratefully thank Josué Bulot and Adil Erchouk for measurements at Auchel and Villeneuve d’Asq France). DB acknowledges support from Sorbonne-Paris-Cité Program, France.
References
Agam, N., Berliner, P.,2006. Dew formation and water vapor adsorption in semi-arid environments—a review. Journal of Arid Environments 65, 572-590.
Awanou, C. N., Hazoumè, R. P., 1997. Study of natural condensation of atmospheric humidity. Renewable Energy 10,19–34.
Berkowicz, S., Beysens, D. N., Milimouk, I., Heusinkveld, B., Muselli, M., Jacobs, A., Clus, O., 2007. Urban dew collection in Jerusalem, A three-year analysis. Proceedings of the 4th Conference on Fog, Fog Collection and Dew, Cape Town, South Africa.
Berliner, P. R., Ninari, A., 2006. Dew formation and water vapor adsorption in semi-arid environments. Journal of Arid Environments, 65, 572–590.
Beysens, D., 2016. Estimating dew yield worldwide from a few meteo data. Atmospheric Research 167, 146–155.
Beysens, D., Clus, O., Mileta, M., Milimouk, I., Muselli, M., Nikolayev, V. S., 2007. Collecting dew as a water source on small islands, The dew equipment for water project in Biševo (Croatia). Energy 32, 1032–1037.
Beysens, D., Milimouk, I. Nikolayev, V., Muselli, M., Marcillat, J., 2003. Using radiative cooling to condense atmospheric vapor, a study to improve water yield, Journal of Hydrology 276, 1–11.
Clus, O., Lekouch, I., Muselli, M., Milimouk-Melnytchouk, I., Beysens, D., 2013. Dew, fog and rain water collectors in a village of S-Morocco (Idouasskssou). Desalination and Water Treatment 51, 4235-4238.
Clus, O., Ouazzani, J., Muselli, M., Nikolayev, V. S., Sharan, G., Beysens, D., 2009. Comparison of Various Radiation-cooled Dew Condensers Using Computational Fluid Dynamics, Desalination 249, 707–712.
CRC Handbook of Chemistry and Physics, 2006, 79th ed., (edited by D. R. Lide , CRC Press, Boca Raton, FL).
del Campo, A. D., Navarro, R. M., Aguilella, A., González, E., 2006. Effect of tree shelter design on water condensation and run-off and its potential benefit for reforestation establishment in semiarid climates. Forest Ecology and Management 235, 107-115.
del Prado, R., Sancho, L. G., 2007. Dew as a key factor for the distribution pattern of the lichen Speciesteloschistes Lacunosus in the Tabernas Desert (Spain). Flora-Morphology, Distribution, Functional Ecology of Plants 202, 417-428.
Duvdevani, S., 1964. Dew in Israel and its effect on plants. Soil Science 98,14–21.
Franci, L. J., Panigrahi, S., Chtioui, Y., 1999. Moisture prediction from simple micrometeorological observations. Pyhtopathology 89, 668–672.
Goheen A. C., Pearson, R.C., 1988. Compendium of grape diseases. APS Press, St. Paul, MN, 93pp.
Federal Meteorological Handbook (2005). Number 1: Chapter 8 – Present Weather. Office of the Federal Coordinator for Meteorology, 1-2.
Jacobs, A. F. G., Heusinkveld, B. G., & Berkowicz, S. M., 2008. Passive dew collection in a grassland area, The Netherlands. Atmospheric Research 87, 377-385.
Kidron, G.J., 2005. Angle and aspect dependent dew and fog precipitation in the Negev desert. Journal of Hydrology 301,66–74.
Kidron, G.J., Temina, M., 2013. The effect of dew and fog on lithic lichens along an altitudinal gradient in the Negev Desert. Geomicrobiology Journal 30, 281-290.
Kidron, G.J., Herrnstadt, I., Barzilay, E., 2002. The role of dew as a moisture source for sand microbiotic crusts in the Negev Desert, Israel. Journal of Arid Environments 52, 517-533. Kidron, G.J., Temina, M., Starinsky, A, 2011. An Investigation of the Role of Water (Rain
and Dew) in Controlling the Growth Form of Lichens on Cobbles in the Negev Desert. Geomicrobiology Journal 28, 335-346.
Lekouch, I., Lekouch, K., Muselli, M., Mongruel, A., Kabbachi, B., Beysens, D., 2012. Rooftop dew, fog and rain collection in southwest Morocco and predictive dew modeling using neural networks. Journal of Hydrology 448, 60-72.
Limm, E. B., and Dawson, T. E., 2010. Polystichummunitum (Dryopteridaceae) varies geographically in its capacity to absorb fog water by foliar uptake within the redwood forest ecosystem. American Journal of Botany, 97, 1121–1128
Luo, W., and Goudriaan, J., 2000. Dew formation on rice under varying durations of nocturnal radiative loss. Agric. For. Meteorol. 104, 303–313.
Maestre-Valero, J. F., Ragab, R., Martínez-Alvarez, V., Baille, A., 2012. Estimation of dew yield from radiative condensers by means of an energy balance model. Journal of Hydrology 460-461, 103-109.
Malek, E., McCurdy, G., Giles, B., 1999. Dew contribution to the annual water balances in semi-arid desert valleys. Journal of Arid Environments 42, 71-80.
Monteith, J.L., 1957. Dew. Quarterly Journal of the Royal Meteorological Society, 83. 322-341.
National Oceanic and Atmospheric Administration/National Weather Service (NOAA/NWS). (1998). WSOM D-31, Aviation terminal forecasts (TAF) . Weather service operations manual chapter "D".
Nikolayev, V., Beysens, D., Gioda, A., Milimouka, I., Katiushin, E., Morel, J., 1996. Water recovery from dew. Journal of Hydrology 182, 19-35.
Nilson, T., Varghas, W. E., Nilklasson, G. A., Granqvist, C. G., 1994. Condensation of water by radiative cooling. Renewable Energy 5,310-317.
Ninari, N., Berliner, P. R., 2002. The role of dew in the water and heat balance of bare loess soil in the Negev Desert, Quantifying the actual dew deposition on the soil surface. Atmospheric Research 64, 323-334.
Pitblado, R. E., 1988. The development of a weather timed fungicide spray program for field tomatoes. Can. J. Plant Pathol. 10, 371.
Rao, B., Liu, Y., Wang, W., Hu, C., Dunhai, L., Lan, S., 2009. Influence of dew on biomass and photosystem II activity of cyanobacterial crusts in the Hopq Desert, northwest China. Soil Biology and Biochemistry 41, 2387-2393.
Richards, K., 2005. Urban and rural dewfall, surface moisture, and associated canopy-level air temperature and humidity measurements for Vancouver, Canada. Boundary Layer Meteorology 114, 143-163.
Sharan, G., 2006. Dew Harvest, To Supplement Drinking Water Sources in Arid Coastal Belt of Kutch (Foundation Books Pvt. Ltd., New Delhi).
Sharan, G., Beysens, D., Milimouk-Melnytchouk, I., 2007. A study of dew water yields on galvanized iron roofs in Kothara (north-west India). Journal of Arid Environments 69, 259-269.
Sharan, G., Clus, O., Singh, S., Muselli, M., Beysens, D., 2011. A very large dew and rain ridge collector in the Kutch Area (Gujarat, India). Journal of Hydrology, 405, 171-181.Schulz U., Trubiroha, P., 1995. Der Acid Dew and Fog Testmassgeschneidert für Autolack-Systeme (The acid dew and fog test tailorized for car lacquering). Materialprüfung 37, 250-253.
Sriva, S. B., Pitblado, R. E., Gillespie, T. J., 1993. Using operational weather data to schedule fungicide sprays on tomatoes in southern Ontario. Canada. Am. Meteor. Soc. 32, 567– 573.
Tomaszkiewicz, M., Najm, M. A., Beysens, D., Alameddine, I., El-Fadel, M., 2015. Dew as a Sustainable Non-Conventional Water Resource, A Critical Review. Environ. Rev. 23, 1-18.
Ucles, O., Villagarcía,L., Moro, M. J., Canton Y., Domingo F., 2013. Role of dewfall in the water balance of a semiarid coastal steppe ecosystem. Hydrological. Processes 28 2271– 2280.
Zangvil, A.,1996. Six years of dew observations in the Negev Desert, Israel. Journal of Arid Environments 32 , 361-371.
Zhuang, Y., Ratcliffe, S., 2012. Relationship between dew presence and Bassiadasyphylla plant growth. Journal of Arid Land 4,11–18.