HAL Id: hal-00295551
https://hal.archives-ouvertes.fr/hal-00295551
Submitted on 22 Nov 2004
HAL is a multi-disciplinary open access
archive for the deposit and dissemination of
sci-entific research documents, whether they are
pub-lished or not. The documents may come from
teaching and research institutions in France or
abroad, or from public or private research centers.
L’archive ouverte pluridisciplinaire HAL, est
destinée au dépôt et à la diffusion de documents
scientifiques de niveau recherche, publiés ou non,
émanant des établissements d’enseignement et de
recherche français ou étrangers, des laboratoires
publics ou privés.
Modelling of Mercury in the Arctic with the Danish
Eulerian Hemispheric Model
J. H. Christensen, J. Brandt, L. M. Frohn, H. Skov
To cite this version:
J. H. Christensen, J. Brandt, L. M. Frohn, H. Skov. Modelling of Mercury in the Arctic with the
Danish Eulerian Hemispheric Model. Atmospheric Chemistry and Physics, European Geosciences
Union, 2004, 4 (9/10), pp.2251-2257. �hal-00295551�
Atmos. Chem. Phys., 4, 2251–2257, 2004 www.atmos-chem-phys.org/acp/4/2251/ SRef-ID: 1680-7324/acp/2004-4-2251 European Geosciences Union
Atmospheric
Chemistry
and Physics
Modelling of Mercury in the Arctic with the Danish Eulerian
Hemispheric Model
J. H. Christensen, J. Brandt, L. M. Frohn, and H. Skov
National Environmental Research Institute, Frederiksborgvej 399, 4000 Roskilde, Denmark Received: 19 December 2002 – Published in Atmos. Chem. Phys. Discuss.: 8 July 2003 Revised: 21 October 2003 – Accepted: 8 September 2004 – Published: 22 November 2004
Abstract. A new 3-D mercury model has been developed
within the Danish Arctic Monitoring and Assessment Pro-gramme (AMAP). The model is based on the Danish Eule-rian Hemispheric Model, which in the original version has been used to study the transport of SO2, SO2−4 and Pb into
the Arctic. It was developed for sulphur in 1990 and in 1999 also lead was included. For the current study a chem-ical scheme for mercury has been included and the model is now applied to the mercury transport problem. Some experi-ments with the formulation of the mercury chemistry during the Polar Sunrise are carried out in order to investigate the observed depletion. Some of the main conclusions of the work described in this paper are that atmospheric transport of mercury is a very important pathway into the Arctic and that mercury depletion in the Arctic troposphere during the Polar Sunrise contributes considerably to the deposition of mercury in the Arctic.
1 Introduction
Mercury is a chemical component that has severe effects on humans and animals. It builds up in the food chain and the predators at the top of the food chain can accumulate rather large concentrations in their system. In the Arctic area very large concentrations of mercury have been measured in e.g. humans and polar bears. Therefore the monitoring of mer-cury concentrations as well as the mapping of sources of at-mospheric mercury have become very important. In order to quantify the transport and deposition of mercury to the Arctic it is crucial to know the rate with which the mercury is transported from the air to the ground, i.e. the deposition rate. During the Arctic springtime a depletion in mercury concentrations in the air have been observed at several
Arc-Correspondence to: J. H. Christensen
tic stations, including the Canadian monitoring station Alert. This depletion is quite strong as can be seen in Figs. 6–8. The period where the depletion is present corresponds to the period of the Polar Sunrise, and it has therefore been sug-gested that there must be a connection. A strong depletion is seen during the springtime, corresponding to the period of the Polar Sunrise (see also Schroeder et al., 1998; Lu et al., 2001).
The Danish Eulerian Hemispheric Model (DEHM) is a well documented and well performing 3-dimensional trans-port model, which have been validated on several other species than mercury (see e.g. Barrie et al., 2001, and Chris-tensen, 1997). In the original version the model has been used to study the transport of SO2, SO2−4 and Pb into the
Arctic (see Christensen, 1997 and 1999). The simplified sul-phur model system has been used in the first phase of the AMAP program (see K¨am¨ari et al., 1998). The results with the Pb version were presented at the AMAP workshop on Techniques and Associated Uncertainties in Quantifying the Origin and Long-Range Transport of Toxic Chemicals to the Arctic, Bergen, Norway 14–16 June 1999 (see Christensen, 1999). Furthermore, a photochemical version including 60 species and more than 110 chemical reactions has been de-veloped and validated (see Frohn et al., 2003). Also a CO2
version have been developed (Geels et al., 2004). For the cur-rent study a chemical scheme for mercury has been included, and the model is now applied to the mercury transport prob-lem. Some experiments with the formulation of the mercury chemistry during the Polar Sunrise are carried out in order to investigate the observed depletion.
2252 J. H. Christensen et al.: Modelling of Mercury in the Arctic
9
Figure 1. Overview of the DEHM model system. Both the MM5 model and the DEHM model has nesting
capabilities, and the MM5 model is initialised with data from ECMWF.
ECMWF TOGA data set 2.5 x 2.5 and 12 hour
resolution
o o
Air pollution
model DEHM DEHM nested
Numerical weather forecasts model M 5M
M 5 nestedM
Fig. 1. Overview of the DEHM model system. Both the MM5 model and the DEHM model has nesting capabilities, and the MM5 model is initialised with data from ECMWF.
10
Figure 2. The GKSS chemical scheme used in the mercury model (from Petersen et al., 1998). The red
arrow shows the additional fast oxidation rate of Hg
0to HgO during Polar Sunrise (PS).
gas phase mercury
aqueous phase mercury
dissolved mercury aqueous particulate mercury HgO HgCl2 Hg(part) Hg0 HgO Hg(SO )3 2 2- Hg2+ HgCl2 HgOHCl
HgII(ad.) HgII(ad.) HgII(ad.) Hg(part) O3 O3 PS Soot Soot Soot Cl -SO2 Cl
-Fig. 2. The GKSS chemical scheme used in the mercury model (from Petersen et al., 1998). The red arrow shows the additional fast oxidation rate of Hg0to HgO during Polar Sunrise (PS).
2 Description of the DEHM model system
The system consists of two parts: a meteorological part based on the PSU/NCAR Mesoscale Model version 5 (MM5) mod-elling system (see Grell et al., 1995) and an air pollution model part, the DEHM model, see Fig. 1.
The MM5 model produces the final meteorological
in-put for the DEHM model. Global meteorological data,
used as input to the MM5 mesoscale modelling system, are obtained from the European Centre for Medium-range Weather Forecasts (ECMWF) on a 2.5◦×2.5◦ grid with a time resolution of 12 hours. The MM5 modelling system includes two-way nesting capabilities, and it is therefore possible to perform meteorological model calculations over e.g. the Arctic Ocean or Greenland with higher resolution (150 km→50 km→16.67 km) with a nesting factor of e.g. 3. Nearly 25 years of meteorological data from 1979 to 2003 are available and prepared for the system.
The hydrostatic version of the MM5 model is applied with the following choices of physical parameterisations:
– Mixed Phase (Reisner) explicit moisture scheme – Betts-Miller cumulus scheme
– MRF boundary layer scheme with a 5 layer soil model – Cloud-radiation scheme (Dudhia Scheme)
There are 97×97 horizontal grid points for the mother do-main and 100×100 grid points for the nested dodo-main. The resolution in the mother domain is 150 km and 50 km in the nested domain. There are 20 vertical layers with variable res-olution in the model.
The DEHM model is based on a set of coupled full three-dimensional advection-diffusion equations.
The horizontal mother domain of the DEHM model is de-fined on a regular 96×96 grid that covers most of the North-ern Hemisphere with a grid resolution of 150 km×150 km at 60◦N. The nested domain for Europe is also defined on a regular 96x96 grid with a grid resolution of 50 km×50 km at 60◦N. The nested grid is a sub grid of the EMEP grid (see the web site of the Co-operative Programme for Monitoring and Evaluation of the Long-Range Transmission of Air Pol-lutants in Europe (EMEP) for details concerning the EMEP grid: http://www.emep.int/grid/griddescr.html). The vertical discretisation is defined on an irregular grid with 20 layers up to ≈15 km.
The vertical diffusion is parameterised using a Kzprofile
for the surface layer based on the Monin-Obukhov similarity theory. This Kzprofile is then extended to the whole
bound-ary layer using a simple extrapolation procedure (see Chris-tensen, 1997).
The advection is solved numerically using an Accurate Space Derivatives scheme with non-periodic boundary con-ditions (Frohn et al., 2002) for the horizontal advection and a finite elements scheme for the vertical advection. The dif-fusion is solved using the finite elements scheme. For fur-ther details on the numerical implementation see Christensen (1997) and Christensen (1993) as well as Frohn et al. (2002).
J. H. Christensen et al.: Modelling of Mercury in the Arctic 2253
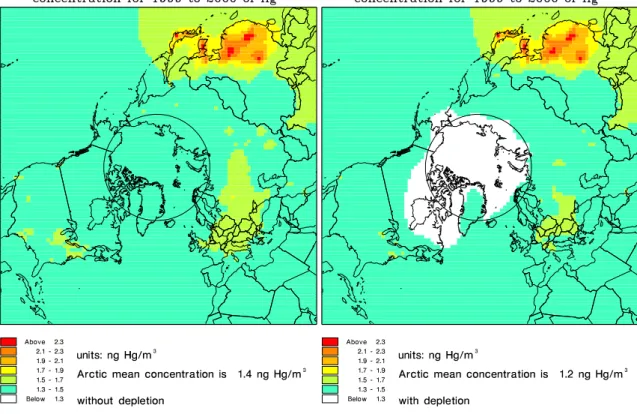
Fig. 3. The concentration of Hg0in ng Hg/m3; without the fast oxidation rate causing Arctic mercury depletion (left) and with the fast oxidation rate (right).
3 The mercury version of DEHM
In the present mercury version of DEHM there are 13 mer-cury species, 3 in gas-phase (Hg0, HgO and HgCl2), 9
species in the aqueous phase and 1 in particulate phase. The emissions of anthropogenic mercury are based on the new global inventory of mercury emissions for 1995 on a 1◦×1◦ grid (Pacyna and Pacyna, 2002). This inven-tory includes emissions of Hg0, reactive gaseous mercury (RGM=the sum of HgCl2and HgO) and particulate mercury.
There are no re-emissions from land and oceans. However, a Hg0background concentration of 1.5 ng/m3is used as initial and boundary conditions.
The chemistry is based on the scheme obtained from the GKSS model, see Fig. 2 and Petersen et al. (1998). The mercury chemistry is depending on the concentrations of O3,
SO2, Cl−and soot. Constant values of Cl−and soot
concen-trations are used, while O3and SO2concentrations are
ob-tained from the photochemical version of DEHM. During the Polar Sunrise in the Arctic an additional fast oxidation rate of Hg0to HgO is assumed in order to simulate the strong de-pletion: Inside the boundary layer over sea ice during sunny conditions it is assumed that there is an additional oxidation rate, which is added to the oxidation rate of elemental mer-cury due to the oxidation by ozone. This fast oxidation rate is depending on the sun angle ranging from no additional rate
for a sun angle at 0◦to a maximum rate at 1/4 h−1, when the
sun angle is higher than 20◦. The fast oxidation stops, when
the surface temperature exceeds −4◦C (based on experience
from Pt. Barrow, Steve Brooks, pers. comm.). Information about sea-ice is obtained from the NCEP re-analysis, and this information is also used as input to the MM5 model system. The value of the maximum rate at 1/4 h−1is based on model studies.
The dry deposition velocities of the reactive gaseous mer-cury species are based on the resistance method, where a surface resistance similar to the surface resistance for HNO3
obtained from the photochemical version of DEHM is used. The dry deposition velocity for particulate Hg is similar to the deposition velocity for sulfate (see Christensen, 1997). The wet deposition of reactive gaseous as well as particulate mercury is parameterized using a simple scavenging coeffi-cients formulation with different in-cloud and below-cloud scavenging coefficients (see Christensen, 1997). The wet re-moval rates for all aqueous species are similar to the rates for sulfate.
2254 J. H. Christensen et al.: Modelling of Mercury in the Arctic
Fig. 4. The concentration of RGM (=Hg(II)) in pg Hg/m3; without the fast oxidation rate causing Arctic mercury depletion (left) and with the fast oxidation rate (right).
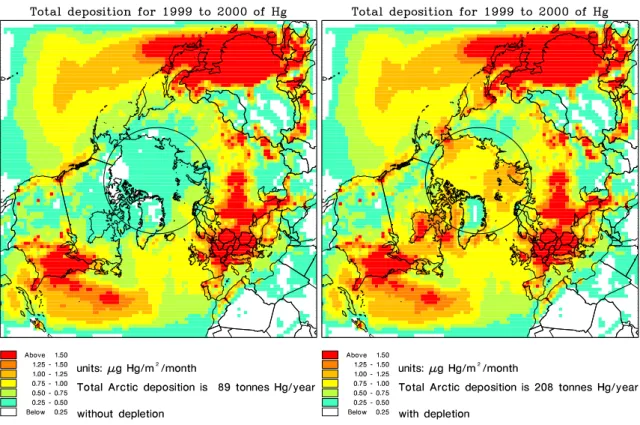
Fig. 5. The total deposition of mercury in µg Hg/m2/month; without the fast oxidation rate causing Arctic mercury depletion (left) and with the fast oxidation rate (right).
J. H. Christensen et al.: Modelling of Mercury in the Arctic 2255
Fig. 6. Station Nord: Top panel shows a comparison of observed (blue curve) and calculated daily mean concentrations of Hg0with two model versions; one without depletion (red) and one with de-pletion (black). Middle panel shows the calculated total particulate mercury and the bottom panel shows the calculated total reactive gaseous mercury.
4 Results
The mercury version of the DEHM model has been run for the mother domain for the period from October 1998 to De-cember 2000. The mean concentration of Hg0for two differ-ent runs, one without the fast oxidation rate causing Arctic mercury depletion and one with the fast oxidation rate are shown in Fig. 3. The highest levels of Hg0are obtained in Asia, while the concentrations for Europe and North America is only slightly above the background level of 1.5 ng Hg/m3. The depletion phenomena have large influence on the mean concentrations in the Arctic and only minor influence outside the Arctic.
The mean concentrations of Reactive Gaseous Mercury (RGM) are shown in Fig. 4 for the two different runs. For the run without depletion the highest levels are over emis-sion areas in North America, Europe and Asia. For the model run with depletion, high concentrations of RGM are seen in the whole Arctic, especially over Hudson Bay and the near coastal areas over the Arctic Ocean.
The dry deposition velocity of RGM is very high and therefore the very high concentrations of RGM result in a dramatically increased deposition of mercury, which is
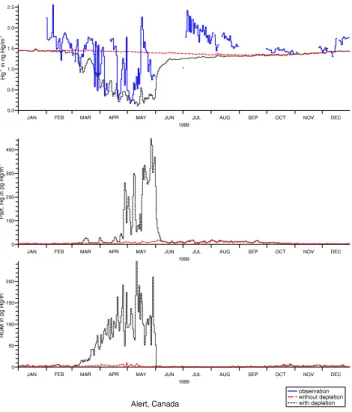
Fig. 7. Alert, Canada: Top panel shows a comparison of observed (blue curve) and calculated daily mean concentrations of Hg0with two model versions; one without depletion (red) and one with de-pletion (black). Middle panel shows the calculated total particulate mercury and the bottom panel shows the calculated total reactive gaseous mercury.
shown in Fig. 5. This example shows the importance of the Arctic mercury depletion for the total deposition of mercury in the Arctic area. The total deposition increases across the entire Arctic area as well as surrounding areas. According to the model runs performed in this study the total deposition of mercury increases from 89 to 208 tons pr. year for the area north of the Polar Circle due to the depletion.
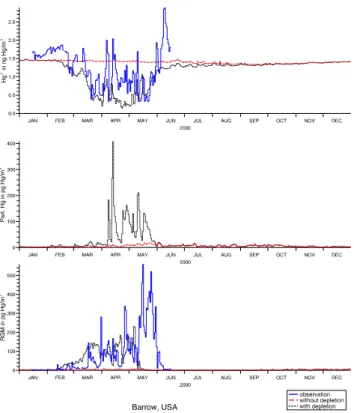
For the Arctic areas the model results have been com-pared to measurements from Station Nord in North Eastern Greenland for the years 1999–2001, Alert in Canada for the year 1999 and Barrow in Alaska for the year 2000. The results show that there is quite good general agreement be-tween calculated and observed concentrations of elemental mercury (Hg0)for all three places (Figs. 6–8). Calculated concentrations of RGM as well as particulate mercury are also shown on the figures, and it can be seen that the levels of these species increase considerably during the depletion pe-riod. Measured concentrations of RGM at Barrow are shown on Fig. 8, and there again quite good general agreement is seen between the measured and calculated concentrations of RGM. An exception is the period from the middle of May to June, where the calculated concentrations of RGM are nearly zero, while the measured concentrations are high. The
2256 J. H. Christensen et al.: Modelling of Mercury in the Arctic
Fig. 8. Barrow, Alaska: Top panel shows a comparison of observed (blue curve) and calculated daily mean concentrations of Hg0with two model versions; one without depletion (red) and one with de-pletion (black). Middle panel shows the calculated total particu-late mercury and the bottom panel shows a comparison of observed (blue curve) and calculated total reactive gaseous mercury (black curve).
figures emphasise the importance of including the depletion process when calculating Hg concentrations and depositions in the Arctic areas.
5 Conclusions and plans for the future
A new hemispheric mercury model based on the Danish Eu-lerian Hemispheric Model System (DEHM) has been pre-sented. The model system includes a meteorological model, MM5, and a three-dimensional air pollution model (DEHM). The chemistry is based on the scheme from the GKSS mer-cury model with some additional parameterizations of the very fast oxidation of Hg0during the Polar Sunrise. The cur-rent version does not include re-emissions and natural emis-sions of mercury, which both are very important sources. In-stead a concentration of Hg0on 1.5 ng/m3is used as initial
and boundary conditions.
The model results for the Arctic have been compared with measurements in the Arctic, and there are reasonable agree-ments between observed and calculated concentrations. The model is able to reproduce the general patterns due to the de-pletion during the Polar Sunrise. The model has been used to
make the first quantitative estimate of the importance of the mercury depletion in the Arctic troposphere during the Polar Sunrise for the deposition of mercury in the Arctic. The re-sults from the model shows, that the total deposition of mer-cury increases with more than a factor 2 from 89 tonnes to 208 tonnes pr year for the area north of the Polar Circle.
Plans for the future work is:
– Continue the work with the parameterization of
back-ground chemistry, coupling with aqueous chemistry and other oxidation pathways of Hg0.
– Improve the parameterization of Arctic chemistry,
cou-pling with GOME measurements of BrO (see Richter et al., 1998), coupling with measurements of mercury in the Arctic in order to understand the spatial and tempo-ral distribution of the depletion.
– Coupling of mercury chemistry with a soot model. – Re-emissions from oceans, sea-ice and landsurfaces. – Further validation of the model system.
Acknowledgements. S. Brooks (Oak Ridge Associated Universi-ties, USA) and S. Lindberg (Oak Ridge National Laboratory, USA) are acknowledged for the measurements from Barrow, Alaska. B. Schroeder (Environment Canada) is acknowledged for the measure-ments from Alert, Canada.
The model work is financially supported by the Danish Environ-mental Protection Agency with means from the MIKA/DANCEA funds for Environmental Support to the Arctic Region.
Edited by: M. Heimann
References
Barrie, L. A , Li, Y. , Lohmann, U. , Leaitch, W. R. , Kasibhatla, P., Roelofs, G.J., Wilson, J., McGovern, F., Benkovitz, C., Me-liere, M. A., Law, K., Prospero, J., Kritz, M., Bergmann, D., Bridgeman, C., Chin, M., Christensen, J., Easter, R., Feichter, J., Jeuken, A., Kjellstrom, E., Koch, D., Land, C., Rasch, P: A comparison of large scale atmospheric sulphate aerosol models (cosam): overview and highlights, Tellus, 53B, 615–645, 2001. Christensen, J.: Testing Advection schemes in a Three Dimensional
Air Pollution Model, Mathl. Comput. Modelling, 18, 75–88, 1993.
Christensen, J.: Transport of Air Pollution in the Troposphere to the Arctic. PhD thesis. National Environmental Research Institute, DK-4000 Roskilde, Denmark, pp. 377, 1995.
Christensen, J.: The Danish Eulerian Hemispheric Model – a three-dimensional air pollution model used for the Arctic, Atmos. En-viron. 31, 4169–4191, 1997.
Christensen, J.: An overview of modelling the Arctic mass budget of metals and sulphur: Emphasis on source apportionment of at-mospheric burden and deposition, in: Modelling and Sources: A Workshop on Techniques and Associated Uncertainties in Quan-tifying the Origin and Long-Range Transport of Contaminants to the Arctic. Report and extended abstracts of the workshop, Bergen, 14–16 June 1999, Annex 15, 1–5, 1999.
J. H. Christensen et al.: Modelling of Mercury in the Arctic 2257
Frohn, L. M., Christensen, J. H., and Brandt, J.: Development of a High-Resolution Nested Air Pollution Model – The Numerical Approach, J. Comput. Phys., 179, 1, 68–94, 2002.
Frohn, L. M., Christensen, J. H., Brandt, J., Geels, C., and Hansen K. M.: Validation of a 3-D hemispheric nested air pollution model, Atmos. Chem. Phys. Discuss., 3, 3543–3588, 2003, SRef-ID: 1680-7375/acpd/2003-3-3543.
Geels, C., Doney, S., Dargaville, R., Brandt, J., and Christensen, J. H.: Deconvolving the sources of synoptic variability in contin-uous atmospheric CO2measurements over the Northern Hemi-sphere continents – a mesoscale model study, Tellus, 56B, 35–50, 2004.
Grell, G. A., Dudhia J., and Stauffer D. R.: A Description of the Fifth-Generation Penn State/NCAR Mesoscale Model (MM5), NCAR/TN-398+STR, NCAR Technical Note, June 1995, Mesoscale and Microscale Meteorology Division, Na-tional Center for Atmospheric Research, Boulder, Colorado, pp. 122, 1995.
K¨am¨ari, J., Joki-Heiskala, P., Christensen, J., Degerman, E., Derome, J., Hoff, R., and K¨ahk¨onen, A.-M.: Acidifying Pollu-tants, Arctic Haze, and Acidifications in the Arctic, Chapter 9 in: AMAP Assesment Report: Arctic Pollution Issues. Arctic Moni-toring and Assessment Programme (AMAP), edited by: Wilson, S., Murray, J., and Huntington, H., 621–659, 1998.
Lu, J. Y, Schroeder, W. H., Barrie, L. A., Steffen, A., Welch, H. E., Martin, K., Lockhart, W. L., Hunt, R. V., Boila, G., Richter, A.: Magnification of atmospheric mercury deposition to polar regions in springtime: the link to tropospheric ozone depletion chemistry, Geophys. Res. Lett., 28, 3219–3222, 2001.
Pacyna, E. G. and Pacyna, J. M.: Global emission of mercury from anthropogenic sources in 1995, Water, Air, and Soil Pollution, 137, 143–165, 2002.
Petersen, G., Munthe, J., Pleijel, K., Bloxam, R., and Vinod Kumar, A.: A comprehensive eulerian modeling framework for airborne mercury species: development and testing of the tropospheric chemistry module (TCM), Atmos. Environ. 32, 829–843, 1998. Richter, A., Wittrock, F., Eisinger, M., and Burrows, J. P.:
GOME observations of tropospheric BrO in Northern Hemi-spheric spring and summer 1997, Geophys. Res. Lett., 25, 2683– 2686, 1998.
Schroeder, W. H., Anlauf, K. G., Barrie, L. A., Lu, J. Y., Steffen, A., Schneeberger, D. R., and Berg, T.: Arctic springtime depletion of mercury, Nature, 394, 331–332, 1998.