HAL Id: hal-00301141
https://hal.archives-ouvertes.fr/hal-00301141
Submitted on 8 Jul 2003HAL is a multi-disciplinary open access archive for the deposit and dissemination of sci-entific research documents, whether they are pub-lished or not. The documents may come from teaching and research institutions in France or abroad, or from public or private research centers.
L’archive ouverte pluridisciplinaire HAL, est destinée au dépôt et à la diffusion de documents scientifiques de niveau recherche, publiés ou non, émanant des établissements d’enseignement et de recherche français ou étrangers, des laboratoires publics ou privés.
Modelling of mercury with the Danish Eulerian
Hemispheric Model
J. H. Christensen, J. Brandt, L. M. Frohn, H. Skov
To cite this version:
J. H. Christensen, J. Brandt, L. M. Frohn, H. Skov. Modelling of mercury with the Danish Eulerian Hemispheric Model. Atmospheric Chemistry and Physics Discussions, European Geosciences Union, 2003, 3 (4), pp.3525-3541. �hal-00301141�
ACPD
3, 3525–3541, 2003Modelling of Mercury with the Danish Eulerian Hemispheric Model J. H. Christensen et al. Title Page Abstract Introduction Conclusions References Tables Figures J I J I Back Close Full Screen / Esc
Print Version Interactive Discussion
© EGU 2003
Atmos. Chem. Phys. Discuss., 3, 3525–3541, 2003 www.atmos-chem-phys.org/acpd/3/3525/
© European Geosciences Union 2003
Atmospheric Chemistry and Physics Discussions
Modelling of mercury with the Danish
Eulerian Hemispheric Model
J. H. Christensen, J. Brandt, L. M. Frohn, and H. Skov
National Environmental Research Institute, Frederiksborgvej 399, 4000 Roskilde, Denmark
Received: 19 December 2002 – Accepted: 27 June 2003 – Published: 8 July 2003 Correspondence to: J. H. Christensen ([email protected])
ACPD
3, 3525–3541, 2003Modelling of Mercury with the Danish Eulerian Hemispheric Model J. H. Christensen et al. Title Page Abstract Introduction Conclusions References Tables Figures J I J I Back Close Full Screen / Esc
Print Version Interactive Discussion
© EGU 2003
Abstract
A new 3-D mercury model has been developed within the Danish Arctic Monitoring and Assessment Programme (AMAP). The model is based on the Danish Eulerian Hemi-spheric Model, which in the original version has been used to study the transport of SO2, SO2−4 and Pb into the Arctic. It was developed for sulphur in 1990 and in 1999
5
also lead was included. For the current study a chemical scheme for mercury has been included and the model is now applied to the mercury transport problem. Some experiments with the formulation of the mercury chemistry during the Polar Sunrise are carried out in order to investigate the observed depletion. Some of the main conclu-sions of the work described in this paper are that atmospheric transport of mercury is
10
a very important pathway into the Arctic and that mercury depletion in the Arctic tropo-sphere during the Polar Sunrise contributes considerably to the deposition of mercury in the Arctic.
1. Introduction
Mercury is a chemical component that has severe effects on humans and animals. It
15
builds up in the food chain and therefore the predators at the top of the food chain can accumulate rather large concentrations in their system. In the Arctic area very large concentrations of mercury have been measured in e.g. humans and polar bears. Therefore the monitoring of mercury concentrations as well as the mapping of sources of atmospheric mercury have become very important. In order to quantify the transport
20
and deposition of mercury to the Arctic it is crucial to know the rate with which the mer-cury is transported from the air to the ground, i.e. the deposition rate. During the Arctic springtime a depletion in mercury concentrations in the air have been observed at sev-eral Arctic stations, including the Canadian monitoring station Alert. This depletion is quite strong as can be seen in Figs. 6–8. The period where the depletion is present
25
ACPD
3, 3525–3541, 2003Modelling of Mercury with the Danish Eulerian Hemispheric Model J. H. Christensen et al. Title Page Abstract Introduction Conclusions References Tables Figures J I J I Back Close Full Screen / Esc
Print Version Interactive Discussion
© EGU 2003
that there must be a connection. A strong depletion is seen during the springtime, cor-responding to the period of the Polar Sunrise (see also Schroeder et al., 1998; Lu et al., 2001).
The Danish Eulerian Hemispheric Model (DEHM) is a well-tested 3-D atmospheric transport model. The general purpose of the model is to study the long-range transport
5
of tropospheric pollutants into the Arctic. The model is based on the Danish Eulerian Hemispheric Model, which in the original version has been used to study the transport of SO2, SO2−4 and Pb into the Arctic (see Christensen, 1997 and 1999). The simplified sulphur model system has been used in the first phase of the AMAP program (see K ¨am ¨ari et al., 1998). The results with the Pb version were presented at the AMAP
10
workshop on Techniques and Associated Uncertainties in Quantifying the Origin and Long-Range Transport of Toxic Chemicals to the Arctic, Bergen, Norway 14–16 June 1999 (see Christensen, 1999). Furthermore, a photochemical version including 60 species and more than 110 chemical reactions has been developed (see Frohn et al., this issue). For the current study a chemical scheme for mercury has been included,
15
and the model is now applied to the mercury transport problem. Some experiments with the formulation of the mercury chemistry during the Polar Sunrise are carried out in order to investigate the observed depletion.
2. Description of the DEHM model system
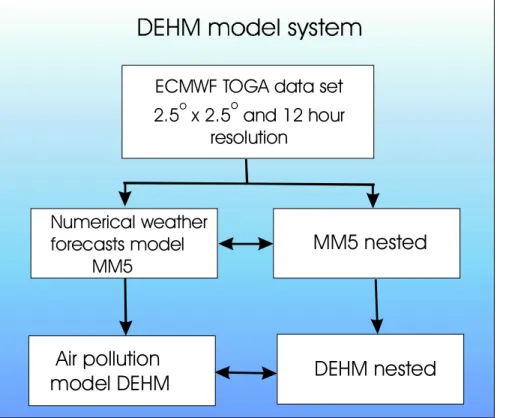
The system consists of two parts: a meteorological part based on the PSU/NCAR
20
Mesoscale Model version 5 (MM5) modelling system (see Grell et al., 1995) and an air pollution model part, the DEHM model, see Fig. 1.
The MM5 model produces the final meteorological input for the DEHM model. Global meteorological data, used as input to the MM5 mesoscale modelling system, are ob-tained from the European Centre for Medium-range Weather Forecasts (ECMWF) on a
25
2.5◦× 2.5◦grid with a time resolution of 12 h. The MM5 modelling system includes two-way nesting capabilities, and it is therefore possible to perform meteorological model
ACPD
3, 3525–3541, 2003Modelling of Mercury with the Danish Eulerian Hemispheric Model J. H. Christensen et al. Title Page Abstract Introduction Conclusions References Tables Figures J I J I Back Close Full Screen / Esc
Print Version Interactive Discussion
© EGU 2003
calculations over e.g. the Arctic Ocean or Greenland with higher resolution (150 km → 50 km → 16.67) with a nesting factor of e.g. 3. 23 years of meteorological data from 1979 to 2001 are available, but the MM5 modelling system for the mother domain has currently been run for a period of 11 years from 1990 to 2001. The MM5 modelling system with one nest has been run for the period 1995-2001 for Europe (50 km) and
5
January 1991 for Greenland (50 km) for demonstration purposes.
The hydrostatic version of the MM5 model is used with the following choices of phys-ical parameterisations:
– Mixed Phase (Reisner) explicit moisture scheme, – Betts-Miller cumulus scheme,
10
– MRF boundary layer scheme with a 5 layer soil model, – Cloud-radiation scheme (Dudhia Scheme).
There are 97 × 97 horizontal grid points for the mother domain and 100 × 100 grid points for the nested domain. The resolution in the mother domain is 150 km and 50 km in the nested domain. There are 20 vertical layers with variable resolution in the model.
15
The DEHM model is based on set of coupled full three-dimensional advection-diffusion equations. The horizontal mother domain of the DEHM model is defined on a regular 96 × 96 grid that covers most of the Northern Hemisphere with a grid reso-lution of 150 km × 150 km at 60◦N. The nested domain for Europe is also defined on a regular 96x96 grid with a grid resolution of 50 km × 50 km at 60◦N. The nested grid
20
is a sub grid of the EMEP grid (see the web site of the Co-operative Programme for Monitoring and Evaluation of the Long-Range Transmission of Air Pollutants in Europe (EMEP) about the EMEP grid: http://www.emep.int/grid/griddescr.html). The vertical discretization is defined on an irregular grid with 20 layers up to ≈ 15 km.
The vertical diffusion is parameterised using a Kz profile for the surface layer based
25
on the Monin-Obukhov similarity theory. This Kz profile is then extended to the whole boundary layer using a simple extrapolation procedure (see Christensen, 1997).
ACPD
3, 3525–3541, 2003Modelling of Mercury with the Danish Eulerian Hemispheric Model J. H. Christensen et al. Title Page Abstract Introduction Conclusions References Tables Figures J I J I Back Close Full Screen / Esc
Print Version Interactive Discussion
© EGU 2003
The advection is solved numerically using an Accurate Space Derivatives scheme with non-periodic boundary conditions (Frohn et al., 2002) for the horizontal advection and a finite elements scheme for the vertical advection. The diffusion is solved using the finite elements scheme. For further details on the numerical implementation see Christensen (1997) and Christensen (1993) as well as Frohn et al. (2002).
5
3. The mercury version of DEHM
In the present mercury version of DEHM there are 13 mercury species, 3 in gas-phase (Hg0, HgO and HgCl2), 9 species in the aqueous phase and 1 in particulate phase.
In the current version the emissions of anthropogenic mercury are based on the new global inventory of mercury emissions for 1995 on a 1◦× 1◦ grid (Pacyna and Pacyna,
10
2002). This inventory includes emissions of Hg0, reactive gaseous mercury (RGM = the sum of HgCl2 and HgO) and particulate mercury. There are no re-emissions from land and oceans. However, a Hg0 background concentration of 1.5 ng/m3 is used as initial concentrations and boundary conditions.
The chemistry is based on the scheme obtained from the GKSS model, see Fig. 2
15
and Petersen et al. (1998). The mercury chemistry is depending on the concentra-tions of O3, SO2, Cl− and soot. Constant values of Cl− and soot concentrations are used, while O3 and SO2 concentrations are obtained from the photochemical version of DEHM. During the polar sunrise in the Arctic an additional fast oxidation rate of Hg0 to HgO is assumed in order to simulate the strong depletion: Inside the boundary layer
20
over sea ice during sunny conditions it is assumed that there is an additional oxidation rate of ¼h−1. The fast oxidation stops, when surface temperature exceeds −4◦C.
The dry deposition velocities of the reactive gaseous mercury species are based on the resistance method, where a surface resistance similar to the surface resistance for HNO3 obtained from the photochemical version of DEHM is used. The dry
de-25
position velocity for particulate Hg is similar to the deposition velocity for sulfate (see Christensen, 1997). The wet deposition of reactive gaseous as well as particulate
mer-ACPD
3, 3525–3541, 2003Modelling of Mercury with the Danish Eulerian Hemispheric Model J. H. Christensen et al. Title Page Abstract Introduction Conclusions References Tables Figures J I J I Back Close Full Screen / Esc
Print Version Interactive Discussion
© EGU 2003
cury is parameterized using a simple scavenging coefficients formulation with different in-cloud and below-cloud scavenging coefficients (see Christensen, 1997). The wet removal rates for all aqueous species are similar to the rates for sulfate.
4. Results
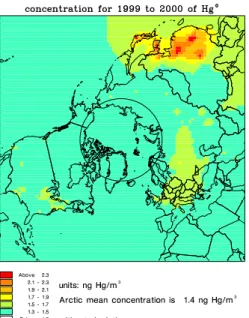
The mercury version of the DEHM model has been run for the mother domain for
5
October 1998 to December 2000. The mean concentration of Hg0 for two different runs, one without the fast oxidation rate causing Arctic mercury depletion and one with the fast oxidation rate are shown in Fig. 3. The highest levels of Hg0are in Asia, while the concentrations for Europe and North America is only slightly above the background level of 1.5 ng Hg/m3. The depletion phenomena have large influence on the mean
10
concentrations in the Arctic and only minor influence outside the Arctic.
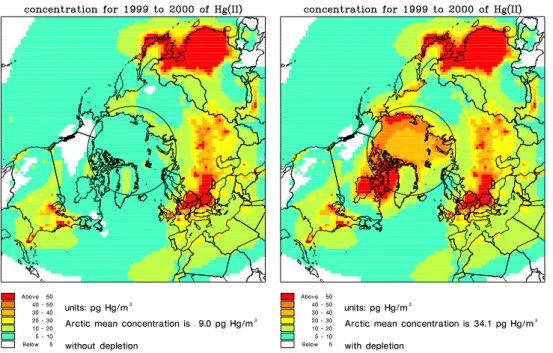
The mean concentrations of Reactive Gaseous Mercury (RGM) are shown in Fig. 4 for the two different runs. For the run without depletion the highest levels are over emissions areas in North America, Europe and Asia. For the model run with depletion, high concentrations of RGM are seen in the whole Arctic, especially over Hudson Bay
15
and the near coastal areas over the Arctic Ocean.
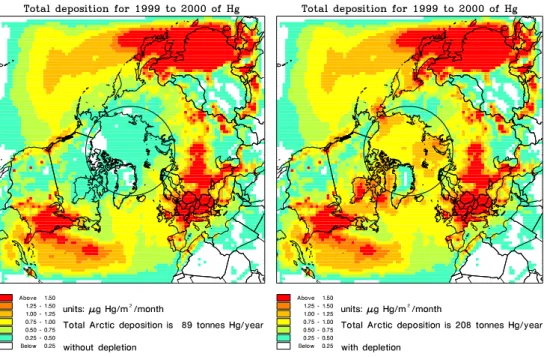
The dry deposition velocity of RGM is very high and therefore the very high con-centrations of RGM result in a dramatically increased deposition of mercury, which is shown in Fig. 5. This example shows the importance of the Arctic mercury depletion for the total deposition of mercury in the Arctic area. The total deposition increases
20
across the entire Arctic area as well as surrounding areas. According to the model runs performed in this study the total deposition of mercury increases from 89 to 208 tons pr. year for the area north of the Polar Circle due to the depletion.
For the Arctic areas the model results have been compared to measurements from Station Nord in North Eastern Greenland for the years 1999–2001, Alert in Canada for
25
the year 1999 and Barrow in Alaska for the year 2000. The results show that there is quite good general agreement between calculated and observed concentrations of
ACPD
3, 3525–3541, 2003Modelling of Mercury with the Danish Eulerian Hemispheric Model J. H. Christensen et al. Title Page Abstract Introduction Conclusions References Tables Figures J I J I Back Close Full Screen / Esc
Print Version Interactive Discussion
© EGU 2003
elemental mercury (Hg0) for all three places (Figs. 6–8). Calculated concentrations of reactive gaseous mercury (RGM) as well as particulate mercury are also shown on the figures, and it can be seen that the levels of these species increase considerably during the depletion period. Measured concentrations of RGM at Barrow are shown on Fig. 8, and there again quite good general agreement is seen between the measured
5
and calculated concentrations of RGM. An exception is the period from the middle of May to June, where the calculated concentrations of RGM are nearly zero, while the measured concentrations are high. The figures emphasize the importance of including depletion for calculating Hg concentrations and depositions in the Arctic areas.
5. Conclusions and plans for the future
10
A new hemispheric mercury model based on the Danish Eulerian Hemispheric Model System (DEHM) has been presented. The model system includes a meteorological model, MM5, and a three-dimensional air pollution model (DEHM). The chemistry is based on the scheme from the GKSS mercury model with some additional parameter-izations of the very fast oxidation of Hg0during the Polar Sunrise. The current version
15
does not include re-emissions and natural emission of mercury, which both are very important sources. Instead a concentration of Hg0 on 1.5 ng/m3 is used as initial and boundary conditions.
The model results for the Arctic have been compared with measurements in the Arctic, and there are reasonable agreements between observed and calculated
con-20
centrations. The model is able to reproduce the general patterns due to the depletion during Polar Sunrise. The model has been used to make the first quantitative estimate of the importance of the mercury depletion in the Arctic troposphere during the Polar Sunrise for the deposition of mercury in the Arctic. The results from the model shows, that the total deposition of mercury increases with more than a factor 2 from 89 tonnes
25
to 208 tonnes pr year for the area north of the Polar Circle. Plans for the future work is:
ACPD
3, 3525–3541, 2003Modelling of Mercury with the Danish Eulerian Hemispheric Model J. H. Christensen et al. Title Page Abstract Introduction Conclusions References Tables Figures J I J I Back Close Full Screen / Esc
Print Version Interactive Discussion
© EGU 2003
– Continuing the work with the parameterization of background chemistry, coupling with aqueous chemistry and other oxidation pathways of Hg0.
– Improve the parameterization of Arctic chemistry, coupling with GOME measure-ments of BrO (see Richter et al, 1998), coupling with measuremeasure-ments of mercury in the Arctic in order to understand the spatial and temporal distribution of the
5
depletion.
– Coupling of mercury chemistry with a soot model. – Re-emissions from oceans, sea-ice- and land. – Further validation of the model system.
Acknowledgements. S. Brooks (Oak Ridge Associated Universities, USA) and S. Lindberg
10
(Oak Ridge National Laboratory, USA) are acknowledged for the measurements from Bar-row, Alaska. B. Schroeder (Environment Canada) is acknowledged for the measurements from Alert, Canada. The model work is financially supported by the Danish Environmental Protec-tion Agency with means from the MIKA/DANCEA funds for Environmental Support to the Arctic Region.
15
References
Christensen, J.: Testing Advection schemes in a Three Dimensional Air Pollution Model, Mathl. Comput. Modelling, 18, 75–88, 1993.
Christensen, J.: Transport of Air Pollution in the Troposphere to the Arctic, PhD thesis, National Environmental Research Institute, DK-4000 Roskilde, Denmark, 377, 1995.
20
Christensen, J. H.: The Danish Eulerian Hemispheric Model – a three-dimensional air pollution model used for the Arctic, Atm. Env., 31, 4169–4191, 1997.
Christensen, J.: An overview of modelling the Arctic mass budget of metals and sulphur: Em-phasis on source apportionment of atmospheric burden and deposition. In “Modelling and Sources: A Workshop on Techniques and Associated Uncertainties in Quantifying the Origin
ACPD
3, 3525–3541, 2003Modelling of Mercury with the Danish Eulerian Hemispheric Model J. H. Christensen et al. Title Page Abstract Introduction Conclusions References Tables Figures J I J I Back Close Full Screen / Esc
Print Version Interactive Discussion
© EGU 2003
and Long-Range Transport of Contaminants to the Arctic. Report and extended abstracts of the workshop, Bergen, 14–16 June 1999”. Annex 15, 1–5, 1999.
Frohn, L. M., Christensen, J. H., and Brandt, J.: Development of a High-Resolution Nested Air Pollution Model – The Numerical Approach, Journal of Computational Physics, 179, 1, 68–94, 2002.
5
Grell, G. A., Dudhia, J., and Stauffer, D. R.: A Description of the Fifth-Generation Penn State/NCAR Mesoscale Model (MM5), NCAR/TN-398+STR, NCAR Technical Note, June 1995, Mesoscale and Microscale Meteorology Division, National Center for Atmospheric Research, Boulder, CO, 122, 1995.
K ¨am ¨ari, J., JokiHeiskala, P., Christensen, J., Degerman, E., Derome, J., Hoff, R., and
10
K ¨ahk ¨onen,A.-M.: Acidifying Pollutants, Arctic Haze, and Acidifications in the Arctic, Chapter 9 in: AMAP Assesment Report: Arctic Pollution Issues, Arctic Monitoring and Assessment Programme (AMAP), S. Wilson, J. Murray and H. Huntington (eds.), 621–659, 1998. Lu, J. Y., Schroeder, W. H., Barrie, L. A., Steffen, A., Welch, H. E., Martin, K., Lockhart, W.
L., Hunt,R. V., Boila, G., and Richter, A.: Magnification of atmospheric mercury deposition
15
to polar regions in springtime: the link to tropospheric ozone depletion chemistry, Geophys. Res. Lett., 28, 3219–3222, 2001.
Pacyna, E. G. and Pacyna, J. M.: Global emission of mercury from anthropogenic sources in 1995, Water, Air, and Soil Pollution, 137, 143–165, 2002.
Petersen, G., Munthe, J., Pleijel, K., Bloxam, R., and Vinod Kumar, A.: A comprehensive
20
eulerian modeling framework for airborne mercury species: development and testing of the tropospheric chemistry module (TCM), Atm. Env., 32, 829–843, 1998.
Richter, A., Wittrock, F., Eisinger, M., and Burrows, J. P.: GOME observations of tropospheric BrO in Northern Hemispheric spring and summer 1997, Geophys. Res. Lett., 25, 2683–2686, 1998.
25
Schroeder, W. H., Anlauf, K. G., Barrie, L. A., Lu, J. U., Steffen, A., Schneeberger, D. R., and Berg, T.: Arctic springtime depletion of mercury, Nature, 394, 331–332, 1998.
ACPD
3, 3525–3541, 2003Modelling of Mercury with the Danish Eulerian Hemispheric Model J. H. Christensen et al. Title Page Abstract Introduction Conclusions References Tables Figures J I J I Back Close Full Screen / Esc
Print Version Interactive Discussion
© EGU 2003
9
Figure 1. Overview of the DEHM model system. Both the MM5 model and the DEHM model has nesting
capabilities, and the MM5 model is initialised with data from ECMWF.
!
"
#
!
Fig. 1. Overview of the DEHM model system. Both the MM5 model and the DEHM model has
nesting capabilities, and the MM5 model is initialised with data from ECMWF.
ACPD
3, 3525–3541, 2003Modelling of Mercury with the Danish Eulerian Hemispheric Model J. H. Christensen et al. Title Page Abstract Introduction Conclusions References Tables Figures J I J I Back Close Full Screen / Esc
Print Version Interactive Discussion
© EGU 2003
10
Figure 2. The GKSS chemical scheme used in the mercury model (from Petersen et al., 1998). The red
arrow shows the additional fast oxidation rate of Hg
0to HgO during Polar Sunrise (PS).
$ ! % & ! % ' ! % & ! ! % $ $ $( ) $* $ $(+ ,) -$. $ $ $//( ) $//( ) $//( ) $( ) , , 0+ + + + -+
-Fig. 2. The GKSS chemical scheme used in the mercury model (from Petersen et al., 1998).
The red arrow shows the additional fast oxidation rate of Hg0to HgO during Polar Sunrise (PS).
ACPD
3, 3525–3541, 2003Modelling of Mercury with the Danish Eulerian Hemispheric Model J. H. Christensen et al. Title Page Abstract Introduction Conclusions References Tables Figures J I J I Back Close Full Screen / Esc
Print Version Interactive Discussion
© EGU 2003
11
Figure 3. The concentration of Hg0in ng Hg/m3; without the fast oxidation rate causing Arctic mercury depletion (left) and with the fast oxidation rate (right).
Fig. 3. The concentration of Hg0 in ng Hg/m3; without the fast oxidation rate causing Arctic mercury depletion (left) and with the fast oxidation rate (right).
ACPD
3, 3525–3541, 2003Modelling of Mercury with the Danish Eulerian Hemispheric Model J. H. Christensen et al. Title Page Abstract Introduction Conclusions References Tables Figures J I J I Back Close Full Screen / Esc
Print Version Interactive Discussion
© EGU 2003
12
Figure 4. The concentration of RGM (=Hg(II)) in pg Hg/m3; without the fast oxidation rate causing Arctic mercury depletion (left) and with the fast oxidation rate (right).
Fig. 4. The concentration of RGM (=Hg(II)) in pg Hg/m3; without the fast oxidation rate causing Arctic mercury depletion (left) and with the fast oxidation rate (right).
ACPD
3, 3525–3541, 2003Modelling of Mercury with the Danish Eulerian Hemispheric Model J. H. Christensen et al. Title Page Abstract Introduction Conclusions References Tables Figures J I J I Back Close Full Screen / Esc
Print Version Interactive Discussion
© EGU 2003
13
Figure 5. The total deposition of mercury inµg Hg/m2/month; without the fast oxidation rate causing
Arctic mercury depletion (left) and with the fast oxidation rate (right).
Fig. 5. The total deposition of mercury in µg Hg/m2/month; without the fast oxidation rate causing Arctic mercury depletion (left) and with the fast oxidation rate (right).
ACPD
3, 3525–3541, 2003Modelling of Mercury with the Danish Eulerian Hemispheric Model J. H. Christensen et al. Title Page Abstract Introduction Conclusions References Tables Figures J I J I Back Close Full Screen / Esc
Print Version Interactive Discussion
© EGU 2003
Fig. 6. Station Nord: Top panel shows a comparison of observed (blue curve) and calculated
daily mean concentrations of Hg0 with two model versions; one without depletion (red) and one with depletion (black). Middle panel shows the calculated total particulate mercury and the bottom panel shows the calculated total reactive gaseous mercury.
ACPD
3, 3525–3541, 2003Modelling of Mercury with the Danish Eulerian Hemispheric Model J. H. Christensen et al. Title Page Abstract Introduction Conclusions References Tables Figures J I J I Back Close Full Screen / Esc
Print Version Interactive Discussion
© EGU 2003
Fig. 7. Alert, Canada: Top panel shows a comparison of observed (blue curve) and calculated
daily mean concentrations of Hg0 with two model versions; one without depletion (red) and one with depletion (black). Middle panel shows the calculated total particulate mercury and the bottom panel shows the calculated total reactive gaseous mercury.
ACPD
3, 3525–3541, 2003Modelling of Mercury with the Danish Eulerian Hemispheric Model J. H. Christensen et al. Title Page Abstract Introduction Conclusions References Tables Figures J I J I Back Close Full Screen / Esc
Print Version Interactive Discussion
© EGU 2003
Fig. 8. Barrow, Alaska: Top panel shows a comparison of observed (blue curve) and calculated
daily mean concentrations of Hg0 with two model versions; one without depletion (red) and one with depletion (black). Middle panel shows the calculated total particulate mercury and the bottom panel shows a comparison of observed (blue curve) and calculated total reactive gaseous mercury (black curve).