HAL Id: inserm-00155208
https://www.hal.inserm.fr/inserm-00155208
Submitted on 18 Jun 2007
HAL is a multi-disciplinary open access
archive for the deposit and dissemination of
sci-entific research documents, whether they are
pub-lished or not. The documents may come from
teaching and research institutions in France or
abroad, or from public or private research centers.
L’archive ouverte pluridisciplinaire HAL, est
destinée au dépôt et à la diffusion de documents
scientifiques de niveau recherche, publiés ou non,
émanant des établissements d’enseignement et de
recherche français ou étrangers, des laboratoires
publics ou privés.
David Biau, Mathieu Resche-Rigon, Gaëlle Godiris-Petit, Rémy Nizard,
Raphaël Porcher
To cite this version:
David Biau, Mathieu Resche-Rigon, Gaëlle Godiris-Petit, Rémy Nizard, Raphaël Porcher. Quality
control of surgical and interventional procedures: a review of the CUSUM.. Quality and Safety in
Health Care, BMJ Publishing Group, 2007, 16 (3), pp.203-7. �10.1136/qshc.2006.020776�.
�inserm-00155208�
doi:10.1136/qshc.2006.020776
2007;16;203-207
Qual. Saf. Health Care
Raphaël Porcher
David J Biau, Mathieu Resche-Rigon, Gaëlle Godiris-Petit, Rémy S Nizard and
procedures: a review of the CUSUM
Quality control of surgical and interventional
http://qshc.bmj.com/cgi/content/full/16/3/203
Updated information and services can be found at:
These include:
References
http://qshc.bmj.com/cgi/content/full/16/3/203#BIBL
This article cites 55 articles, 21 of which can be accessed free at:
Rapid responses
http://qshc.bmj.com/cgi/eletter-submit/16/3/203
You can respond to this article at:
service
Email alerting
top right corner of the article
Receive free email alerts when new articles cite this article - sign up in the box at the
Notes
http://www.bmjjournals.com/cgi/reprintform
To order reprints of this article go to:
http://www.bmjjournals.com/subscriptions/
go to:
Quality and Safety in Health Care
To subscribe to
ORIGINAL ARTICLE
Quality control of surgical and interventional procedures:
a review of the CUSUM
David J Biau, Mathieu Resche-Rigon, Gae¨lle Godiris-Petit, Re´my S Nizard, Raphae¨l Porcher
. . . .
See end of article for authors’ affiliations . . . . Correspondence to: Dr D J Biau, De´partement de Biostatistique et Informatique Me´dicale, Hoˆpital St Louis, 1, avenue Claude-Vellefaux, 75475 Paris Cedex 10, France; djmbiau@yahoo.fr Accepted 5 March 2007 . . . .
Qual Saf Health Care 2007;16:203–207. doi: 10.1136/qshc.2006.020776 Background:The report of the CUSUM across surgical and interventional procedures has spawned a fair confusion in the literature.
Aim:To assess the use of the CUSUM and to clarify its utilisation in the perspective of future studies. Nature of the study:Retrospective review.
Methods:A systematic literature search of Medline was carried out. From each article, data regarding the design of the study, the specialty, the performance criterion, the unit under control, the methodology and the model of the CUSUM used, the use of a graph, the use of a test and the type of test applied were retrieved. Results:31 studies were found relevant. The design was mainly retrospective for the analysis of the learning curve. The main performance criteria under control were morbidity, mortality and success of the procedure. A graph was plotted in all studies as a CUSUM plot or as cumulative sums of non-negative values. A test was used in 17 studies. Mislabelling of the plot and the test, and misuse of control limits were the most commonly reported mistakes.
Conclusion:The CUSUM tool is not yet properly reported in the surgical literature. Therefore, reporting of the CUSUM should be clarified and standardised before its use widens.
Q
uality control in medicine has generated considerable interest in the past decade issuing from public health authorities, doctors or patients themselves.1–3The case of the general practitioner Harold Shipman and the Bristol Royal Infirmary Inquiry have brought the need for monitoring clinical performance into focus.4 More recently, it has found an important application in the control of surgical procedures, either in analysing the learning curve of a technique or in controlling a run of interventions.5–7Lately, applications have been sought for controlling new technologies as they are initiated.8The most commonly used methods of statistical process control are the Shewart chart, the sequential probability ratio test (SPRT), the exponentially weighted moving average and the cumulative sums (CUSUMs).4 9
Among all, the CUSUM has attracted more attention and disseminated in the medical literature due to its simple formulation and an intuitive representation, and to its capability of detecting small persistent changes.10 11
Numerous review papers have discussed methodological and statistical issues, and have given guidelines to perform such analyses.12 13
However, as for any new tool, its application spawns a fair confusion and, to the best of our knowledge, no one has yet reviewed how the CUSUM tool was, in fact, used across interventional and surgical literatures. Our aim was to bridge the gap between what should be done and what is actually done in the literature.
The objectives of the present work were to review the use of the CUSUM across different interventional and surgical specialities, and to clarify its use in the perspective of future studies.
MATERIALS AND METHODS
We performed a systematic literature search of Medline with the search terms ‘‘CUSUM or cumulative sums’’ and ‘‘surgery or procedure’’ on 15 March 2006, supplemented by cross-bibliographic checks of reference lists. No restrictions were made regarding date of publication, language or publication status.
To be included in the review, studies had to analyse a manual procedure, surgical or other, by using the use of the CUSUM. Worked examples, methodological and statistical reviews were excluded.
Data retrieved from each article were: date of publication, specialty, objective (analysis of the learning curve or quality control) and design (retrospective or prospective) of the study, performance criterion (mortality, morbidity, success of the procedure, and so on), series size, numbers and types of units under control (care provider or centre), and the basis for definition of the reference value.
Data from the methodology and the applied model of the CUSUM were also recorded: the use of a graph as a CUSUM graph or as a CUSUM of non-negative values; the use of a test (control limits or boundary lines) and the type of the applied test (CUSUM or SPRT); the reporting of enough information in the study to compute the graph if data were available; and the adjustment for patient’s individual risk factors.
Different statistical methods have been used for continuous monitoring of a process: the CUSUM graph, the CUSUM test and the SPRT are the most commonly used methods (see Appendix).
The CUSUM graph should be differentiated from the CUSUM test, or tabular CUSUM. The CUSUM graph plots the cumulative sums of the deviation between the process and a target value. The graph provides a qualitative overview of the processed monitored (fig 1A). The CUSUM test is a hypothesis test that relies on the comparison between computed values and a limit.14It has a graphical representation where one plots the cumulative sums of the maximum between zero and a weighted value (sample weight) (figs 1B, 2A). When the graph hits the limit, the process is claimed to be out of control, but it can never be considered as definitely in control. On the contrary, an inverted CUSUM is drawn below the zero horizontal axis and is used to detect quality improvements. A two-sided CUSUM test allows detecting the deviation above or Abbreviation: SPRT, sequential probability ratio test
below a target when both are considered as suboptimal performances.
The SPRT is a hypothesis test in itself and a graphical representation could be displayed (fig 2B). The SPRT presents two limits, an upper boundary line where one chooses to accept the alternative hypothesis (the process is in control) and a lower boundary line where one chooses to accept the null hypothesis.
A more detailed description of the use of the CUSUM can be found in dedicated reviews and are beyond the scope of this paper.12 13
RESULTS
The search strategy generated 77 studies. In all, 31 studies were found relevant by title, abstract and on final complete retrieval of the article (table 1). Publication years ranged from 1991 to 2005, with a recent increase in the number of publications (fig 3). In all, nine studies were from Canada, eight from the UK, four from New Zealand, three from USA, two from France; and one publication each from five other countries.
The design was retrospective in 25 (80%) studies and prospective in 6 (20%); the objective was the analysis of the learning curve in 22 (71%) studies, quality control in 8 (26%) and both in 1 (3%) study. Specialties of interest were cardiovascular surgery in 14 (45%) studies, anaesthesia in 7 (23%), general surgery in 4 (13%), endoscopy in 3 (10%), otolaryngology-head and neck surgery in 2 (6%) and ortho-paedics in 1 (3%). The unit under control was the care provider in 22 (71%) studies and the centre in 9 (29%); the number of units under control per study ranged from 1 to 20. The median (range) number of procedures controlled per study was 299 (24–3983).
The main performance criterion under control was morbidity in 1 (3%) study, mortality in 7 (23%), mortality and morbidity in 7 (23%), and the success of the procedure in 16 (52%). The success of the procedure was defined as completion of the procedure, a procedure meeting the required standard or a procedure completed within a certain time. The data monitored was binomial in 28 (90%) studies and normally distributed in 3 (10%) studies. Target and failure rates were determined from consensus in the department in 5 (16%) studies, from reported rates in the literature in 9 (29%), from expert society requirements in 4 (13%) studies and from the observation during the monitoring of the procedure in 5 (16%). The basis for definition of target and failure rates was not reported in 7 (23%) studies.
A graph was plotted in all studies, but it was incorrectly labelled as ‘‘cumulative failures’’ in 2 (6%) studies; the plot was a CUSUM graph in 28 (90%) studies and a cumulative sum of non-negative values in 3 (10%). A test was applied in 17 (55%) studies: 7 (41%) studies were SPRT, 6 of which were wrongly reported as CUSUM tests; 5 (29%) were standard CUSUM graphs with limits derived from a SPRT (ascending limits); 3 (18%) were CUSUM tests; 1 (6%) was the observed–expected cumulative values; and in 1 (6%) study, the boundary lines on the CUSUM graph were flat although they should have been ascending as the limits were those of a SPRT. Sufficient explanation for computing the CUSUM was given in 26 (84%) studies and the CUSUM was risk adjusted in 7 (23%) studies. DISCUSSION
Statistical process control has emerged in the medical literature after a wide expansion in the industry.15 In the 1920s, Shewart,16 who worked for Bell Telephone Laboratories, constituted a group of experts and established the scientific ground for quality control. Statistical process control and control charts emerged later, with Wald,17who first developed the theory of SPRTs, and with Page14 who developed the CUSUM chart in the mid-1950s. Control charts proved very useful to quality management in the industry and disseminated rapidly. Although the first publication of CUSUM in a general medical journal dates back to the mid-1970s,18
its strong properties have not been exploited due to the confusion that arose in recent years together with the spread of the technique. The CUSUM graph and the CUSUM test should be differentiated. Moreover, the CUSUM test and SPRT are usually confounded and this has yielded some confusion in the literature.3 19–22The need for deciding whether a process is out of control requires the use of control limits. Some authors have used standard CUSUM graphs with limits being derived from a SPRT23–27; however, a SPRT has two absorbing limits, the upper to reject H0(the process is deemed out of control) and the lower
to accept H0(the process is above the required performance),
and it does not make sense to continue monitoring once a limit has been hit.9Indeed, if one continues plotting after the inferior limit has been hit, the CUSUM graph will build up credits with time and, therefore, it is unable to raise an alarm in due time if the process goes out of control after a period of good performance.25 26 The same applies for the upper limit, be it that of a CUSUM test or that of a SPRT test: when this limit is hit, the plot should be stopped, and the procedure may be investigated.
The CUSUM was usually used for two purposes: assessing a learning curve and quality control. The former has yet again generated more interest. However, the limits should be used with due care. Indeed, many have used a CUSUM test while assessing a learning curve, although it is not well adapted for this purpose.20 26 28
The CUSUM test was originally designed for monitoring a procedure that has reached a steady state, and Figure 1 (A) A CUSUM graph and (B) a CUSUM test for monitoring limb
alignment of total knee replacement using CT-based navigation system.8
The CUSUM graph shows that learning curve lasted for the first 27 implants and then stabilised around the 180˚axis (the target value). The CUSUM test shows that control of the process was maintained during the entire study. As limb alignment may deviate above or below the target value, two CUSUM tests (one positive and one negative) are drawn simultaneously with symmetric definition. Each has a control limit set at 3.6 (+ or 2 depending on the CUSUM) and the same holding barrier at 0.
was not designed to monitor a procedure that is supposed to be out of control from the start. In this case, the upper boundary limit of the CUSUM test is often crossed, sometimes as high as two or three times, and it then makes little sense for setting a limit.20 28Reaching a steady state on the CUSUM graph may be enough assurance to conclude that the learning curve has settled down. Conversely, for quality control, a lower boundary line accepting the in-control state, as in the SPRT, should not be used. Indeed, for continuous monitoring, when the purpose is the detection of changes that could occur during surveillance, one should never say that a procedure has reached an in-control state and that monitoring can be safely stopped. To avoid this drawback, a resetting SPRT has been developed which resets by itself at 0, each time the lower boundary is hit.9 As for any new statistical tool, the CUSUM would benefit from clarification. Self-contained explanations with adequate referencing to methodological or statistical reviews should be found in the text of each study. Authors willing to use the CUSUM should also clearly report on what was done. The design (retrospective or prospective) and the objective (analysis of learning curve or quality control) of the study, the performance criterion under control (mortality, morbidity, and so on) and how the reference value was determined (consensus from the department, literature, expert society, and so on) should be clearly enunciated in the methodology. The model of the CUSUM that was applied (CUSUM graph and CUSUM test), the type of data that were monitored (binomial, Poisson distribution and normally distributed data) and how the control limits were determined (log-likelihood ratio) should
also be clearly enunciated. Statistical considerations are beyond the scope of this work and can be found in specific reviews.4 29 However, with developments of the CUSUM in its prospective purpose, as for continuous monitoring and surveillance, other specific issues will soon arise: the determination of target and reference values, the determination of limits through the average run length and actions that should be taken when an alarm is raised.
Reports from the Institute of Medicine, Washington DC, USA have emphasised the need for building a safer health system.30 Inadequate monitoring of treatment is a cause for error, and the Institute of Medicine encouraged healthcare organisations to develop a culture of safety and create systems for continuously monitoring patient safety.30 The committee later proposed six aims for establishing the 21st century healthcare system and noted that today’s healthcare system functions at far lower level than it can and should be.2
‘‘Timely’’ was one of these key points and the report notified that ‘‘reducing waits and sometimes harmful delays for both those who receive and those who give care’’ would be far better at meeting patients’ needs. The CUSUM tool has shown its power in detecting, in timely fashion, fatal medical errors, near misses and subopti-mal clinical performance. Moreover, initiation of new surgical technologies, whose rapid development may render classic assessment inadequate, could benefit from continuous perfor-mance evaluation.8 31
Despite all the confusion in the use of the CUSUM, it is generating more and more interest in the surgical community, and is being handled more appropriately in recent years.8 32 33 Statistical control tools have shown their dramatic potential life-saving impact through the retrospective study of Harold Shipman death certificates and the Royal Bristol infirmary annual mortality rates.4
However, their use in continuous prospective quality control is yet to be expanded. Continuous monitoring of failure rates (mortality after cardiac surgery, recurrence of hernia after repair, and so on) and clinical performance (rate of misses and near misses in cardiac surgery, conversion rate for laparoscopic surgery, and so on) at centre or care provider level would be of enormous help in improving patient care and cost effectiveness.34
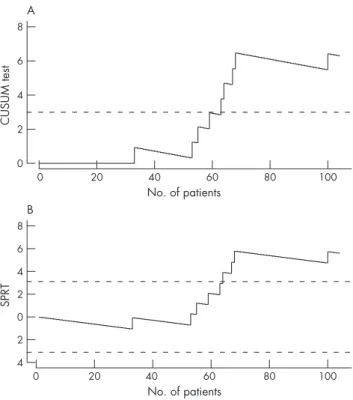
Figure 2 (A) A CUSUM test for monitoring death after paediatric cardiac operation.3The test detected a cluster of surgical failures starting with
patient 53. A comparison is drawn between the CUSUM test and (B) the sequential probability ratio test (SPRT). The CUSUM test has only an upper boundary line (out of control), whereas the SPRT has both an upper (out of control) and a lower (in control) boundary lines. A signal is triggered with the SPRT just one observation later than that with the CUSUM test. It seems that both methods are close in terms of calculation, but have somewhat different purposes. Some confusion has arisen in the literature, due to the fact that a SPRT is actually a cumulative sum.
Figure 3 The number of publications per year for procedures that are using the cumulative sum for the control of surgical or interventional procedures.
CUSUM control charts 205
CONCLUSION
The use of the CUSUM is generating more and more interest in the medical world and across the surgical community. However, despite extensive reviews on the topic, it is not yet properly reported in the surgical literature and the confusion remains, which may hamper its spread. Therefore, reporting of the CUSUM should be clarified and standardised. The shift from retrospective study and learning curve assessment to prospective quality control is at crossroads and promises great expectations.
ACKNOWLEDGMENTS
We thank Dr Lysbeth Ravn for her help in translating her own manuscript. Her participation does not necessarily mean that she agrees with the content of the manuscript.
Authors’ affiliations
. . . .
David J Biau, Mathieu Resche-Rigon, Raphae¨l Porcher,De´partement de Biostatistique et Informatique Me´dicale, AP-HP, Hoˆpital Saint Louis, Universite´ Paris 7, INSERM U717, Paris, France
Gae¨lle Godiris-Petit,Service de chirurgie ge´ne´rale digestive et
endocrinienne, AP-HP, Hoˆpital Saint Louis, Universite´ Paris 7, Paris, France Re´my S Nizard,Service de chirurgie orthope´dique et traumatologie, AP-HP, Hoˆpital Lariboisie`re, Universite´ Paris 7, Paris, France
Competing interests: None.
REFERENCES
1 The Inquiry into the management of care of children receiving complex heart surgery at the Bristol Royal Infirmary. http://www.bristol-inquiry.org.uk/ (accessed 3 Apr 2007).
2 Institute Of Medicine. Crossing the quality chasm: a new health system for the 21st Century. Washington, DC: National Academy Press, 2001.
3 de Leval MR, Francois K, Bull C, et al. Analysis of a cluster of surgical failures. Application to a series of neonatal arterial switch operations. J Thorac Cardiovasc Surg. 1994;107: 914–23; discussion 923–14).
4 Spiegelhalter D, Grigg O, Kinsman R, et al. Risk-adjusted sequential probability ratio tests: applications to Bristol, Shipman and adult cardiac surgery. Int J Qual Health Care 2003;15:7–13.
5 Rogers CA, Ganesh JS, Banner NR, et al. Cumulative risk adjusted monitoring of 30-day mortality after cardiothoracic transplantation: UK experience. Eur J Cardiothorac Surg 2005;27:1022–9.
6 Young A, Miller JP, Azarow K. Establishing learning curves for surgical residents using cumulative summation (CUSUM) analysis. Curr Surg 2005;62:330–4. 7 Bolsin S, Colson M. The use of the Cusum technique in the assessment of trainee
competence in new procedures. Int J Qual Health Care 2000;12:433–8. 8 Nizard RS, Porcher R, Ravaud P, et al. Use of the Cusum technique for evaluation
of a CT-based navigation system for total knee replacement. Clin Orthop Relat Res 2004:180–8.
9 Grigg OA, Farewell VT, Spiegelhalter DJ. Use of risk-adjusted CUSUM and RSPRT charts for monitoring in medical contexts. Stat Methods Med Res 2003;12:147–70.
10 Montgomery DC. Introduction to statistical quality control, 5th edn. New York, NY: John Wiley & Sons, 2005.
11 Altman DG, Royston JP. The hidden effect of time. Stat Med, 1988;7, 629–37. 12 Grunkemeier GL, Wu YX, Furnary AP. Cumulative sum techniques for assessing
surgical results. Ann Thorac Surg 2003;76:663–7.
13 Steiner SH, Cook RJ, Farewell VT. Risk-adjusted monitoring of binary surgical outcomes. Med Decis Making 2001;21:163–9.
14 Page ES. Continuous inspection schemes. Biometrika 1954;41:100–14. 15 Williams SM, Parry BR, Schlup MM. Quality control: an application of the cusum.
BMJ 1992;304:1359–61.
16 Shewart WA. Economic control of quality manufactured product. New York: Van Nostrand, 1931.
17 Wald A. Sequential analysis. New York, NY: John Wiley & Sons, 1947. 18 de Saintonge DM, Vere DW. Why don’t doctors use cusums? Lancet
1974;1:120–1.
19 de Oliveira Filho GR. The construction of learning curves for basic skills in anesthetic procedures: an application for the cumulative sum method. Anesth Analg 2002;95:411–16.
20 Naik VN, Devito I, Halpern SH. Cusum analysis is a useful tool to assess resident proficiency at insertion of labour epidurals. Can J Anaesth 2003;50:694–8. 21 Schlup MM, Williams SM, Barbezat GO. ERCP: a review of technical
competency and workload in a small unit. Gastrointest Endosc 1997;46:48–52.
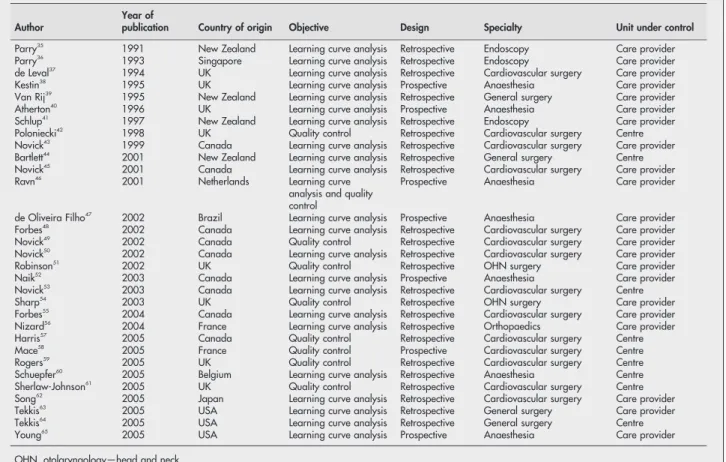
Table 1 Studies using the CUSUM as an evaluation tool for interventional and surgical procedures
Author
Year of
publication Country of origin Objective Design Specialty Unit under control
Parry35 1991 New Zealand Learning curve analysis Retrospective Endoscopy Care provider
Parry36 1993 Singapore Learning curve analysis Retrospective Endoscopy Care provider
de Leval37 1994 UK Learning curve analysis Retrospective Cardiovascular surgery Care provider
Kestin38 1995 UK Learning curve analysis Prospective Anaesthesia Care provider
Van Rij39 1995 New Zealand Learning curve analysis Retrospective General surgery Care provider
Atherton40 1996 UK Learning curve analysis Prospective Anaesthesia Care provider
Schlup41 1997 New Zealand Learning curve analysis Retrospective Endoscopy Care provider
Poloniecki42 1998 UK Quality control Retrospective Cardiovascular surgery Centre
Novick43 1999 Canada Learning curve analysis Retrospective Cardiovascular surgery Care provider
Bartlett44 2001 New Zealand Learning curve analysis Retrospective General surgery Centre
Novick45 2001 Canada Learning curve analysis Retrospective Cardiovascular surgery Care provider
Ravn46 2001 Netherlands Learning curve
analysis and quality control
Prospective Anaesthesia Care provider
de Oliveira Filho47 2002 Brazil Learning curve analysis Prospective Anaesthesia Care provider
Forbes48 2002 Canada Learning curve analysis Retrospective Cardiovascular surgery Care provider
Novick49 2002 Canada Quality control Retrospective Cardiovascular surgery Care provider
Novick50 2002 Canada Learning curve analysis Retrospective Cardiovascular surgery Care provider
Robinson51 2002 UK Quality control Retrospective OHN surgery Care provider
Naik52 2003 Canada Learning curve analysis Prospective Anaesthesia Care provider
Novick53 2003 Canada Learning curve analysis Retrospective Cardiovascular surgery Centre
Sharp54 2003 UK Quality control Retrospective OHN surgery Care provider
Forbes55 2004 Canada Learning curve analysis Retrospective Cardiovascular surgery Care provider
Nizard56 2004 France Learning curve analysis Retrospective Orthopaedics Care provider
Harris57 2005 Canada Quality control Retrospective Cardiovascular surgery Centre
Mace58 2005 France Quality control Prospective Cardiovascular surgery Centre
Rogers59 2005 UK Quality control Retrospective Cardiovascular surgery Centre
Schuepfer60 2005 Belgium Learning curve analysis Retrospective Anaesthesia Centre
Sherlaw-Johnson61 2005 UK Quality control Retrospective Cardiovascular surgery Centre
Song62 2005 Japan Learning curve analysis Retrospective Cardiovascular surgery Care provider
Tekkis63 2005 USA Learning curve analysis Retrospective General surgery Care provider
Tekkis64 2005 USA Learning curve analysis Retrospective General surgery Centre
Young65 2005 USA Learning curve analysis Prospective Anaesthesia Care provider
OHN, otolaryngology—head and neck.
22 Schuepfer G, Johr M. Psoas compartment block (PCB) in children. Part II: generation of an institutional learning curve with a new technique. Paediatr Anaesth 2005;15:465–9.
23 Forbes TL, De Rose G, Harris KA. A CUSUM analysis of ruptured abdominal aortic aneurysm repair. Ann Vasc Surg 2002;16:527–33.
24 Forbes TL, DeRose G, Kribs SW, et al. Cumulative sum failure analysis of the learning curve with endovascular abdominal aortic aneurysm repair. J Vasc Surg 2004;39:102–8.
25 Novick RJ, Fox SA, Stitt LW, et al. Cumulative sum failure analysis of a policy change from on-pump to off-pump coronary artery bypass grafting. Ann Thorac Surg 2001;72:S1016–21.
26 Novick RJ, Stitt LW. The learning curve of an academic cardiac surgeon: use of the CUSUM method. J Card Surg. 1999;14: 312–20; discussion 321–2). 27 Song MH, Tajima K, Watanabe T, et al. Learning curve of coronary surgery by a
cardiac surgeon in Japan with the use of cumulative sum analysis. Jpn J Thorac Cardiovasc Surg 2005;53:551–6.
28 Kestin IG. A statistical approach to measuring the competence of anaesthetic trainees at practical procedures. Br J Anaesth 1995;75:805–9.
29 Grigg OA, Farewell VT. A risk-adjusted sets method for monitoring adverse medical outcomes. Stat Med 2004;23:1593–602.
30 Kohn LT, Corrigan JM, Donaldson MS. To err is human: building a safer health system. Washington, DC: National Academy Press, 2000.
31 McCulloch P, Taylor I, Sasako M, et al. Randomised trials in surgery: problems and possible solutions. BMJ 2002;324:1448–51.
32 Harris JR, Forbes TL, Steiner SH, et al. Risk-adjusted analysis of early mortality after ruptured abdominal aortic aneurysm repair. J Vasc Surg 2005;42:387–91. 33 Sherlaw-Johnson C, Morton A, Robinson MB, et al. Real-time monitoring of
coronary care mortality: a comparison and combination of two monitoring tools. Int J Cardiol 2005;100:301–7.
34 Guth KA, Kleiner B. Quality assurance in the health care industry. J Health Care Finance 2005;31:33–40.
35 Parry BR, Williams SM. Competency and the colonoscopist: a learning curve. Aust N Z J Surg 1991;61:419–22.
36 Parry BR, Goh HS. Quality control in colonoscopy: a Singapore perspective. Int J Colorectal Dis 1993;8:139–41.
37 de Leval MR, Francois K, Bull C, et al. Analysis of a cluster of surgical failures. Application to a series of neonatal arterial switch operations. J Thorac Cardiovasc Surg 1994;107:914–23; discussion 923–4.
38 Kestin IG. A statistical approach to measuring the competence of anaesthetic trainees at practical procedures. Br J Anaesth 1995;75:805–9.
39 Van Rij AM, McDonald JR, Pettigrew RA, et al. Cusum as an aid to early assessment of the surgical trainee. Br J Surg 1995;82:1500–3.
40 Atherton DP, O’Sullivan E, Lowe D, et al. A ventilation-exchange bougie for fibreoptic intubations with the laryngeal mask airway. Anaesthesia 1996;51:1123–6.
41 Schlup MM, Williams SM, Barbezat GO. ERCP: a review of technical competency and workload in a small unit. Gastrointest Endosc 1997;46:48–52. 42 Poloniecki J, Valencia O, Littlejohns P. Cumulative risk adjusted mortality chart for detecting changes in death rate: observational study of heart surgery. BMJ 1998;316:1697–700.
43 Novick RJ, Stitt LW. The learning curve of an academic cardiac surgeon: use of the CUSUM method. J Card Surg 1999;14:312–20; discussion 321–2. 44 Bartlett A, Parry B. Cusum analysis of trends in operative selection and
conversion rates for laparoscopic cholecystectomy. ANZ J Surg 2001;71:453–6. 45 Novick RJ, Fox SA, Stitt LW, et al. Cumulative sum failure analysis of a policy
change from on-pump to off-pump coronary artery bypass grafting. Ann Thorac Surg 2001;72:S1016–21.
46 Ravn LI, Sprehn M, Pedersen CB. [The Cusum score. A tool for evaluation of clinical competence]. Ugeskr Laeger 2001;163:3644–8.
47 de Oliveira Filho GR. The construction of learning curves for basic skills in anesthetic procedures: an application for the cumulative sum method. Anesth Analg 2002;95:411–16.
48 Forbes TL, De Rose G, Harris KA. A CUSUM analysis of ruptured abdominal aortic aneurysm repair. Ann Vasc Surg 2002;16:527–33.
49 Novick RJ, Fox SA, Stitt LW, et al. Effect of off-pump coronary artery bypass grafting on risk-adjusted and cumulative sum failure outcomes after coronary artery surgery. J Card Surg 2002;17:520–8.
50 Novick RJ, Fox SA, Stitt LW, et al. Assessing the learning curve in off-pump coronary artery surgery via CUSUM failure analysis. Ann Thorac Surg 2002;73:S358–62.
51 Robinson IA, Blackham RB, Cozens NJ, et al. Good practice in head and neck fine needle aspiration cytology as assessed by CUSUM. Cytopathology 2002;13:335–42.
52 Naik VN, Devito I, Halpern SH. Cusum analysis is a useful tool to assess resident proficiency at insertion of labour epidurals. Can J Anaesth 2003;50:694–8. 53 Novick RJ, Fox SA, Kiaii BB, et al. Analysis of the learning curve in telerobotic,
beating heart coronary artery bypass grafting: a 90 patient experience. Ann Thorac Surg 2003;76:749–53.
54 Sharp JF, Cozens N, Robinson I. Assessment of surgical competence in parotid surgery using a CUSUM assessment tool. Clin Otolaryngol Allied Sci 2003;28:248–51.
55 Forbes TL, DeRose G, Kribs SW, et al. Cumulative sum failure analysis of the learning curve with endovascular abdominal aortic aneurysm repair. J Vasc Surg 2004;39:102–8.
56 Nizard RS, Porcher R, Ravaud P, et al. Use of the Cusum technique for evaluation of a CT-based navigation system for total knee replacement. Clin Orthop Relat Res 2004;425:180–8.
57 Harris JR, Forbes TL, Steiner SH, et al. Risk-adjusted analysis of early mortality after ruptured abdominal aortic aneurysm repair. J Vasc Surg 2005;42:387–91. 58 Mace L, Bertrand S, Lucron H, et al. [Paediatric cardiac surgery and
autoevaluation: risk score, complexity score and graphic analysis]. Arch Mal Coeur Vaiss 2005;98:477–84.
59 Rogers CA, Ganesh JS, Banner NR, et al. Cumulative risk adjusted monitoring of 30-day mortality after cardiothoracic transplantation: UK experience. Eur J Cardiothorac Surg 2005;27:1022–9.
60 Schuepfer G, Johr M. Psoas compartment block (PCB) in children: part II– generation of an institutional learning curve with a new technique. Paediatr Anaesth 2005;15:465–9.
61 Sherlaw-Johnson C, Morton A, Robinson MB, et al. Real-time monitoring of coronary care mortality: a comparison and combination of two monitoring tools. Int J Cardiol 2005;100:301–7.
62 Song MH, Tajima K, Watanabe T, et al. Learning curve of coronary surgery by a cardiac surgeon in Japan with the use of cumulative sum analysis. Jpn J Thorac Cardiovasc Surg 2005;53:551–6.
63 Tekkis PP, Fazio VW, Lavery IC, et al. Evaluation of the learning curve in ileal pouch-anal anastomosis surgery. Ann Surg 2005;241:262–8.
64 Tekkis PP, Senagore AJ, Delaney CP, et al. Evaluation of the learning curve in laparoscopic colorectal surgery: comparison of right-sided and left-sided resections. Ann Surg 2005;242:83–91.
65 Young A, Miller JP, Azarow K. Establishing learning curves for surgical residents using Cumulative Summation (CUSUM) Analysis. Curr Surg 2005;62:330–4.
APPENDIX
The principle of CUSUM charts was developed for industrial quality control during the 1930s, and drew considerable attention and research during the 1950s. Assume that we wish to continuously monitor a process. The basic idea of CUSUM graphs is to plot the cumulative sum of the deviation between the process and a target value, instead of plotting the sequential values of the process themselves. If we note Xi as the ith
measurement of the process and X0 the target value, the
CUSUM Cn after the measurement of n has the simple
expression: Cn= S(Xi–X0). When a target value cannot be
defined, some first or last values of the process are taken (usually their mean) to define a target. Another expression of the CUSUM for Bernoulli data may be found where one plots Cn= S(Xi–s), where Xi–s is proportional to the log-likelihood
ratio.
The CUSUM test is a particular hypothesis test of the null hypothesis H0 ‘‘the process is in-control’’—that is, the
performance is as expected, versus the alternative hypothesis H1 ‘‘the process is out of control’’—that is, the level of
performance has switched to a highly unacceptable level. The CUSUM test has an upper boundary line where one accepts the alternative hypothesis. When the graph hits this limit, the process is then claimed to be out of control. On the other side, it has a holding barrier at 0, which cannot be crossed; when the graph hits this limit it stays at 0 and the monitoring continues. With this procedure, acceptance that the process has reached an in-control state is not possible. This is particularly well suited to quality control, where the process will possibly deviate in the future. For normally distributed data, two CUSUM tests are drawn simultaneously (one positive and one negative).
The sequential probability ratio test (SPRT) is a very close statistical method. However, the SPRT has a negative lower boundary. When it is crossed, enough evidence accumulates to say that the process is in control, and the monitoring should stop. Figure 1 presents an illustration of the CUSUM methodology.
CUSUM control charts 207