COMBINING FEATURES FOR COVER SONG IDENTIFICATION
Julien Osmalskyj
University of Liège
Belgium
Peter Foster, Simon Dixon
Queen Mary University of London
United Kingdom
{p.a.foster, s.e.dixon}@qmul.ac.ukJean-Jacques Embrechts
University of Liège
Belgium
[email protected] ABSTRACTIn this paper, we evaluate a set of methods for combining features for cover song identification. We first create mul-tiple classifiers based on global tempo, duration, loudness, beats and chroma average features, training a random for-est for each feature. Subsequently, we evaluate standard combination rules for merging these single classifiers into a composite classifier based on global features. We further obtain two higher level classifiers based on chroma fea-tures: one based on comparing histograms of quantized chroma features, and a second one based on computing cross-correlations between sequences of chroma features, to account for temporal information. For combining the latter chroma-based classifiers with the composite classi-fier based on global features, we use standard rank aggre-gation methods adapted from the information retrieval lit-erature. We evaluate performance with the Second Hand Song dataset, where we quantify performance using multi-ple statistics. We observe that each combination rule out-performs single methods in terms of the total number of identified queries. Experiments with rank aggregation me-thods show an increase of up to 23.5 % of the number of identified queries, compared to single classifiers.
1. INTRODUCTION
Recent years have seen an increased interest in cover song recognition problems in the Music Information Retrieval (MIR) community. Such systems deal with the problem of retrieving different versions of a known audio query, where a version can be described as a new performance or recording of a previously recorded track [26]. Cover song recognition is a challenging task because the different renditions of a song may differ from the original work in terms of tempo, pitch, instrumentation or singing style. It is therefore an ongoing challenge to design features which are robust to variation in these musical characteristics.
Several approaches have been studied for cover song recognition problems. In existing work, retrieving
cov-c
Julien Osmalskyj, Peter Foster, Simon Dixon, Jean-Jacques Embrechts.
Licensed under a Creative Commons Attribution 4.0 International Li-cense (CC BY 4.0). Attribution: Julien Osmalskyj, Peter Foster, Si-mon Dixon, Jean-Jacques Embrechts. “Combining Features for Cover Song Identification”, 16th International Society for Music Information Retrieval Conference, 2015.
ers is usually done by performing pairwise comparisons between audio queries and a reference database [10, 13, 14, 26], or by using index-based methods [2, 3, 16, 18]. A comprehensive review of existing methods is given in [24]. All these methods are based on single chroma representa-tion, and do not consider using multiple features. Only few authors have considered the combination of features and distance measures. In the work of Foster et al. [11], multiple chroma-based distances are computed, then com-bined after ranking distances. Similarly, in an investigation performed by Ravuri et al. [22], the authors compute mul-tiple chroma-based input features at mulmul-tiple time scales, and combine them using a linear model. Finally, authors in Osmalskyj et al. [20] compare a range of methods for combining multiple spectral features for cover song iden-tification.
In this paper, we make a distinction between cover song retrieval and cover song identification. In the first case, given an audio query, the goal is to retrieve as many covers as possible in a database. In the second case, the goal is to extract some information about the query, similarly to what fingerprinting systems do [27]. In that case, it is suf-ficient to retrieve only one version of the requested song as a human listener will act as the final expert by confirming a match in the returned set of results. Cover song identifi-cation covers a different set of appliidentifi-cations, such as identi-fication of live music, query by example, or retrieving any information related to an unknown version.
To take into account multiple sources of musical infor-mation, we propose to process an audio query using several methods based on different features. First, supervised ma-chine learning is used to build classifiers that return prob-ability estimates of similarity based on global features, in-cluding the tempo, the duration, the loudness, the num-ber of beats and the average chroma features. We then merge these classifiers using standard probabilistic fusion rules to build a composite classifier. Then, we combine the latter with two methods based on chroma features. The first one is based on comparing histograms of quantized chroma features, to take into account the harmonic content of the songs. The second one is based on the cross-correla-tion of chroma sequences and further accounts for tempo-ral information. As the scores returned by all these meth-ods have different scales, we propose to combine them at the rank level using standard rank aggregation techniques inspired by the information retrieval literature, especially techniques used in web search engines [9, 21, 23]. We
demonstrate that combining global features with chroma based features for cover identification improves the results over methods based on single features.
The remaining of this paper is organized as follows. Section 2 gives an overview of our approach and describes our methodology. Section 3 details the combination rules evaluated throughout this research. In Section 4, we de-scribe our experimental setup as well as the evaluation pro-cedure. Section 5 presents the realized experiments and the results obtained. Finally, Section 6 concludes the paper.
2. APPROACH OVERVIEW
Cover songs are different versions of underlying original works. The notion of cover therefore closely relates to mu-sical similarity between two songs. A cover song identifi-cation system may therefore be conceived as measuring the similarity between two songs to classify them into a similar or a dissimilar class. We consider a binary notion of cover song identity. Our approach is based on several pairwise comparison functions called rejectors, as used in [19]. A rejector is a function R that takes two audio tracks as an in-put and returns a score ranking the similarity between two tracks. In a cover song identification scenario, one track is the query while the other one is any track of the database. Rejectors aim to filter out result candidates, while retain-ing a subset of the database containretain-ing at least one match with respect to the query.
We design several rejectors based on different features and combine them such that the global output takes the information brought by each rejector into account. We make the assumption that the outputs of rejectors based on different features are independent, and therefore con-tribute to improving the performance of the system. We first design multiple probabilistic rejectors based on sev-eral global features using random forests [5]. We next de-sign a rejector based on the quantization of chroma fea-tures. Finally, to take into account temporal information, we implement a rejector that computes cross-correlations between sequences of beat synchronous chroma features. This technique was first proposed by Ellis et al. [10] and is used as a baseline in our research.
2.1 Probabilistic Rejectors
Previous work, performed by Osmalskyj et al. [19, 20], de-monstrates that features such as tempo, duration, or spec-tral features perform better than random. However, as such features are global and low-dimensional, they do not bring much information when taken individually. Based on that observation, we select several of these global features and combine them in order to build a composite classifier that takes advantage of each single feature. For each feature, we build a probabilistic rejector using supervised machine learning. To determine the similarity of candidates with respect to a query, we perform pairwise comparisons using the rejectors. Features are extracted from the tracks and used as an input for the learned model to predict a probabil-ity. The probabilistic rejectors are furthermore combined
using several rules to build a composite rejector. 2.2 Codebook Rejector
To take into account the harmonic content of the songs, we build a rejector based on the quantization of chroma fea-tures. Similar features have been used in [19] and [11]. For each track, chroma features are mapped to specific codewords. A track is then represented by a histogram of the frequency of each codeword, known as a
bag-of-features representation [12]. Codewords are determined
using an unsupervised K-Means clustering of 200,000 beat synchronous and unit-normalized chroma vectors. We eval-uated the number of codewords in the range 25 to 100. Best performance was achieved with a clustering of 100 code-words. To account for key transpositions, we make use of the Optimal Transposition Index (OTI) [25] as it is a straightforward approach that has been used in many other investigations [1, 11, 19, 24].
The similarity between two bag-of-features representa-tions is computed as the cosine similarity between both histograms. We evaluated the cosine similarity against Eu-clidean and Bhattacharyya distances, as well as a super-vised learning based distance. However, best results were achieved with the cosine similarity. Furthermore, the co-sine similarity is fast to compute, especially when the input vectors are normalized to unit norm, as it can be computed as a simple dot product.
2.3 Cross Correlation Rejector
To take into account temporal information, we implement a baseline algorithm, initially proposed by Ellis et al. in [10]. In that method, songs are represented by beat-synchronous chroma matrices. Beat-tracking is used to align chromas on detected beats. Comparing songs is then performed by cross-correlating entire chroma-by-beat matrices. Sharp peaks in the resulting signal indicate a good alignment be-tween the tracks. The input chroma matrices are high-pass filtered along time. We re-implemented existing work us-ing a high-pass filter with the alpha coefficient set to 0.99. To compute the cross-correlation, we used a 2-dimensional FFT. This, on one hand, allows to find the optimal lag in the time dimension, and on the other hand, to find the best transposition shift along the chroma pitches. To emphasize sharp local maxima, the resulting cross-correlation signal is high-pass filtered. The final distance between two songs is taken as the reciprocal of the peak value of the cross-correlated signal.
3. COMBINING REJECTORS
The core of our method lies in the combination of rejectors. We first build probabilistic rejectors based on global fea-tures and combine them to produce a composite rejector. We evaluate several probabilistic fusion rules. Then, we combine that composite rejector with two other rejectors based on chroma features, using rank aggregation meth-ods. This section details both kinds of combinations.
3.1 Score-based Combination
As stated in Section 2.1, previous work shows that rejec-tors based on global features such as the tempo or the du-ration of the songs do not produce satisfying results, when taken individually. It makes therefore sense to investigate their combination so that more information is taken into ac-count when comparing two songs. As the global rejectors estimate probabilities of cover identities, we evaluate sev-eral combination rules to take advantage of each feature. Multiple rules have been proposed as a mean of combining probability estimates for classification [7, 8, 15]. We select in particular the product, the sum and the median rules [15] and evaluate the combination of our probabilistic rejectors with them.
3.1.1 Product Rule
The probabilistic product decision rule combines the a pos-teriori probabilities generated by the individual rejectors by a product rule. For N rejectors, the rule is given by
p = 1 CsN −1 QN j=1Rj,s 1 CsN −1 QN j=1Rj,s+ 1 CdN −1 QN j=1Rj,d (1)
where Cs is the a priori probability of the similar class,
Cd is the a priori probability of the dissimilar class, and
Rj,s(respectively Rj,d) is the probability that the rejector
Rjconsiders the input tracks similar (respectively
dissim-ilar). According to [15], it is a severe rule as it is sufficient for one rejector to inhibit a particular interpretation by out-putting a close to zero probability for it.
3.1.2 Sum Rule
The sum probabilistic rule computes the final probability by computing the sum of each probability and averaging it by the number of rejectors. It is expressed as
p = 1 N N X i=1 Rj (2)
where N is the number of rejectors and Rjis the
probabil-ity returned by rejector j. For a set of classifiers that show independent noise behavior (e.g. based on different sets of features), the errors in the probability estimates are aver-aged by the summation [7]. In particular, the sum rule can be useful in reducing the noise for large sets of classifiers. 3.1.3 Median Rule
The median probabilistic rule is computed by taking the median of the individual probabilities. It is well estab-lished that the median is a robust estimate of the mean. The probabilistic sum in Equation 2 computes the average of the a posteriori probabilities. Therefore, if one rejector outputs an outlier probability, it will affect the final prob-ability and it could lead to an incorrect decision. In that case, it might be more appropriate to use the median rule rather than the sum rule [15].
3.2 Rank Aggregation
While the composite global rejectors built by probabilis-tic fusion rules output probability estimates, two remain-ing rejectors, based on chroma features, return scores on different scales. Consequently, the rules described in Sec-tion 3.1 do not apply for fusing all rejectors together. As each rejector returns a list of ordered tracks, we propose to fuse all rejectors based on rank aggregation techniques, adapted from the information retrieval literature. Rank ag-gregation methods have been particularly studied in the web literature [9, 21, 23]. Compared to score-based com-bination, rank-aggregation is more suited as it is naturally calibrated and scale insensitive [21]. Indeed, using the re-turned scores requires to rescale the score values to the same range (e.g. between 0 and 1) so that different scales do not influence the aggregation results. Another advan-tage of rank aggregation is that the methods are usually computationally cheap as they usually consist in arithmetic operations on integer ranks. Furthermore, they require none or few parameters to set up.
In the case of cover song identification, each rejector compares queries to the entire search database and returns a full permutation of the database. Rank aggregation meth-ods look at the position of each track in each list, and com-pute an aggregated rank to be associated to each track in the final list. A new list of results is then built by set-ting each track at the new rank position.We evaluated three rank aggregation rules: minimum rank, mean rank, median rank. For each track, we retrieve its rank in each input list, which allows us to aggregate ranks by respectively com-puting the minimum, the mean and the median of the ranks for each track. The final aggregated list is then sorted ac-cording to the new rank. Details of the experiments and the results are given in Section 5.
4. EXPERIMENTAL SETUP 4.1 Evaluation Database
For evaluation, we use the Second Hand Song dataset1
(SHS), which is a subset of the Million Song Dataset [4] (MSD). The SHS is organized into 5,854 cliques, which correspond to groups of cover songs of original works. It contains on average 3.097 versions for 5,854 original songs. The SHS does not provide audio files, but con-tains pre-computed features such as the tempo, the dura-tion, the beats, the loudness and the chroma features for 18,196 tracks, which makes it suitable for our research. Furthermore, it has been used in several research papers [3, 13, 14, 18], which allows us to compare our results to other methods.
The SHS proposes a pre-defined learning set (LS) and test set (TS), respectively containing 70% (12,960 tracks) and 30% (5,236 tracks) of the samples. However, to evalu-ate our method with variable LS and TS sizes, we merged both provided sets into one large set of 18,196 songs so that we can split it to different LS and TS sizes. Typically, since
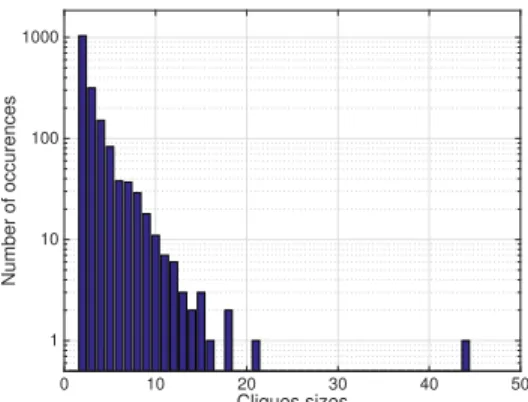
Cliques sizes 0 10 20 30 40 50 Number of occurences 1 10 100 1000
Figure 1: Distribution of the size of the cliques in the SHS dataset. Most of the cliques have a constant size of 2 or 3. However, some cliques contain more elements. The evalu-ation is therefore specific to that dataset as songs contain-ing more versions will be more likely to be identified.
supervised learning algorithms such as the random forests require a decent amount of training samples, we set the LS to 70% and the TS to 30% of the SHS. However, to inves-tigate how the system behaves on a larger scale, we also experimented with a larger TS containing 10,870 tracks. As the SHS provides a list of known duplicate tracks, we removed them from the dataset. Note that due to the re-moval of the duplicates, the number of cliques is reduced to 5,828, losing 26 cliques in the process.
It should be noted that the cliques in the SHS do not have a constant size, as can be seen in Figure 1. Although most of the cliques contain two elements, some cliques contain a lot more cover versions. Such songs containing many cover versions will be more likely to be identified in that evaluation set. The interpretation of the evaluated met-rics remains therefore limited to the SHS dataset, as they characterize not only the identification algorithm, but also the dataset used to assess them.
4.2 Rejectors
Each rejector described in Section 2 makes use of the fea-tures pre-computed in the SHS. We specifically make use of the tempo, the duration, the loudness, the beats as well as the chroma features. The chroma features provided in the SHS are aligned on onsets rather than on the beats. As our chroma rejectors make use of beat-synchronous chroma features, we aligned the provided chromas on the provided beats, therefore approaching the beat-aligned rep-resentation proposed in Ellis et al. [10]. Note that in the work of Khadkevich et al. [14], the authors computed their own chroma features and compared them to the ones pro-vided in the SHS. They report an improvement of 9.87% in terms of mean average precision against the chromas pro-vided in the SHS with their chroma extraction algorithm. We therefore expect our method to perform better using a different chroma implementation (compared to the results presented in Section 5).
To account for differences in key for our probabilistic rejector based on average chroma features, we compute the
OTI [25] between average chromas and shift one chroma accordingly, similarly to what is done in Section 2.2 with the codebook rejector.
For the random forest algorithm, we use both a LS con-taining 70% of the cliques (selected at random) of the SHS, and a LS containing 40% of the cliques to study how the system behaves on a larger scale. A model is learned for each feature by processing the samples of the learning set. Note that to avoid overfitting during the learning phase, the depth of the trees is limited and the optimal depth is found by maximizing the area under the Receiver
Oper-ating Characteristic(ROC). The models are learned with
100 trees and with a maximal depth of 11. 4.3 Evaluation Algorithm and Metrics
For evaluation, each track of the TS is taken as a query and compared to the remaining tracks of the TS using our rejectors. As the results are provided for each query as a list of tracks ordered by descending order of similarity, we compute scores such as the Mean Rank (MR) of the first identified cover, the Mean Reciprocal Rank (MRR) and the Mean Average Precision (MAP) [17]. The MR cor-responds to the mean position of the first identified query (lower is better). The MRR is computed as the average of the reciprocal of the rank of the first identified query (higher is better). The MAP for a set of queries corre-sponds to the mean of the average precision scores for each query (higher is better). Note that since we are interested in cover song identification rather than retrieval, we are only interested in retrieving at least one match for each query. Therefore, MR and MRR are more suited than the MAP as the latter takes into account the position of all matches in the list of results and is therefore only given as indicator. We also report the results in terms of the number of queries identified in top-k position, with k set to 10, 100 and 1000. This metric is also used in the MIREX evaluation [6].
5. RESULTS 5.1 Combining global rejectors
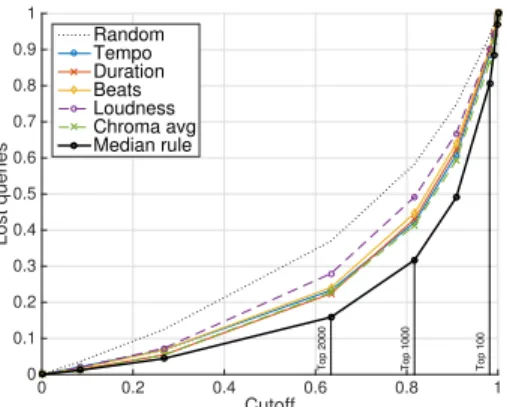
To investigate the behavior of probabilistic combination rules, as presented in Section 3.1, we combined our proba-bilistic rejectors based on global features using the product rule, the sum rule and the median rule. We first analyzed how each single rejector behaves on an evaluation database containing 5,464 tracks, compared to random classifica-tion. For the latter case, we simply built a rejector that outputs a probability sampled at random from a uniform distribution. Figure 2 shows curves corresponding to each rejector. Examination of the curves of the single rejectors shows that the rejector based on average chroma features performs better than the others (+92.5 % for top-10 and +18.5 % for top-100 compared to tempo). The tempo, beats and duration rejectors have similar curve shapes and perform similarly when taken individually. The composite median rule (in dark bold), obtained by fusing all single re-jectors using the rule described in Section 3.1.3, performs better than the individual rejectors. In terms of the number
Cutoff 0 0.2 0.4 0.6 0.8 1 Lost queries 0 0.1 0.2 0.3 0.4 0.5 0.6 0.7 0.8 0.9 1 Top 100 Top 1000 Top 2000 Random Tempo Duration Beats Loudness Chroma avg Median rule
Figure 2: Single rejectors based on global features and composite rejector resulting from the probabilistic median combination rule, with an evaluation set of 5,464 tracks. The composite rejector outperforms any single rejector.
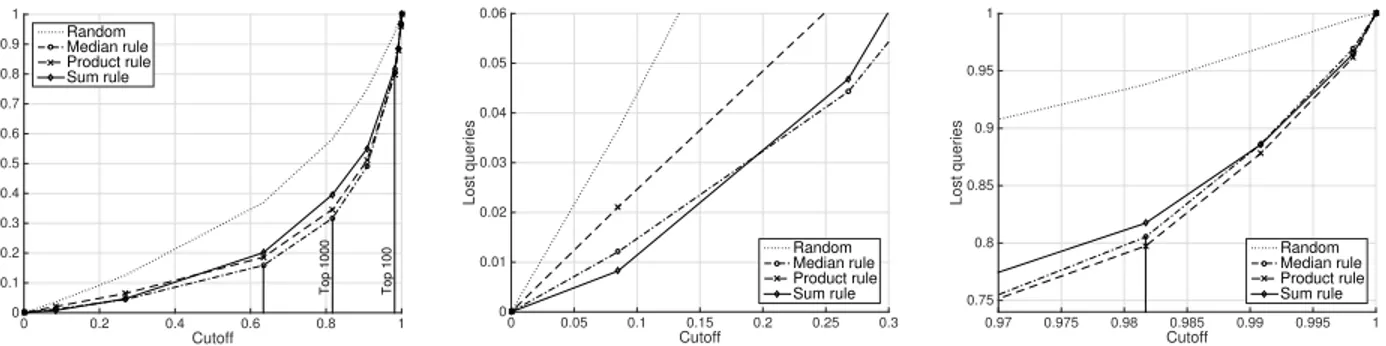
of tracks identified in the top-10, 100 and 1000, there is an improvement of respectively 62.5 %, 43.7 % and 16.4 %, compared to the average chroma rejector. In terms of MR and MRR, the composite rejector improves the scores by 24.9 % and 63.2 % respectively. To establish how all com-bination rules behave, Figure 3 displays the curves corre-sponding to each rule. Overall, all rules behave similarly. Zooming in the lower left corner (higher cutoff), the sum rule outperforms the product and the median. Compared to the median, the number of tracks identified in the top-5000 (lower-left area) is increased by 0.39% (5,419 tracks over 5,398). Similarly, the product rule outperforms other rules in the upper right corner (lower cutoff), with an increase of 24 % and 4 % for the top-10 and top-100 over the median rule. Our final choice is the median rule, as it produces a MR of 979.6 compared to 1127 and 1090 with the sum and product rules respectively.
5.2 Rank aggregation results
We combined the composite rejector based on global fea-tures with chroma based rejectors based on the quantiza-tion of chroma features and based on the cross correlaquantiza-tion of chroma sequences. The three rank aggregation methods described in Section 3.2 are evaluated. We first report the results on a TS containing 30% of the SHS samples con-taining 1,745 cliques and 5,464 queries. Table 1 shows the number of queries identified in the top 10, 100 and 1000 for each single rejector and for each aggregation rule. Ex-amining the results, we observe that each aggregation rule outperforms each single rejector. Best results for the top-10 returned tracks are achieved with the minimum aggre-gation rule. The number of identified tracks in the top-10 goes from 871 with the cross correlation rejector to 1004 with the minimum rule, which corresponds to an improve-ment of 15.2 %. Best results for the top-100 and top-1000 returned tracks are both achieved with the mean rule, with improvements of respectively 23.5 % and 7.19 %. Figure 4 shows the performance of the minimum rank aggregation rule against each single rejector. The zooms in the lower left and upper right corners indicate that the aggregated
Top Proba Cluster XCorr Min Mean Median 10 169 560 871 1004 972 916 100 1064 1731 1523 2042 2139 2113 1000 3732 3931 3386 4177 4214 4129
Table 1: Results for a TS of 1745 cliques and 5,464 tracks. Rank aggregation combinations increase the number of identified queries for each rule.
Proba Cluster XCorr Min Mean Median MR 979.6 861.4 1166 718.3 704.3 749.5 MRR 0.016 0.059 0.122 0.107 0.112 0.104 MAP 0.008 0.027 0.067 0.055 0.059 0.054
Table 2: Results for a TS of 1745 cliques and 5,464. Each rank aggregation combination outperforms single rejectors in terms of the Mean Rank (MR).
rejector performs better across the whole range of cutoff values. We also report the standard metrics (described in Section 4.3) in Table 2. Surprisingly, the MRR and MAP values are slightly decreased when compared to the best performing single rejector (cross-correlation, XCorr in the table). This might be due to the fact that when we aggre-gate the lists of results (Section 3.2), several tracks can be ranked at the same position. This might therefore affect the metrics. Note however that in terms of the Mean Rank, each combination outperforms each single rejector.
To establish how the aggregated rejectors scale on a larger dataset, we evaluated it on a TS containing 60% of the samples of the SHS. The LS used for learning the prob-abilistic rejectors is therefore smaller (40%) and produces decreased performance for the machine learning models built with random forests. That new TS contains 10,870 tracks, and is chosen to approach the size of the original SHS training set (12,960 tracks), to compare our results to results proposed in existing research papers [2, 13, 14]. We further increased the size of the TS by decreasing the size of the LS to 30% and 20% of the SHS. However, the pro-duced results with the probabilistic rejectors showed worse performance, due to the lack of enough learning samples for the random forest algorithm. Table 3 shows the results of our method against existing work. Note that care should be taken while reading these results as our probabilistic models do not perform as well as with a larger LS, and as the sizes and the contents of both evaluation databases dif-fer. In terms of the MR, our method is ranked at the second position.
6. CONCLUSION
In this paper, we evaluated multiple techniques for com-bining distances and features for cover song identification. We first made use of random forests to design probabilistic rejectors based on global features. We evaluated several standard combination rules such as the sum, the product and the median rules to build a composite rejector. Results show that combining single rejectors based on global
fea-Cutoff 0 0.2 0.4 0.6 0.8 1 Lost queries 0 0.1 0.2 0.3 0.4 0.5 0.6 0.7 0.8 0.9 1 Top 100 Top 1000 Random Median rule Product rule Sum rule Cutoff 0 0.05 0.1 0.15 0.2 0.25 0.3 Lost queries 0 0.01 0.02 0.03 0.04 0.05 0.06 Random Median rule Product rule Sum rule Cutoff 0.97 0.975 0.98 0.985 0.99 0.995 1 Lost queries 0.75 0.8 0.85 0.9 0.95 1 Random Median rule Product rule Sum rule
Figure 3: Performance of the probabilistic sum, product and median combination rules to build a composite rejector based on multiple global features. The second figure is a zoom of the left lower part (high cutoff). The sum rule performs slightly better in that area. The third figure is a zoom of the upper right area. The product rule performs slightly better there.
Cutoff 0 0.2 0.4 0.6 0.8 1 Lost queries 0 0.1 0.2 0.3 0.4 0.5 0.6 0.7 0.8 0.9 1 Top 100 Top 1000 Random rejector Composite rejector Quantization XCorr Min aggregation Cutoff 0 0.05 0.1 0.15 0.2 0.25 0.3 0.35 Lost queries 0 0.01 0.02 0.03 0.04 0.05 0.06 Random rejector Composite rejector Quantization XCorr Min aggregation Cutoff 0.99 0.992 0.994 0.996 0.998 1 Lost queries 0.7 0.75 0.8 0.85 0.9 0.95 1 Random rejector Composite rejector Quantization XCorr Min aggregation
Figure 4: Performance of the minimum aggregation rule against rejectors based on global features (composite), quanti-zation of chroma features and cross-correlation of chroma sequences (XCorr) on a database containing 5,464 tracks. The second figure is a zoom of the lower left corner (high cutoff) and the third figure is a zoom of the upper right corner (low cutoff). In each case, the aggregation increases the number of identified tracks.
Method MR MAP
Khadkevich et al. [14] 958.2 0.10 Rank Aggregation (10,870 tracks) 1,455.6 0.048 Bertin-Mahieux et al. 2D-FTM (200 pcs) [3] 3,005 0.09
Humphrey et al. [13] 1,844 0.28
Table 3: Comparison of the rank aggregation method against existing methods evaluated on the SHS original training set. Care should be taken when reading the results as the original SHS training set contains 12,960 songs, and our subset contains 10,870 tracks sampled from the SHS.
tures improves the performance compared to single clas-sifiers. We proposed to combine the composite rejector based on global features with rejectors based on chroma features. To take into account the harmonic content of the songs, we introduced a rejector based on comparing histograms of quantized chroma features. To account for temporal information, we further implemented a baseline rejector performing cross-correlations between sequences of chroma features. As all these rejectors return values on different scales, we proposed to combine them at the rank level. We evaluated several rank aggregation meth-ods such as the mean, the median and the minimum ag-gregation rules. We conducted experiments on the Second
Hand Song dataset and observed that aggregation meth-ods outperform methmeth-ods in isolation for cover song identi-fication. Results are provided in terms of standard metrics such as the mean rank of the first match, the mean recip-rocal rank and the mean average precision, as well as in terms of the total number of queries identified in the top-k results. Compared to single rejectors, the minimum ag-gregation rule shows an improvement of up to 23.5 % of the number of queries identified in the top-100 returned tracks. Comparing our results to existing work, we observe that our method does not perform as well as other methods in terms of mean average precision. However, in terms of mean rank of the first identified query, the results are comparable to related methods and rank our method at the second position. Although our method does not produce state-of-the-art results, we showed that aggregating multi-ple features and distance measures does increase the num-ber of identified queries. These results suggest that com-bining many other features as well as multiple comparison algorithms could lead to significant improvements in any cover song identification system. Future work therefore in-cludes more experiments with features taking into account e.g. the melodic line of the songs, or structural informa-tion. In any case, many combining experiments should still be performed to improve state-of-the art results.
7. REFERENCES
[1] T. Ahonen. Compression-based clustering of chroma-gram data: New method and representations. In Inter-national Symposium on Computer Music Modeling and Retrieval, pages 474–481, 2012.
[2] T. Bertin-Mahieux and D. Ellis. Large-scale cover song recognition using hashed chroma landmarks. In Pro-ceedings of IEEE Workshop on Applications of Signal Processing to Audio and Acoustics, 2011.
[3] T. Bertin-Mahieux and D. Ellis. Large-scale cover song recognition using the 2D Fourier transform magnitude. In Proceedings of the 13th International Conference on Music Information Retrieval (ISMIR 2012), 2012.
[4] T. Bertin-Mahieux, D. Ellis, B. Whitman, and
P. Lamere. The million song dataset. In Int. Symp. Mu-sic Inform. Retrieval (ISMIR), 2011.
[5] L. Breiman. Random forests. Machine Learning, 45(1):5–32, Jan. 2001.
[6] J. Downie, A. Ehmann, M. Bay, and M. Jones. The mu-sic information retrieval evaluation exchange: Some observations and insights. In Advances in music infor-mation retrieval, pages 93–115. Springer, 2010. [7] R. Duin. The combining classifier: to train or not to
train? In IEEE Int. Conf. Pattern Recognition (ICPR), volume 2, pages 765–770, Quebec City, Canada, Aug. 2002.
[8] R. Duin and D. Tax. Experiments with classifier com-bining rules. In Multiple Classifier Systems, volume 1857 of Lecture Notes in Comp. Science, pages 16–29. Springer, 2000.
[9] C. Dwork, R. Kumar, M. Naor, and D. Sivakumar. Rank aggregation methods for the web. In Proceedings of the 10th international conference on World Wide Web, pages 613–622. ACM, 2001.
[10] D. Ellis and G. Poliner. Identifying cover songs with chroma features and dynamic programming beat track-ing. In Int. Conf. Acoustics, Speech and Signal Process. (ICASSP), volume 4, 2007.
[11] P. Foster, S. Dixon, and A. Klapuri. Identifying cover songs using information-theoretic measures of similarity. Audio, Speech, and Language Processing, IEEE/ACM Transactions on, 23(6):993–1005, June 2015.
[12] Z. Fu, G. Lu, K. Ming Ting, and D. Zhang. Music classification via the bag-of-features approach. Pattern Recognition Letters, 32(14):1768 – 1777, 2011. [13] E. Humphrey, O. Nieto, and J. Bello. Data driven and
discriminative projections for large-scale cover song identification. In Int. Symp. Music Inform. Retrieval (ISMIR), 2013.
[14] M. Khadkevich and M. Omologo. Large-scale cover song identification using chord profiles. In Int. Symp. Music Inform. Retrieval (ISMIR), pages 233–238, 2013.
[15] J. Kittler, M. Hatef, R. Duin, and J. Matas. On combin-ing classifiers. IEEE Trans. Pattern Anal. Mach. Intell., 20(3):226–239, Mar. 1998.
[16] F. Kurth and M. Muller. Efficient index-based audio matching. Audio, Speech, and Language Processing, IEEE Transactions on, 16(2):382–395, 2008.
[17] C. Manning, P. Raghavan, and H. Schütze. Introduction to information retrieval, volume 1. Cambridge univer-sity press Cambridge, 2008.
[18] B. Martin, D. Brown, P. Hanna, and P. Ferraro. Blast for audio sequences alignment: A fast scalable cover identification tool. In ISMIR, pages 529–534, 2012. [19] J. Osmalskyj, S. Piérard, M. Van Droogenbroeck, and
J.-J. Embrechts. Efficient database pruning for large-scale cover song recognition. In Int. Conf. Acoustics, Speech and Signal Process. (ICASSP), pages 714–718, Vancouver, Canada, May 2013.
[20] J. Osmalskyj, M. Van Droogenbroeck, and J.-J. Em-brechts. Performances of low-level audio classifiers for large-scale music similarity. In International Confer-ence on Systems, Signals and Image Processing (IWS-SIP), pages 91–94, Dubrovnik, Croatia, May 2014. [21] R. Prati. Combining feature ranking algorithms
through rank aggregation. In Neural Networks
(IJCNN), The 2012 International Joint Conference on, pages 1–8. IEEE, 2012.
[22] S. Ravuri and D. Ellis. Cover song detection: from high scores to general classification. In Acoustics Speech and Signal Processing (ICASSP), 2010 IEEE Interna-tional Conference on, pages 65–68. IEEE, 2010. [23] D. Sculley. Rank aggregation for similar items. In
SDM, pages 587–592. SIAM, 2006.
[24] J. Serra. Identification of versions of the same musi-cal composition by processing audio descriptions. PhD thesis, Universitat Pompeu Fabra, Barcelona, 2011. [25] J. Serra and E. Gómez. Audio cover song
identifi-cation based on tonal sequence alignment. In Acous-tics, Speech and Signal Processing, 2008. ICASSP 2008. IEEE International Conference on, pages 61–64. IEEE, 2008.
[26] J. Serra, E. Gomez, P. Herrera, and X. Serra. Chroma binary similarity and local alignment applied to cover song identification. IEEE Trans. Audio, Speech and Language Process., 16(6):1138–1152, 2008.
[27] A. Wang. An industrial-strength audio search algo-rithm. In Int. Symp. Music Inform. Retrieval (ISMIR), pages 7–13, 2003.