Laboratoire Temps-Fréquence
ALL-OPTICAL
MICROWAVE GENERATION
USING FREQUENCY COMBS
Thèse présentée à la Faculté F A C U L T É D E S S C I E N C E S
U N I V E R S I T É D E NE U C H Â T E L
pour l’obtention du grade de D O C T E U R È S S C I E N C E S
par
V L A D I M I R D O L G O V S K I Y
Dipl.-Phys. (Université d’Etat de Moscou Lomonosov)
acceptée le 11.07.2012 sur proposition du jury : Prof. Dr Thomas Südmeyer, Directeur
Prof. Dr Yann Kersalé, Rapporteur Prof. Dr Pierre Thomann, Rapporteur
Dr Stéphane Schilt, Rapporteur
•
U11
1e
FA CUL TE DES SCIENCES Secrétariat-Décanat de la facultéRue Emile-Argand 11 CH-2000 Neuchatel
UNIVERSITÉ DE
NEUCHÂTEL
IMPRIMATUR POUR LA THESE
All-optical microwave generation
using frequency combs
Vladimir DOLGOVSKIV
UNIVERSITE DE NEUCHATEL
FACULTE DES
SCIENCES
La Faculté des sciences de l'Université de Neuchâtel
autorise l'impression de la présente thèse
sur le rapport des membres du jury :
Prof. Thomas Südmeyer, directeur de thèse, Université de Neuchâtel
Prof. hon. Pierre Thomann, Université de Neuchâtel
Prof. Yann Kersalé, Institut FEMTO-ST, Besançon, France
Dr Stéphane Schilt, Université de Neuchâtel
Le doyen
Prof. Peter Kropf
Neuchâtel, le 15 novembre 2012
Acknowledgments
I would like to thank my supervisor Prof. Thomas Südmeyer for his confidence and a given full freedom of action in the end of my PhD. Without his wise and resolute direction this dissertation would not have been possible.
I am truly indebted and thankful to my advisor Dr. Stéphane Schilt for his re-markable support and assistance which helped me a lot in solving the problems and overcoming the obstacles and always pulled me out of despair. His enthusiasm and dedication to work have inspired me to take my fascination with physics seriously.
I owe sincere and earnest thankfulness to Prof. Pierre Thomann and Dr. Gianni Di Domenico who have invited me to join Laboratoire Temps-Fréquence and who have supported me with their encouragement, excellent guidance and thorough knowledge all along this PhD dissertation, being always helpful and open for discus-sions.
I would like to thank Laurent Giriens for the efficient and pleasant collabora-tion in our long-lasting yet more productive discussions on the design of the vac-uum chamber and the multilayer enclosures destined to mount the high-finesse cav-ity.
I would like to show my gratitude to Daniel Varidel for his interest and in-volvement, which made the work with electronics so enjoyable and fun. I would also like to thank Marc Dürrenberger, Dominique Schenker and Patrick Scherler for their contribution and experience which they were kind to share.
Many thanks to Christian Hêche and to all the mechanical workshop, André Cornu and Isidro Fernandez, for your welcomeness, your amazing apéros and thank you for working late during the deadlines. It was a great pleasure to have you so close all that time.
I would like to thank the whole Time and Frequency department in Femto-ST in Besançon, for their hospitality and superior knowledge in the physics of micro-wave oscillators. It was an amazing time working together with Serge Grop and Be-noît Dubois during the move of ULISS to Neuchâtel. I am indebted to Prof. Vin-cent Giordano, thanks to whom the collaboration and as a fact the evaluation of
vi Acknowledgments
our microwaves was possible, and many thanks to Prof. Yann Kersalé and Prof. Enrico Rubiola for having peerless discussions with all of you.
I would also like to address particular thanks to Prof. Ursula Keller’s Ultrafast Laser Physics group from ETH Zurich for the collaboration and the development of the ERGO frequency comb, and for putting this nice laser at our disposal, without which an important part of the work presented here would not have been possible. Special thanks to Dr. Max Stumpf and Dr. Selina Pekarek for their suggestions and the conveyed experience.
Special thanks to Muriel Vallery for providing aid with the organization of con-ference travels and taking care of my inscription to the University. I would not have been able to spend as much time working on the dissertation unless Muriel helped out so much.
I would also like to show my gratitude to all my colleagues for the friendly and relaxed ambience which you were ensuring for most of the time. It was delightful to meat you all here and to make friends with you.
I sincerely appreciate the emotional support from my parents and girlfriend. I thank them for understanding and resisting my writing period. Besides, I would like to thank myself for not giving up.
Keywords – Mots clés
Keywords
optical frequency combs, ultra-stable lasers, time and frequency metrology, micro-wave generation, optical oscillator, mode-locked lasers, diode-pumped solid-state la-sers, noise measurements, frequency discriminators, high finesse optical cavity
Mots clés
peignes de fréquences optiques, lasers ultra-stables, métrologie temps-fréquence, génération de micro-onde, oscillateur optique, lasers à verrouillage de modes, lasers à corps solide pompés par diode, mesures de bruit, discriminateurs de fréquence, cavité optique à haute finesse
Abstract
This thesis describes the development and realization of an ultra-stable micro-wave oscillator based on optical-to-micromicro-wave frequency transfer using two different optical frequency comb technologies.
Optical frequency combs establish a phase-coherent flywheel bridging between radio frequencies (RF) and optical frequencies. The main comb technologies are re-alized today through femtosecond Ti:sapphire (Ti:Sa) and fiber modelocked lasers as well as through recent systems based on diode-pumped solid state lasers (DPSSL). The best results on microwave generation have been obtained using Ti:Sa frequency combs thanks to their low noise levels. However, the use of those systems suffers from some practical disadvantages, such as their bulkiness, high-cost and non-efficient green pumping, limiting the area of applicability. The fiber-based ul-trafast lasers represent a good alternative to Ti:Sa laser, which allow overcoming those drawbacks. However, they are less favorable in terms of noise and modulation bandwidth that is essential for the comb control. DPSSL combs proved themselves as a very promising technology yielding high peak powers without the need of any further amplification, resulting in a low quantum noise limit. These combs are be-neficent in terms of low-cost diode pumping and they feature a few more important properties and achievements, such as high repetition rates, attractive for low-noise microwave generation.
In this thesis the noise properties of an Er:Yb:glass laser oscillator frequency comb, referred to as ERGO and developed in ETH Zurich, have been investigated in comparison to a commercial Er:fiber optical frequency comb. The stabilization of the CEO frequency to an RF reference results in a residual fractional frequency sta-bility improved by a factor 20 compared to the Er:fiber comb. The measured CEO integrated phase noise is only 0.72 rad rms, which is one of the lowest values re-ported for a self-referenced comb the 1.5-µm spectral region.
This thesis provides new insights to the understanding of the noise in a fiber frequency comb not only from the experimental point of view but also by providing a theoretical model that studies the cross-influence between the CEO and repetition
x Abstract
rate stabilization loops. A significant impact of the CEO stabilization loop to both the repetition rate and an optical comb line was reported. A theoretical model was developed and showed a very good agreement with experimental data. This model enables not only the frequency noise of any comb line to be predicted, but also gives useful information on the optimization of the two feedback loop parameters re-quired to achieve a desired noise performance at a given optical frequency.
Within this thesis, a multilayer vacuum enclosure system was designed, built, assembled and characterized, with the aim of achieving a high filtering of any ex-ternal thermal perturbation that might affect the high-finesse Fabry-Perot cavity used as an optical reference in the realization of an all-optical frequency oscillator. A novel planar-waveguide external cavity diode laser technology was tested and implemented to build an ultra-stable optical reference. This laser showed several advantages in comparison to a conventional external-cavity diode laser, such as its compactness, reliability and smaller drift.
Furthermore, microwave signals were generated via optical-to-microwave fre-quency division using both the ERGO and an Er:fiber frefre-quency combs. The evaluation of the generated microwave signals was conducted in collaboration with Femto-ST Besançon, who provided us a transportable ultra-stable microwave fre-quency reference based on a cryogenically-cooled sapphire oscillator. The microwave signals generated with the two combs showed a similar fractional frequency stability of 5× at 1 s and several possible present limitations have been investigated. However, the use of the ERGO comb proved to be beneficial compared to the Er:fiber comb in terms of close-to-carrier phase noise of the microwave signal, re-sulting in a 20 dB improvement in a large Fourier frequency range (100 Hz – 100 kHz) offset from a 10-GHz carrier. The benefit of the ERGO comb is not only favorable in the conditions of the experiments reported in this thesis, but the achieved results are also comparable or even overcoming the lowest phase noise re-ported to date for commercial Er:fiber combs in the same 1.5-µm spectral range us-ing a similar stabilization scheme without the implementation of special tools. This achievement highlights a new track for the developers of photonic oscillators, such as the use of the high-repetition DPSSLs and the flexibility on the choice of wave-length achievable with various DPSSL combs.
15 10
-Table of Contents
Acknowledgments ... v
Keywords – Mots clés ... vii
Keywords... vii Mots clés ... vii Abstract... ix Table of Contents ... xi List of Acronyms ...xv Publications ...xix Journal papers...xix Conference papers ...xx Chapter 1 Introduction...1
Chapter 2 Noise in oscillators and characterization methods ...5
2.1 Introduction ...5
2.2 Basics ...6
2.2.1 Phase and frequency noise ...6
2.2.2 Allan deviation...7
2.3 A simple approximation for the linewidth of a laser ...8
2.4 RF discriminators ...10
2.4.1 Analog phase-locked loop discriminator...11
2.4.2 Miteq RF discriminator ...12
2.4.3 Numerical phase-locked loop HF2PLL discriminator ...13
2.4.4 Digital phase detector DXD200 ...14
2.5 Characterization of RF discriminators ...16
2.5.1 Sensitivity and bandwidth ...16
2.5.2 Frequency range...18
2.5.3 Noise floor ...19
2.5.4 AM/AN cross-sensitivity...21
2.6 Comparison of RF discriminators ...23
2.7 Conclusion ...27
Chapter 3 Ultra-stable laser ...31
3.1 Introduction ...31
3.2 Laser stabilization...32
3.2.1 Basics of servo loops ...32
xii Table of contents
3.2.2 Basics of Pound-Drever-Hall stabilization ...35
3.3 Lasers ...37
3.3.1 Description ...37
3.3.2 Lasers transfer functions ...40
3.3.3 Free-running lasers noise...41
3.4 High-finesse Fabry-Perot cavity ...45
3.4.1 ULE cavity...45
3.4.2 Thermal noise limit ...46
3.4.3 Mode-matching ...48
3.5 Cavity thermal enclosure ...51
3.5.1 Motivation...51
3.5.2 Sensitivity of Fabry-Perot cavity to external perturbations...52
3.5.3 Design ...56
3.6 Pound-Drever-Hall Stabilization...58
3.6.1 Scheme ...58
3.6.2 Noise of the stabilized lasers ...60
3.7 High-finesse Fabry-Perot cavity characterization...62
3.7.1 Cavity ring down time ...62
3.7.2 Characterization of a resonance with a phase-locked PW-ECL ...62
3.8 Thermal properties ...67
3.8.1 Coarse measurement with a simple cavity enclosure ...68
3.8.2 Precise measurement in the final enclosure ...70
3.9 Conclusion ...72
Chapter 4 Coupled servo-loops in a fully-stabilized Er:fiber optical frequency comb75 4.1 Introduction ...75
4.2 Fundamentals of frequency combs...77
4.2.1 Frequency combs and degrees of freedom ...77
4.2.2 Self-referencing ...79
4.2.3 Noise sources in frequency combs ...80
4.3 Er:fiber frequency comb...81
4.3.1 Er:fiber comb architecture ...81
4.3.2 Er:fiber comb stabilization...83
4.4 Frequency comb dynamic response...84
4.4.1 Repetition rate and CEO dynamic control ...84
4.4.2 Frequency dependence of the comb quasi-fixed point...90
4.5 Coupling between the two comb servo loops...94
4.5.1 Model of the coupled servo loops ...94
4.5.2 Complete model of the coupled servo-loops accounting for the noise of the frequency references ...98
Table of contents xiii
4.5.3 Impact of the CEO stabilization on the repetition rate... 101
4.6 Noise of an optical comb line... 104
4.6.1 CEO contribution to the optical frequency noise ... 105
4.6.2 Impact of the servo-loops coupling ... 107
4.6.3 Noise suppression by the servo loop coupling at different wavelengths... 112
4.7 Conclusion ... 114
Chapter 5 Full stabilization and characterization of a novel 1.5-µm DPSSL comb 117 5.1 Introduction ... 117
5.2 Er:Yb:glass oscillator based ultrafast laser ... 118
5.3 Comb control ... 120
5.3.1 Static control... 120
5.3.2 Dynamic control... 124
5.4 Comb noise properties ... 130
5.4.1 Carrier-envelope offset ... 130
5.4.2 Noise of an optical comb line ... 135
5.5 Conclusion ... 138
Chapter 6 Ultra-stable microwave generation with optical frequency combs ... 141
6.1 Introduction ... 141
6.2 Optical-to-microwave frequency division using an optical frequency comb .. 142
6.3 Cryogenic sapphire oscillator ... 144
6.4 Ultra-stable microwave generation ... 147
6.4.1 Optical-to-microwave frequency division using an Er:fiber comb... 149
6.4.2 Optical-to-microwave frequency division with a DPSSL comb ... 151
6.5 Ultra-stable microwave characterization ... 152
6.5.1 Frequency stability ... 152
6.5.2 Phase noise... 155
6.6 Investigation of possible limitations ... 162
6.6.1 AM-to-PM conversion in microwave generation... 162
6.6.2 Power-to-frequency conversion in the reference cavity ... 164
6.6.3 Fiber noise contribution to microwave fractional frequency stability... 167
6.6.4 Feedback to various actuators ... 169
6.7 Conclusion ... 172
Chapter 7 Conclusion and outlook ... 177
List of Acronyms
AM amplitude modulation
AN amplitude noise
AOM acousto-optic modulator
BW bandwidth
CEO carrier-envelope offset
CSO cryogenically-cooled sapphire oscillator
CTE coefficient of thermal expansion
DDS direct digital synthesizer
DFB distributed feedback laser
DPSSL diode-pumped solid state laser
DRO dielectric resonator oscillator
DWDM dense wavelength division-multiplexing
ECDL external cavity diode laser
EDFA erbium-doped fiber amplifiers
ELISA cryo-cooled sapphire oscillator built by Femto-ST for ESA
xvi List of acronyms
EOM electro-optic modulator
ERGO Er:Yb:glass laser oscillator
ESA European Space Agency
FFT fast Fourier transform
FM frequency modulation
FN frequency noise
FPGA field-programmable gate array
FSR free-spectral range
FWHM full width at half maximum
GPO group-phase offset
GTI Gires-Tournois interferometer
HF2PLL dual input digital lock-in amplifier extended with dual PLL capabilities used as a numerical phase detector
HWHM half-width at half maximum
ITU international telecommunication union
LHe liquid helium
LTF Laboratoire Temps-Fréquence
List of acronyms xvii
MIMO multiple-input multiple-output
PBG planar Bragg grating
PDH Pound-Drever-Hall
PI proportional-integral
PID proportional-integral-derivative
PLC planar lightwave circuit
PLL phase lock loop
PM polarization-maintaining
PM-HNLF polarization-maintaining, highly nonlinear fiber
PSD power spectral density
PW-ECL planar-waveguide external cavity laser
PZT piezoelectric transducer
RF radio-frequency
RIN relative intensity noise
SESAM semiconductor saturable absorber mirror
SFP scanning Fabry-Perot interferometer
SSB single-sideband
xviii List of acronyms
Ti:Sa Ti:sapphire
ULE ultra-low thermal expansion
ULISS ultra-low instability signal source
VCO voltage-controlled oscillator
VCPS voltage controlled phase shifter
VLBI very long baseline interferometry
Publications
Parts of this thesis are published in the following journal papers and conference proceedings.
Journal papers
1. S. Schilt, N. Bucalovic, V. Dolgovskiy, C. Schori, M.C. Stumpf, G. Di Domenico, S. Pekarek, A.E.H. Oehler, T. Südmeyer, U. Keller, P. Thomann
Fully stabilized optical frequency comb with sub-radian CEO phase noise from a SESAM mode-locked 1.5-µm solid-state laser
Opt. Express 19(24), 24171-24181 (2011)
2. S. Schilt, N. Bucalovic, L. Tombez, V. Dolgovskiy, C. Schori, G. Di Domenico, M. Zaffalon, P. Thomann
Frequency discriminators for the characterization of narrow-spectrum heterodyne beat signals: application to the measurement of a sub-hertz carrier-envelope-offset beat in an optical fre-quency comb
Rev. Scient. Instr. 82(12), 123116 (2011)
3. S. Schilt, V. Dolgovskiy, N. Bucalovic, C. Schori, M.C. Stumpf, G. Di Domenico, S. Pekarek, A.E.H. Oehler, T. Südmeyer, U. Keller, P. Thomann
Noise properties of an optical frequency comb from a SESAM-modelocked 1.5-µm solid-state laser stabilized to the 10-13 level
Appl. Phys. B 109(3), 391-402 (2012), DOI 10.1007/s00340-012-5072-z
4. V. Dolgovskiy, N. Bucalovic, P. Thomann, C. Schori, G. Di Domenico, S. Schilt
Cross-influence between the two servo-loops of a fully-stabilized Er:fiber optical frequency comb J. Opt. Soc. Am. B, 29(10), 2944-2957 (2012)
5. N. Bucalovic, V. Dolgovskiy, C. Schori, P. Thomann, G. Di Domenico, S. Schilt
Experimental Validation of a Simple Approximation to Determine the Linewidth of a Laser from its Frequency Noise Spectrum
Appl. Optics, 51(20), 4582-4588 (2012)
xx Publications
6. V. Giordano, S. Grop, B. Dubois, P.-Y. Bourgeois, Y. Kersalé, G. Haye, V. Dolgovskiy, N. Bucalovic, G. Di Domenico, S. Schilt, J. Chauvin, D. Valat, E. Rubiola
New-generation cryogenic sapphire microwave oscillators for space, metrology and scientific applications
Rev. Sci. Instrum. 83(8), 085113 (2012)
7. N. Bucalovic, V. Dolgovskiy, M. Stumpf, C. Schori, G. Di Domenico, U. Keller, S. Schilt, and T. Südmeyer
Effect of the Carrier-Envelope-Offset Dynamics on the Stabilization of a Diode-Pumped Solid-State Frequency Comb
Opt. Lett. 37(21), 4428-4430 (2012)
8. V. Dolgovskiy, N. Bucalovic, G. Di Domenico, S. Schilt, S. Grop, B. Dubois, V. Giordano, M.C. Stumpf, S. Pekarek, U. Keller, T. Südmeyer
Ultra-stable microwave generation with a diode-pumped solid-state laser in the 1.5-µm range In preparation
Conference papers
1. V. Dolgovskiy, S. Schilt, G. Di Domenico, D. Hofstetter, P. Thomann Thermal design of a high-finesse cavity enclosure for an ultra-stable laser
EFTF 2010, 24th European Frequency and Time Forum, Noordwijk, The Netherland, poster 2. V. Dolgovskiy, S. Schilt, G. Di Domenico, D. Hofstetter, P. Thomann
Towards an all-optical ultra-stable microwave oscillator based on an optical frequency comb Annual Meeting of the Swiss Physical Society, Basel, Switzerland, June 21-22, 2010, poster #222
3. S. Schilt, M.C. Stumpf, L. Tombez, N. Bucalovic, V. Dolgovskiy, G. Di Domenico, D. Hofstetter, S. Pekarek, A.E.H. Oehler, T. Südmeyer, U. Keller, P. Thomann
Phase noise characterization of a near-infrared solid-state laser optical frequency comb for ul-tra-stable microwave generation
Optical Clock Workshop, Torino, Italy, December 1-3, 2010, oral presentation
4. S. Schilt, V. Dolgovskiy, N. Bucalovic, L. Tombez, M.C. Stumpf, G. Di Domenico, C. Schori, S. Pekarek, A.E.H. Oehler, T. Südmeyer, U. Keller, P. Thomann
Optical frequency comb with sub-radian CEO phase noise from a SESAM-modelocked 1.5-µm solid-state laser
CLEO-2011, Baltimore, USA; May 1-6, 2011, oral CFK3
5. V. Dolgovskiy, S. Schilt, G. Di Domenico, N. Bucalovic, C. Schori, P. Thomann 1.5-µm Cavity-Stabilized Laser for Ultra-Stable Microwave Generation
Publications xxi
6. S. Schilt, N. Bucalovic, V. Dolgovskiy, C. Schori, L. Tombez, G. Di Domenico, M.C. Stumpf, S. Pekarek, A.E.H. Oehler, T. Südmeyer, U. Keller, P. Thomann
Low-Noise Near-Infrared Optical Frequency Comb from a Solid-State Femtosecond Laser Joint IFCS/EFTF Conference, San Francisco, USA, May 1-5, 2011, oral #132
7. S. Schilt, G. Di Domenico, N. Bucalovic, V. Dolgovskiy, L. Tombez, C. Schori, P. Thomann Characterization of Narrow-Linewidth Beat Signals using Different Frequency Discriminators IFCS/EFTF Conference, San Francisco, USA, May 1-5, 2011, poster #229
8. S. Schilt, V. Dolgovskiy, N. Bucalovic, L. Tombez, M.C. Stumpf, G. Di Domenico, C. Schori, S. Pekarek, A.E.H. Oehler, T. Südmeyer, U. Keller, P. Thomann
Low-Noise Near-Infrared Optical Frequency Comb from a Femtosecond Diode-Pumped Solid State Laser
CLEO-Europe 2011, Munich, Germany; May 22-26, 2011, poster EG.P.5 TUE
9. S. Schilt, N. Bucalovic, V. Dolgovskiy, C. Schori, L. Tombez, G. Di Domenico, M.C. Stumpf, S. Pekarek, A.E.H. Oehler, T. Südmeyer, U. Keller, P. Thomann
Noise properties of an optical frequency comb stabilized to the 10-13 level
8th International Conference on Tunable Diode Laser Spectroscopy (TDLS), Zermatt, Switzer-land, July 11-15, 2011, oral presentation L2
10. N. Bucalovic, S. Schilt, V. Dolgovskiy, C. Schori, L. Tombez, G. Di Domenico, M.C. Stumpf, S. Pekarek, A.E.H. Oehler, T. Südmeyer, U. Keller, P. Thomann
Er:Yb:Glass Oscillator (ERGO): a Low-Noise Optical Frequency Comb for Frequency Metrol-ogy
Joint Annual Meeting of the Austrian & Swiss Physical Societies, EPF Lausanne, Switzerland, June 15-17, 2011, poster #236
11. V. Dolgovskiy, S. Schilt, G. Di Domenico, C. Schori, P. Thomann
All-optical low-noise microwave generation from a 1.5-µm ultra-stable laser
Joint Annual Meeting of the Austrian & Swiss Physical Societies, EPF Lausanne, Switzerland, June 15-17, 2011, poster #237
12. N. Bucalovic, S. Schilt, V. Dolgovskiy, C. Schori, L. Tombez, G. Di Domenico, M.C. Stumpf, S. Pekarek, A.E.H. Oehler, T. Südmeyer, U. Keller, P. Thomann
Er:Yb:Glass Oscillator (ERGO): a Low-Noise Optical Frequency Comb for Frequency Metrol-ogy
43rd Congress of the European Group on atomic Systems (EGAS), Fribourg, Switzerland, June 28-July 2, 2011, poster #AAP-002
13. V. Dolgovskiy, S. Schilt, G. Di Domenico, C. Schori, P. Thomann
All-optical low-noise microwave generation from a 1.5-µm ultra-stable laser
43rd Congress of the European Group on atomic Systems (EGAS), Fribourg, Switzerland, June 28-July 2, 2011, poster #AAP-005
xxii Publications
14. T. Südmeyer, S. Pekarek, M.C. Stumpf, A.E.H. Oehler, S. Schilt, V. Dolgovskiy, N. Bucalovic, C. Schori, L. Tombez, G. Di Domenico, C. Fiebig, K. Paschke, G. Erbert, P. Thomann, U. Keller
Compact frequency combs
20th International Laser Physics Workshop, Sarajevo, Bosnia and Herzegovina, July 11-15, 2011, invited talk
15. V. Dolgovskiy, N. Bucalovic, C. Schori, P. Thomann, G. Di Domenico, S. Schilt
Correlated Impact of the Feedback Loops on the Noise Properties of an Optical Frequency Comb
DPG conference, Stuttgart, Germany; March 12-16, 2012, oral Q 28.4
16. N. Bucalovic, V. Dolgovskiy, M.C. Stumpf, C. Schori, P. Thomann, G. Di Domenico, S. Pekarek, A.E.H. Oehler, T. Südmeyer, U. Keller, S. Schilt
Importance of the Carrier-Envelope-Offset Dynamics in the Stabilization of an Optical Fre-quency Comb
EFTF 2012, 26th European Frequency and Time Forum, Gothenburg, Sweden; April 23-27, 2012, oral #3148
17. N. Bucalovic, V. Dolgovskiy, C. Schori, P. Thomann, G. Di Domenico, S. Schilt
Experimental Validation of a Simple Approach to Determine the Laser Linewidth from the Frequency Noise Spectrum
EFTF 2012, 26th European Frequency and Time Forum, Gothenburg, Sweden; April 23-27, 2012, poster 3147
18. V. Dolgovskiy, N. Bucalovic, C. Schori, P. Thomann, G. Di Domenico, S. Schilt
Impact of the Coupling between the Two Servo-Loops in a Self-Referenced Er:Fiber Optical Frequency Comb
EFTF 2012, 26th European Frequency and Time Forum, Gothenburg, Sweden; April 23-27, 2012, poster 3167
19. N. Bucalovic, V. Dolgovskiy, C. Schori, P. Thomann, G. Di Domenico, S. Schilt
Experimental Validation of a Simple Approximate Relation Between Laser Frequency Noise and Linewidth
Publications xxiii
20. N. Bucalovic, V. Dolgovskiy, C. Schori, P. Thomann, G. Di Domenico, S. Schilt
Experimental Validation of a Simple Approximate Relation Between Laser Frequency Noise and Linewidth
Annual Meeting of the Swiss Physical Society, Zurich, Switzerland, June 21-22, 2012, poster #282
21. V. Dolgovskiy, N. Bucalovic, S. Schilt, G. Di Domenico, P. Thoman, S. Grop, B. Dubois, V. Giordano, M. Stumpf, S. Pekarek, U. Keller, T. Südmeyer
Comparison of low-noise microwave generation from ultrafast fiber and DPSSL frequency combs
Europhoton, Stockholm, Sweden, August 26-31, 2012, oral # ThD.4
22. N. Bucalovic, V. Dolgovskiy, C. Schori, P. Thomann, G. Di Domenico, S. Schilt
Experimental Validation of a Simple Relation Between Laser Frequency Noise and Linewidth
Chapter 1
Introduction
Since 1967, the unit of time of the International System of units (the SI second) has been defined to be the duration of 9’192’631’770 periods of the radiation corresponding to the transition between the two hyperfine levels of the ground state of the isotope 133 of the cesium atom. The most accurate atomic clocks to date are cold cesium atom fountain clocks with a demonstrated relative uncertainty below
[ 15
10- 1]. In the last decade, novel optical clocks taking advantage of the much higher number of oscillations per unit time occurring at optical frequencies have al-ready surpassed the best cesium fountain clocks in term of relative stability, so that a re-definition of the SI second is being discussed in the time and frequency com-munity.
The seminal step to the realization of optical clocks was the demonstration of a self-referenced optical frequency comb by Th. Hänsch and J. Hall, honored by the Nobel Prize in Physics in 2005. This discovery has revolutionized the field of fre-quency metrology by enabling a direct and phase-coherent link to be established be-tween optical and microwave frequencies, allowing microwave-to-optical and opti-cal-to-microwave frequency transfers and comparisons to be performed in a single step. A second essential component of an optical clock is the reference optical oscil-lator, an ultra-stable laser with extremely narrow linewidth at the Hz level or even below that acts as a short-term flywheel oscillator before being locked to an atomic transition at longer term. A notable work in this field was published in 1999 by B. Young et al. [2], where a cavity stabilized laser with a fractional frequency sta-bility at the level of 3×10-16 at 1 s was first reported.
Apart from their application in optical atomic clocks, optical frequency combs
2 Chapter 1
and ultra-stable lasers have another important application in the generation of ul-tra-low noise microwave signals. Ulul-tra-low noise microwave references are of essen-tial importance in various applications such as high-precision radar systems and synchronization, and advanced very long baseline interferometry (VLBI). Until re-cently, the lowest phase noise microwave was achieved with cryogenically-cooled sapphire oscillator (CSOs) based on a high-Q whispering gallery mode in a sapphire cavity cooled down to cryogenic temperature. However, CSOs have some drawbacks related to their high cost of maintenance imposed by the liquid helium (LHe) cool-ing. A notable exception is the cryocooled sapphire oscillators developed at Femto-ST in Besançon, which do not require LHe-cooling and has even been made trans-portable [3].
The lowest phase noise microwave generation was demonstrated in 2011 using Ti:sapphire (Ti:Sa) optical frequency combs referenced to an ultra-stable laser [4]. In such a system, a frequency comb is phase-stabilized to an ultra-stable optical ref-erence in order to transfer the high relative frequency stability of the laser to a mi-crowave signal. In this scheme, the comb acts as a frequency divider that scales down the phase noise of the laser by a huge number corresponding to the ratio of the optical and microwave frequencies, leading to the very low phase noise of the generated microwave signal.
In this thesis, ultra-stable microwave generation has been developed and
charac-terized based on a 1.5-µm optical reference. This has required three main tasks to
be performed [4,5]:
i) Development and characterization of a reference optical oscillator;
ii) Full characterization of the noise properties of optical frequency combs used as a phase-coherent bridge between optical and microwave frequen-cies;
iii) Microwave generation using a frequency comb acting as an optical-to-microwave frequency divider and evaluation of the generated optical-to-microwave signal.
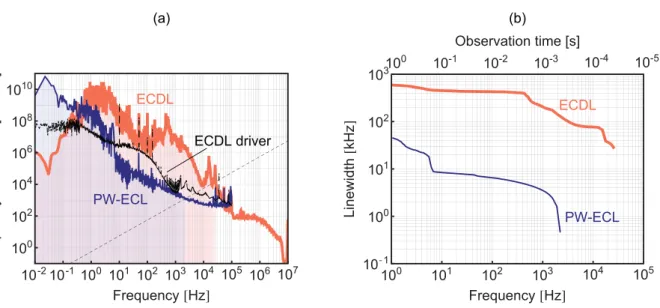
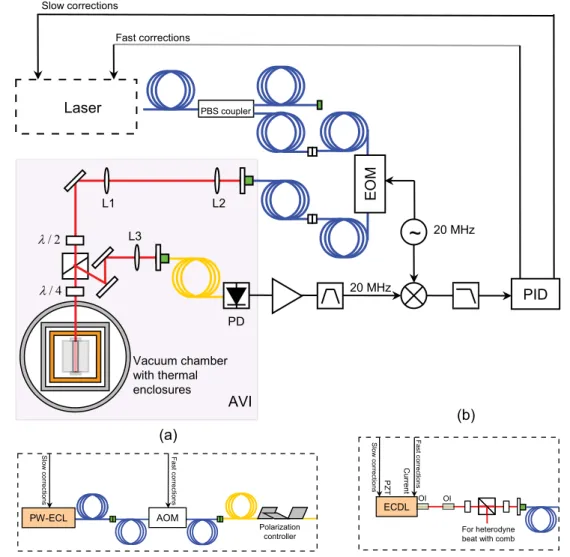
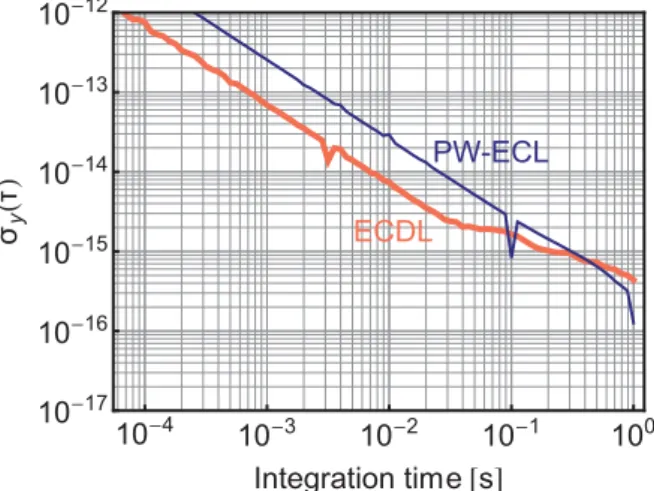
Two different laser technologies have been used and compared for the realiza-tion of the ultra-stable laser, i.e. an external cavity diode laser (ECDL) and a pla-nar-waveguide external cavity laser (PW-ECL). An ultra-low thermal expansion (ULE) high-finesse Fabry-Perot cavity was used as an ultra-stable optical frequency
Introduction 3
reference for the laser stabilization. A two-layer thermal enclosure has been de-signed, machined and implemented to thermally-isolate the cavity from external temperature fluctuations. A special emphasis was put on obtaining a high homoge-neity of the cavity temperature and a good insulation from external temperature variations, which was achieved by a measured thermal time constant of more than 6 days.
Two different frequency comb technologies have been characterized and studied with respect to their potential for low-noise microwave generation. A commercial Er:fiber comb, which has already been widely and successfully used in optical-to-microwave frequency division, was compared with a novel fully-stabilized optical frequency comb generated from a diode-pumped solid state laser (DPSSL) in the 1.5-µm spectral region. Despite their reliability and moderate cost in comparison to Ti:Sa combs, Er:fiber combs suffer from a few drawbacks such as a low-Q factor cavity and a limited gain bandwidth. In contrast to Er:fiber combs, DPSSL combs usually have a high-Q cavity and can emit a much higher optical power than Er:fiber combs, making possible coherent octave spanning supercontinuum genera-tion without the need for further amplificagenera-tion or pulse compression. Furthermore, they still exhibit the advantages of higher reliability and lower cost diode-pumping as compared to Ti:Sa combs. A passively modelocked Er:Yb:glass oscillator, referred to as ERGO and developed at ETH Zurich has been characterized in details with respect to its noise properties and has been compared to the Er:fiber comb. The ad-vantages of this novel comb technology in the 1.5-µm spectral range are demon-strated.
The full-stabilization of a frequency comb (to either a microwave or an optical reference) requires the two degrees of freedom of the comb to be stabilized. This is generally done using two actuators to apply a feedback signal to stabilize the comb repetition rate and the carrier-envelope offset (CEO). However, these two stabiliza-tion loops are not independent and some coupling may occur. The impact of these coupled servo loops has been studied in an Er:fiber comb, showing for the first time how a positive impact of the CEO frequency stabilization improves the noise of the repetition rate and of an optical comb mode. A theoretical model predicting the im-pact of this coupling has been also developed.
4 Chapter 1
generated by optical frequency division from the same developed ultra-stable optical reference using each comb technology. The evaluation and detection of the micro-wave signal was performed in collaboration with Femto-ST (Besançon), using the transportable ultra-low instability signal source (ULISS) developed by this group based on a cryogenically-cooled sapphire oscillator. Results of the microwave gen-eration have shown some beneficial use of the ERGO comb compared to the Er:fiber comb that will be discussed.
The thesis is organized as follows: Chapter 2 provides an overview of the char-acterization of oscillators in terms of frequency noise and stability, and presents ex-perimental tools used for the characterization of the noise properties of lasers and frequency combs. In Chapter 3 the ultra-stable laser is introduced, starting with the basics of laser stabilization to high-finesse cavities and given a further detailed characterization of the different elements composing the ultra-stable optical oscilla-tor. The reference cavity is characterized from the point of view of its spectral and thermal properties. A discussion of the fundamental limits is provided and the de-sign of a thermal enclosure for the cavity is reported. In Chapter 4, stabilization of an Er:fiber comb is studied, starting with the basics of frequency combs and provid-ing a detailed characterization of the stabilization of a commercial Er:fiber comb. A complementary theoretical model accounting for the correlated noise sources is pre-sented and verified experimentally for the description of the stabilized comb noise properties. The effect of the coupling between the stabilization loops in this fiber comb is shown experimentally and a prediction on the noise of an arbitrary comb line is given. A novel self-referenced DPSSL comb is described in Chapter 5, fol-lowed by its complete noise characterization. The microwave generation using the two types of frequency comb discussed in the previous chapters is described in Chapter 6, starting from referencing the comb to an optical oscillator and further microwave detection and evaluation. A brief description of the reference CSO used in the experiment is presented and the microwave signals generated from the Er:fiber and DPSSL combs are evaluated and compared in terms of fractional fre-quency stability and phase noise. A summary of the main results is given in Chapter 7.
Chapter 2
Noise in oscillators and
characteri-zation methods
2.1 Introduction
All along this thesis, one had to deal with the characterization of low-noise sig-nals, such as ultra-stable lasers, optical frequency combs and ultra-stable micro-wave. This chapter introduces some basic analytical tools and experimental meth-ods for the characterization of such signals, in terms of phase/frequency noise and fractional stability (Allan deviation).
Section 2.2 first reviews some basics of time and frequency.
A simple concept to determine the linewidth of a laser from its frequency noise spectrum was recently proposed by Laboratoire Temps-Fréquence (LTF) [6]. This concept provides a simple metric to determine which noise spectral components contribute to the laser linewidth and has thus been regularly used throughout this thesis. This simple approach is presented in Section 2.3.
Experimental methods to characterize the noise properties of such signals are also presented in this chapter. For this purpose, various frequency discriminators that have been extensively used in the experimental work of this thesis for the characterization of the frequency noise properties of lasers, frequency combs or ul-tra-stable microwave, are presented and characterized in Sections 2.4 and 2.5, re-spectively.
6 Chapter 2
2.2 Basics
2.2.1 Phase and frequency noise
The linewidth, defined as the full width at half maximum of the lineshape func-tion, is a commonly used parameter to describe the spectral properties of a laser. However, this parameter depends on the observation time and contains poor infor-mation about the spectral distribution of the laser noise. A more useful tool to measure the spectral purity of an oscillator is based on the direct recording of the phase time series and further Fourier transformation of this signal. In the case of a deterministic signal, the power spectral density (PSD) is defined as the square modulus of the Fourier transform. However in the case of a random process x(t), the formal definition of the PSD slightly differs and is written in the case of the one-sided PSD defined in the positive-frequency plane as:
( )t f ( ) 2 ( ) i x S w +¥R t e-wt -¥ =
ò
dt, (2.1) where{
}
( ) ( ) ( ) R t = E x t x t +t (2.2)is the autocorrelation function of the process x(t). denotes a mathematical expectation. The angular frequency w is used all along this thesis to represent the variable in the Fourier domain to be compatible with the notations used and ex-plained in
{ }
E
Chapter 4 (see Section 4.4).
In practice it is sometimes easier to estimate from the Wiener-Khinchin theorem for an ergodic stationary process with a power spectrum measured by av-eraging a multiple number of realizations:
( ) x S w 2 2 ( ) lim ( ) i t x T S x t T w w +¥ -¥ -¥ =
ò
e dt . (2.3)For instance, in a fast Fourier transform (FFT) spectrum analyzer the spectrum is inferred from a digitized time series and the measured PSD represents directly the amplitude noise PSD of the input signal in V2/Hz.
Measurement of the phase noise PSD requires the implementation of a phase discriminator, converting phase fluctuations into measurable amplitude fluctuations.
Noise in oscillators and characterization methods 7
The one-sided phase noise PSD of the phase fluctuations is referred to as , measured in rad2/Hz. Another quantity widely used by the engineers is the single-sideband (SSB) phase noise, defined as:
( )t f ( ) Sf w 1 ( ) 10 log ( ) 2Sf w = æçççè w ö÷÷÷÷ ø L , (2.4) and measured in dBc/Hz.
Frequency fluctuations of an oscillator are interrelated with its phase fluctua-tions as ( ) ( ) 2 t t f n p D D = . (2.5)
From this equation one can easily derive the frequency noise PSD, related to the phase noise PSD as
2 ( ) ( ) 2 Sdn w w Sf w p æ ö÷ ç =ççè ÷÷÷ø . (2.6)
2.2.2 Allan deviation
For the description of clocks and frequency standards in terms of stability, the fractional frequency fluctuations y t( )=
(
n( )t -n0)
n are usually considered, where 0 is the fluctuating clock frequency and is the nominal frequency of the oscil-lator. The stability of an oscillator is commonly measured with a frequency counter, where the reading of the counted oscillator frequency is averaged over a measure-ment time interval of duration t. Denoting the time averaging by an overbar, the average of the fractional frequency fluctuation at the k-th measurement interval can be written as ( )t n n0 ( 1) 1 ( ) ( ) k k k y ty t t t + =ò
t dt. (2.7)The Allan deviation is a conventional tool for the characterization of clocks and frequency standards. It is defined as a mathematical expectation of a two sample variance, which is replaced by a simple mean in practice, i.e.
8 Chapter 2
(
)
2 1 1 1 ( ) ( ) 1 ( ) 1 2 N k k y k y y N t t s t -+ = -= -å
. (2.8)The Allan deviation can be obtained from the frequency (or phase) noise PSD as: 4 2 2 0 0 ( ) sin ( /2) ( ) 2 2 ( /2) y Sn w wt d s t p n wt +¥ =
ò
w, (2.9)which shows that the Allan deviation filters the frequency noise PSD.
The inverse operation, however, is impossible as the information about the fre-quency noise is lost in the measured stability data.
2.3 A simple approximation for the linewidth of
a laser
It is possible to calculate the line profile from the frequency noise PSD contain-ing the complete information about the laser noise at different frequency compo-nents, while the reverse process is not possible. However, the analytical solution ex-ists only in the ideal case of a pure white frequency noise [7], which leads to the well-known Lorentzian lineshape described by the Schawlow-Townes-Henry linewidth [8,9]. The universal linewidth determination procedure derived by D. Elliott et al. [10] involves a two-step numerical integration procedure, where the autocorrelation function of the electric field is determined in the first integration step 0 2 2 2 0 2 0 sin ( /2) ( ) exp 2 ( ) ( /2 ) ( /2 ) i E E e S d pn t dn wt t w w p +¥ ì ü ï ï ï ï G = í- ý ï ï ï ï î
ò
w p þ dt , (2.10)and the PSD of the laser optical field is obtained in a second-step integration, 2 ( ) 2 i ( ) E E S n +¥e- pnt t -¥ =
ò
G . (2.11)This is a rather complicated procedure that requires to evaluate in Eq.
( ) E t G
(2.10) over an ensemble of correlation times t, determining the resolution (overall t range) and the Nyquist frequency of the calculated optical spectrum (t sampling rate).
Noise in oscillators and characterization methods 9
A simple approximation for the determination of the linewidth of a laser from the frequency noise PSD has been recently proposed by our group [6]. The concept of the b-separation line introduced in the frequency noise PSD in [6] allows identify-ing the spectral components that contribute to the linewidth (Figure 2.1):
i) The frequency noise PSD is separated into two regions by the b-separation line, defined as:
2 8 ln 2 ( ) ( /2 ) Sdn w w p = ⋅ Frequency [Hz] 104 104 102 100 108 1010 106 103 102 101 105 106 107 Frequency noise PSD [Hz 2/Hz] β-separation line
A
FWHM =√(8ln2)A p p ( ) ( ) ln 2/ 2) ( /2 )p , (2.12)with a significantly different influence on the profile of the optical line.
ii) Only the slow frequency modulation area, where ( /2 )w p contributes to the linewidth of the signal.
2 ( ) (8 ln 2/ )
Sdn w > p ⋅
iii) In the fast frequency modulation area, where S ( /2 ) the frequency fluctuations only contribute to the wings of the lineshape, but not to the linewidth itself.
2 ( ) (8 ln 2/ ) dn w < p ⋅ w
Figure 2.1: Graphical representation of the simple approximation proposed to determine the linewidth of a laser from its frequency noise PSD Sdn , calculated from the sur-face A of the slow modulation area. The shadowed areas on this schematized fre-quency noise spectrum represent the surface A that encloses all spectral components
for which S exceeds the b-separation line S .
w
( )w (8
dn w dn = p ⋅ w
Following this approach, the linewidth (full width at half maximum, FWHM) can be estimated from the area under the frequency noise PSD at low modulation frequencies, i.e. at those frequencies at which the frequency noise PSD exceeds the
10 Chapter 2
b-separation line:
8 ln 2
FWHM = A. (2.13)
The flicker noise (1/f noise) makes the linewidth strongly depend on the obser-vation time t0. Mathematically, the area is obtained by integrating the product be-tween the frequency noise PSD and the Heaviside step function ( if
and if ) from a low-frequency cutoff proportional to the in-verse of the observation time t0, introduced here to prevent the divergence of the in-tegral ( )x H H( )x = 0 0 x < H( )x =1 x ³1 0 2 2 / 8 ln 2 ( ) ( /2 ) ( ) ( /2 ) t A Sdn Sdn d p w p w p w w +¥ æ ö÷ ç = ççè - ÷÷÷ ø
ò
H p . (2.14)In absence of diverging low-frequency noise the integration down to zero fre-quency (infinite observation time) is possible.
2.4 RF discriminators
As it was mentioned in Section 2.1 the FWHM linewidth gives only an incom-plete characterization of an optical oscillator and does not allow assessing the phase noise frequency distribution. It is however possible to determine the white-frequency noise and the flicker noise from the respective Lorentzian and Gaussian contribu-tions to the Voigt line profile [11]. In order to assess the frequency noise of a laser it is required to convert frequency fluctuations into amplitude fluctuations, which is the role of a frequency discriminator.
Basically, frequency discriminators can be split into two categories: optical dis-criminators and radio-frequency (RF) disdis-criminators. Optical frequency discrimina-tors directly convert optical frequency fluctuations of a laser into intensity fluctua-tions that are detected by a photodetector. Optical discriminators are typically de-vices displaying a frequency-dependent transmission in a restricted frequency range, such as gas-filled cells near an atomic/molecular resonance (Doppler-broadened [12-14] or sub-Doppler [15]), Fabry-Perot resonators [16] or unbalanced two-beam inter-ferometers [17].
As it is not always possible to have a proper optical discriminator at the con-sidered laser wavelength, another approach consists in heterodyning the laser under test with a second laser, either similar to the first one or with a negligible frequency
Noise in oscillators and characterization methods 11
noise, and subsequently analyzing the generated RF beat signal. The frequency noise of the heterodyne beat can be analyzed in the frequency domain using a suit-able RF discriminator. In this section, different types of RF frequency discrimina-tors are presented and discussed in view of their extensive use for the characteriza-tion of lasers, frequency combs and ultra-stable microwave in the next chapters of this thesis.
A frequency discriminator is characterized by its sensitivity (or discrimination slope Dn in [V/Hz]), i.e. its ability to convert frequency fluctuations dn(t) of the in-put signal into variations of an outin-put voltage V(t). The discriminator slope is an important parameter: the higher D , the better the frequency noise conversion. The frequency noise PSD of the input signal ( in [Hz2/Hz], where is the Fourier frequency) is retrieved from the PSD of the output voltage ( in [V2/Hz]) taking into account the discriminator slope:
n ( ) Sdn w w p/2 V S ( )w 2 ( ) ( ) SV S D dn n w w = . (2.15)
2.4.1 Analog phase-locked loop discriminator
Following the work of L. Turner et al. [18], an analog phase lock loop (PLL) frequency discriminator was built and characterized in detail. The basic principle of this discriminator is to phase-lock a voltage-controlled oscillator (VCO) to the RF beat signal to be analyzed, using a high-bandwidth PLL. If the loop bandwidth is sufficient, the VCO follows any frequency fluctuations dn(t) of the input RF beat and the control voltage of the VCO V(t) reflects the frequency fluctuations of the input signal. Once the response of the VCO is known (in [Hz/V]), the analysis of the fluctuations of the control voltage can be directly converted into frequency fluc-tuations of the input RF beat (within the loop bandwidth). While L. Turner et al. used a single integrated circuit PLL for their frequency discriminator, the PLL dis-criminator presented here uses discrete off-the-shelf analog components (VCO, phase detector and servo controller). This approach offers a larger flexibility in the adjustment of the PLL parameters (gain, bandwidth), which enables the PLL char-acteristics to be optimized with respect to the properties of the signal under test (e.g. to achieve the largest bandwidth or the lowest noise floor). A scheme of the PLL discriminator is shown in Figure 2.2. The VCO (Mini-Circuits ZX95-209-S+)
12 Chapter 2
operates in the 199-210 MHz range, with a nominal tuning coefficient of 1.5 MHz/V. A double-balanced mixer (Mini-Circuits ZP-1LH) is used as a phase detector, followed by a 10-MHz low-pass filter to suppress high frequency compo-nents. Finally, the loop is closed with a high-speed servo controller (New-Focus LB1005-S) with a proportional-integral (PI) corner frequency adjustable from 10 Hz up to 1 MHz and a proportional gain between −40 dB and +40 dB.
Servo VCO Lock-in FFT Scope Input signal ν(t) = ν0 + δν(t) Output signal V(t) = V0 + δV(t)
Figure 2.2: Schematic representation of the analog PLL discriminator. The control voltage V(t) of the VCO constitutes the output signal that replicates the input frequency varia-tions dn(t). This signal is analyzed using an oscilloscope, a lock-in amplifier or an FFT spectrum analyzer.
2.4.2 Miteq RF discriminator
Simple plug-and-play RF discriminators are commercially available in different frequency ranges from various suppliers of RF components. The model FMDM 21.4/2-4 from Miteq as been used, which operates in the 18-26 MHz range, with a typical peak-to-peak bandwidth of 8 MHz and a linear bandwidth of 4 MHz as specified by the manufacturer. The operation of this discriminator is based on the use of an input limiting amplifier to drive two staggered tuned L-C circuits. Oppos-ing rectification of the circuits creates the discriminator “S” curve and a video am-plifier is finally utilized to provide adequate output slope. The ability to precisely align the skirts of the tuned circuits, which represents the discriminator linear bandwidth, is an advantage of this type of design. The nominal response of this dis-criminator is 1 V/MHz.
Noise in oscillators and characterization methods 13
2.4.3 Numerical phase-locked loop HF2PLL
discrimi-nator
The HF2LI from Zurich Instruments, Switzerland, is an all-numerical instru-ment consisting of a dual input digital lock-in amplifier extended with dual PLL capabilities. The lock-in amplifiers have a frequency bandwidth ranging from 1 µHz to 50 MHz (with a sampling rate of 210 Msamples/sec), a dynamic reserve of 120 dB and an input voltage noise of 5 nV Hz. The instrument is based on a Field-Programmable Gate Array (FPGA) which permits computations with large numerical precision and short processing time. Moreover, the lock-in shortest inte-gration time constant of 800 ns, lower by one order of magnitude than in other commercially-available lock-in amplifiers, makes it suitable for wide bandwidth de-modulation and as a phase detector for a PLL (referred to as HF2PLL) that re-places all the analog components in the dotted box in Figure 2.2 by their numerical counterparts.
The HF2PLL runs directly on the lock-in FPGA, ensuring a precise control of the PLL dynamics and resulting in a maximum −3 dB bandwidth of 60 kHz. The HF2PLL has similar functional blocks as the analogue PLL described in Section 2.4.1, with two notable differences:
i) The phase detector makes use of the lock-in demodulation chain (includ-ing its low-pass filters) since its purpose is to determine the phase differ-ence between input and referdiffer-ence signals. This phase differdiffer-ence is the lock-in output channel Theta, as calculated directly from the quadrature (Y) and in-phase (X) components of the demodulated signal. The advan-tage of this approach compared to the analog PLL is its high rejection of amplitude modulations of the input signal, thereby minimizing the ampli-tude noise sensitivity of the HF2PLLdiscriminator. Theta is the error sig-nal and constitutes the input of the following numerical proportiosig-nal- proportional-integral-derivative (PID) controller, as in the analog case.
ii) The VCO is replaced by a functionally equivalent numerical controlled oscillator (NCO), whose role is to keep track of the reference signal phase (from which the in-phase and quadrature reference signals are derived). The rate at which the NCO phase changes, which is the reference signal instantaneous frequency, is c , where f is a selectable PLL c center frequency and the frequency deviation dF (in Hz) is the PID
con-( )
14 Chapter 2
troller output. When the HF2PLL discriminator is used to characterize a heterodyne beat signal, dF is output as an analog signal with a software-selected gain (from 0.75 nV/Hz to 1.6 V/Hz).
In comparison with the analog PLL where all electronic components suffer from 1/f and white noise, the noise sources in the digital PLL are confined to the analog-to-digital converter at the lock-in input stage and to the analog dF output, since the numerical noise can be made arbitrarily small by increasing the internal nu-merical precision. On the other hand, the measurement bandwidth of analog PLLs is usually larger than their digital counterparts.
2.4.4 Digital phase detector DXD200
A digital phase detector (DXD200 module from MenloSystems, Germany) with a wide linear range of operation of 32×2p has been characterized for comparison with the other frequency discriminators. The basic element of this digital phase de-tector is a differential period counter, where the reference signal counts up and the RF beat signal counts down [19]. The counter has a range from 0 to 64 and is ini-tialized at 32. The phase error can track a 32×2p phase difference between the two signals. The counter signal is then fed into a digital to analog converter to gen-erate a signal proportional to the relative phase, with a nominal phase discrimina-tion factor Df = 3.3 V/(32×2p) = 0.016 [V/rad]. While this detector should pro-vide an ideal linear response in a phase range of 32×2p, this is not the case in re-ality due to the presence of several nonlinearities in its range of operation. This ef-fect was investigated over the entire range of operation of the phase detector by
comparing two signals with a slightly different frequency ( ,
with D in the range of 10-100 mHz), in order to slowly scan the out-put voltage (phase difference resulting from the accumulated phase shift between the two signals). Some of the nonlinearities are directly observable in the DC out-put voltage of the phase detector (see
1 ref 20 MHz
f = f =
2 1
f = f + D
Figure 2.3a). Next, a small frequency modu-lation (at a rate with a span of Df = 50 Hz) was applied to one of the 20-MHz carrier in order to measure the frequency response (in amplitude and phase) of the phase detector using a lock-in amplifier and to subsequently determine the detector sensitivity (in V/rad), as also described in Section
mod/2 10 kHz
w p =
2.5.1. In order to be able to resolve the narrow peaks that occur at some specific points in the detector response as a result of the nonlinearities, a small modulation index
Noise in oscillators and characterization methods 15
mod ( f/2)/( /2
b = D w p was used. In that case, the measured lock-in signal corre-)
sponds to the derivative of the phase detector response and the sensitivity was ob-tained by normalizing this signal by the modulation depth b. The outputs of the lock-in amplifier (X and Y components) were recorded with an acquisition card (National Instruments NI USB-6008), together with the phase detector operating DC voltage, during a phase sweep.
0 0.2 0.4 0.6 0.8 1 1.2 -3.2 -2.4 -1.6 -0.8 0 0.8 1.6 2.4 3.2 Se n s it iv it y [ V /r ad ] VDC [V] (b) -4 -3 -2 -1 0 1 2 3 4 -32 -24 -16 -8 0 8 16 24 32 -32 -24 -16 -8 0 8 16 24 32 Ou tp u t v o lt a g e [ V ] (a) (b) Phase/2π [rad] Phase/2π [rad] measured sensitivity specified sensitivity
Figure 2.3: Difference between the ideal (dashed line) and actual (light thick curve) response of the digital phase detector. (a) DC analog output voltage as a function of the phase difference between the two inputs; some nonlinearities are visible at the encircled points. (b) Highlight of the nonlinearities of the detector occurring roughly every 2p phase difference. This curve has been obtained by applying a frequency-modulated carrier at one input of the device and performing lock-in detection at the output to determine the discriminator sensitivity. The dashed line corresponds to the average slope of the DC curve (a).
The actual response displayed in Figure 2.3b is not as smooth as expected and shows the presence of many nonlinearities, regularly separated by a 2p phase differ-ence. At these points, the sensitivity of the detector for small signals can be locally
16 Chapter 2
enhanced by a factor up to 50 (0.8 V/rad). In order to have a proper discriminator of known sensitivity, the digital phase detector should be operated at a point where its response is constant, i.e., away from the nonlinear points. All the results shown in the following sections are obtained in such conditions. Finally, we should notice that the DXD200 acts as a phase discriminator, so that the corresponding frequency sensitivity is given by Dn( )w = Df/( /2 )w p .
2.5 Characterization of RF discriminators
2.5.1 Sensitivity and bandwidth
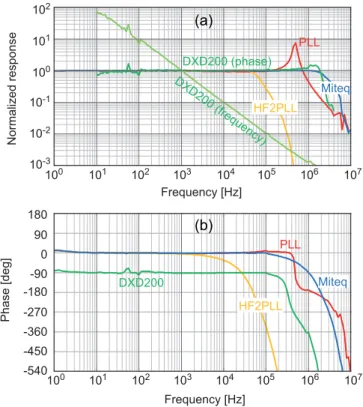
The sensitivity of each discriminator has been determined by applying a fre-quency-modulated input signal with a modulation amplitude (peak-to-peak) Df = 1 kHz (Df = 100 Hz in the case of the digital phase detector DXD200) at a varying modulation frequency wmod/2p using a calibrated, high-bandwidth reference VCO. A 207-MHz carrier frequency was used with the analog PLL discriminator and a 20-MHz carrier frequency with the other discriminators, obtained by mixing the 207-MHz VCO signal with a 227-MHz reference signal and subsequent low-pass filtering. The modulation frequency wmod/2p was scanned in the range from 0.1 Hz to 10 MHz and the demodulated output signal of the discriminators was measured in amplitude and phase using a lock-in amplifier referenced to wmod/2p (standard lock-in, model Stanford Research Systems SR830, up to 100 kHz and RF lock-in, model SR844, at higher frequency). Finally, the transfer function of each device was obtained by normalizing the lock-in output signal to the input frequency modula-tion amplitude Df. One defines here the bandwidth of a discriminator as the fre-quency range in which the discriminator sensitivity remains within ±10% (±0.9 dB) of its value at wmod/2p = 1 kHz. The sensitivities (or discriminator slopes, in V/Hz) reported here are generally given for the discriminator output connected to a high impedance load. The only exception concerns Miteq discriminator, used with a 93-W load as specified in the manufacturer’s datasheets.
The amplitude and phase of the transfer function of each discriminator are dis-played in Figure 2.4. The result for the analog PLL is shown for a maximum PI corner frequency of 1 MHz and a PI gain adjusted to optimize the PLL operation. The response of the analog PLL slightly depends on the PLL settings (gain and PI-corner): the low frequency sensitivity is unaffected by the PLL parameters, but at
Noise in oscillators and characterization methods 17
high frequency, the position and amplitude of the oscillation (servo bump) varies with these parameters.
100 101 102 103 104 105 106 107 Frequency [Hz] 100 101 102 103 104 105 106 107 Frequency [Hz] Phase [deg] 180 -180 90 0 -90 -540 -450 -360 -270 100 101 102 10-2 10-1 10-3 Normalized response HF2PLL (b) (a) Miteq Miteq DXD200 (frequency) PLL PLL DXD200 DXD200 (phase) HF2PLL
Figure 2.4: Amplitude (a) and phase (b) of the normalized transfer function of the different dis-criminators, measured by applying a frequency-modulated input carrier and per-forming lock-in detection of the discriminator demodulated signal. Each transfer function has been normalized by the discriminator sensitivity measured at 1 kHz
modulation frequency ( D for PLL, D for
Miteq, for HF2PLL, or
f for DXD200). The amplitude response of the digital phase
detector DXD200 is represented both in terms of response to frequency and phase modulation. 7 - -6 3 -7 10 [V/Hz] n = ⋅ /Hz] 1.25 10 [V/Hz] n = ⋅ 5 1.8 10 [V/Hz] Dn = ⋅ -10 [V Dn = 2 10- [V/rad] 1.8 D = ⋅
The analog PLL has a typical bandwidth of 200 kHz (defined at ±0.9 dB as mentioned before) with a discriminator slope of 0.7 V/MHz. The Miteq discrimina-tor has the largest bandwidth of 2 MHz with a discriminadiscrimina-tor slope of 1.25 V/MHz, obtained for 0 dBm input signal, but this sensitivity significantly depends on the signal amplitude (e.g., it is reduced to 0.86 V/MHz at −6 dBm input signal). The HF2PLL has a lower bandwidth of 50 kHz, but its sensitivity is much higher and can be adjusted by software in the range from 0.75 nV/Hz to 1.6 V/Hz. For the Miteq- and analog PLL discriminators, an instantaneous response to frequency
fluc-18 Chapter 2
tuations is obtained up to wmod/2p > 100 kHz, while a significant phase shift is in-troduced at higher frequencies. In the HF2PLL, the phase shift occurs at much lower frequency, which is compatible with the amplitude attenuation. The sensitiv-ity of the digital phase detector DXD200 decreases as as the module acts as a phase comparator. The measured phase discriminator is around 0.018 V/rad (0.016 V/rad expected from specifications, corresponding to
Df = 3.3 V/(32·2p)). The phase detector introduces a −90° phase shift at low Fourier frequency as it acts as a phase detector and we are assessing its response in terms of frequency. At Fourier frequencies higher than 100 kHz, a significantly lar-ger phase shift appears. The ±0.9 dB bandwidth of DXD200 is ~1 MHz.
1 mod (w /2 )p
-2.5.2 Frequency range
The total frequency range of each discriminator is defined here as the frequency interval in which the discriminator operates, and the linear frequency range as the frequency interval in which the response is within ±10% (±0.9 dB) of the nator sensitivity determined in Section 2.5.1. The frequency range of each discrimi-nator, measured at 1 kHz modulation frequency, is shown in Figure 2.5. Both the analog PLL and the Miteq discriminators have a wide linear frequency range of sev-eral megahertz (7 MHz for the analog PLL and 9 MHz for Miteq). For the numeri-cal PLL, the situation is different. The input carrier frequency can be anywhere in the range of ~1-49 MHz, but the amplitude of the maximum detectable frequency fluctuations around this carrier depends on the selected sensitivity of the demodula-tor output. As the analog output of the HF2LI instrument is limited to ±10 V, the maximum frequency fluctuation Dfmax which can be measured for a sensitivity Dn (in V/Hz) is . While a high sensitivity can be selected with the HF2PLL instrument, the drawback is a reduced frequency range.
max 10 V/
f n
D = D
Finally, the digital phase detector DXD200 can operate at any carrier frequency between 0.5 MHz and more than 200 MHz (provided that a reference signal at the same frequency is available), but the range of detectable fluctuations is limited to ±64p in terms of phase and is thus extremely narrow.
Noise in oscillators and characterization methods 19 f-f0 [MHz] 0.2 0.4 0.6 0.8 1 1.2 1.4 1.6 -8 -6 -4 -2 0 2 4 6 8 Norma liz e d sensitivity PLL Miteq HF2PLL (100 μV/Hz) HF2PLL (5 μV/Hz)
Figure 2.5: Normalized sensitivity of the frequency discriminators (measured for 1 kHz modula-tion frequency) as a funcmodula-tion of the carrier frequency detuning. The grey area indi-cates the linear frequency range Dflin of each discriminator, defined as the fre-quency interval for which the discriminator response differs by less than ±10% (±0.9 dB) from its nominal sensitivity. The frequency range of the HF2PLL is in-versely proportional to the software-selected sensitivity Dn ( flin 10 V/D
100
n)
and is shown here for two particular cases ( D µV/Hz and µV/Hz) for illustration. D = 5 Dn = n =
2.5.3 Noise floor
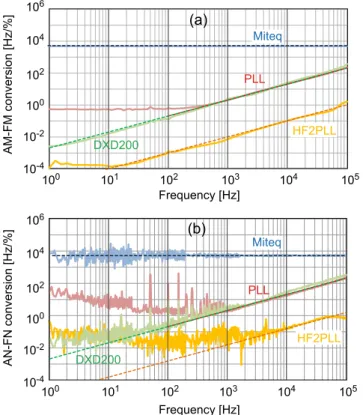
A relevant characteristic of a frequency discriminator is its noise floor, which represents the smallest detectable frequency fluctuations with a signal-to-noise ratio of one. The noise floor of the different discriminators was measured with an FFT spectrum analyzer for Fourier frequencies up to 100 kHz and with an electrical spectrum analyzer at higher frequencies, when a stable, low-noise carrier was ap-plied to the input. As previously, a 207-MHz carrier was used with the analog PLL discriminator and a 20-MHz carrier frequency with the other discriminators. The PSD of the discriminators output voltage has been converted into frequency noise PSD using the corresponding sensitivities previously determined. Results are shown in Figure 2.6.
The noise floor of the analog PLL-discriminator significantly depends on the amplitude of the input signal and on the gain settings of the PI controller. It is pre-sented here for a PI gain adjusted to optimize the noise floor. Operation at too-high gain may increase the noise floor by one or two orders of magnitude at Fourier fre-quencies above 10 Hz. In the range 100 Hz – 10 kHz, a white frequency noise floor is observed (~10 Hz2/Hz). Out of this range, the noise floor scales as ( / at low frequency, resulting from the VCO white frequency noise that is multiplied by
3
- 2
2 )
-20 Chapter 2 Frequency [Hz] Frequency noise PSD [Hz 2/Hz] PLL HF2PLL (100 μV/Hz) HF2PLL (10 mV/Hz) DXD200 Miteq 10-1 100 101 102 103 104 105 106 10-8 10-10 10-6 10-4 10-2 100 102 104 106 2 ( /2 )w p -5
due to the Leeson effect [20] and linearly with w/2p at high frequency, re-sulting from the PLL servo bump.
Figure 2.6: Noise floor of the different discriminators. The noise floor of the analog PLL de-pends on the PI gain and is presented here in an optimized configuration. The white frequency noise of the HF2PLL (at low frequency) results from white noise at the analog output and thus scales as 1/Dn2 for sensitivities up to Dn = 10 mV/Hz. It is
displayed here for two cases, Dn = 100 µV/Hz and Dn = 10 mV/Hz. The dashed
lines represent an approximation of the noise floor of each discriminator in terms of a power series of w p/2 , i.e. ( /w p2 )-2, ( /w p2 )-1, ( /w p2 )0, ( /w p2 )1, ( /w p2 )2.
The noise floor of the Miteq discriminator is white frequency noise (~0.1 Hz2/Hz) at frequencies w/2p > 100 Hz and increases as ( / at lower fre-quency. The digital phase detector DXD200 has a typical ( / phase noise floor, which translates into a small frequency noise floor at low Fourier frequency (<10 Hz2/Hz at 10 Hz). The frequency noise floor increases with w/2p with a slope slightly larger than unity in a log-log plot (the experimentally observed de-pendence is ( / with a ~ 1.3), and surpasses the noise floor of the two prior frequency discriminators at Fourier frequencies over 1 kHz (compared to the analog PLL discriminator) or 30 kHz (compared to Miteq). The noise floor of the HF2PLL has two contributions, white frequency noise at low Fourier frequency and white phase noise at high frequency. The white frequency noise floor results from white noise in the analog port that outputs the frequency deviation dF. When converted
1 2 ) w p -1 2 ) w p -2 ) a w p