HAL Id: hal-00304924
https://hal.archives-ouvertes.fr/hal-00304924
Submitted on 1 Jan 2003HAL is a multi-disciplinary open access archive for the deposit and dissemination of sci-entific research documents, whether they are pub-lished or not. The documents may come from teaching and research institutions in France or abroad, or from public or private research centers.
L’archive ouverte pluridisciplinaire HAL, est destinée au dépôt et à la diffusion de documents scientifiques de niveau recherche, publiés ou non, émanant des établissements d’enseignement et de recherche français ou étrangers, des laboratoires publics ou privés.
exploring patterns and fluxes using the Environment
Agency data archives
H. P. Jarvie, C. Neal, P. J. A. Withers, A. Robinson, N. Salter
To cite this version:
H. P. Jarvie, C. Neal, P. J. A. Withers, A. Robinson, N. Salter. Nutrient water quality of the Wye catchment, UK: exploring patterns and fluxes using the Environment Agency data archives. Hydrology and Earth System Sciences Discussions, European Geosciences Union, 2003, 7 (5), pp.722-743. �hal-00304924�
Nutrient water quality of the Wye catchment, UK: exploring
patterns and fluxes using the Environment Agency data archives
Helen P. Jarvie
1, Colin Neal
1, Paul J.A. Withers
2, Andrew Robinson
3and Nicola Salter
31Centre for Ecology and Hydrology, Wallingford, Oxfordshire, OX10 8BB, UK 2ADAS, Sunnyhill House, 1 Thistlebarrow Road, Salisbury, Hampshire SP1 3RU, UK
3Environment Agency Wales, Rivers House, St Mellons Business Park, St Mellons, Cardiff, CF3 0EY, UK
Email for corresponding author: [email protected]
Abstract
Water quality data, collected by the Environment Agency in England and Wales over 10 years (1991 2000) were used to examine the spatial distribution of nutrient pollution risk and for assessing broad-scale spatial and temporal variability in nutrient fluxes across the Wye catchment. Nutrient water quality across the upper and middle Wye catchment, and along the main River Wye, is generally very good. However, the main areas of concern lie in the small tributaries in the south and east of the catchment, which have lower dilution capacity and high agricultural and effluent inputs, and where mean Total Reactive Phosphorus (TRP) in some cases exceed 1mg-P l-1. Indeed, mass load calculations have demonstrated that the lowland south and east portion of the catchment contributes more than 85% of the whole-catchment TRP and more than 78% of nitrate (NO3) loads. Ratios of NO3:Ca concentrations were used to fingerprint different water-types across the catchment, linked to weathering and agricultural activity. The Wye catchment has been subject to two major sets of perturbations during the study period: (i) climatic fluctuations, with a drought during 1995-6, followed by a subsequent drought-break in 1997/8, and extreme high river flows in the autumn/winter of 2000/2001, and (ii) introduction of tertiary P-treatment at major sewage treatment works in the catchment. The implications of these perturbations for the nutrient water quality of the Wye catchment are discussed. Recommendations are made for more targeted monitoring to directly assess diffuse source nutrient contributions.
Keywords: nutrients, phosphate, phosphorus, nitrate, nitrogen, river, Wye, PSYCHIC, flux
Introduction
This paper summarises and analyses a wealth of water quality data collected by the Environment Agency (EA), to assess large-scale nutrient functioning across the Wye catchment, a large (4136 km2) and highly heterogeneous catchment on the border between Wales and England (Fig. 1). This work forms a basis for more detailed and focused water quality monitoring and modelling on the Wye as part of the Phosphorus and Sediment Yield CHaracterization In
Catchments (PSYCHIC) research programme. The Wye
catchment spans a wide range of riverine environments from base-poor upland streams to silty lowland rivers, with diverse geology, land use and hydrological conditions. The River Wye is a river of high ecological status: there are 246 Sites of Special Scientific Interest in the Wye catchment and the River Wye and some of its tributaries now form a
candidate Special Area of Conservation (cSAC) under the European Unions Habitats Directive (Council of European Communities, 1992). Much of the lower Wye Valley is an Area of Outstanding Natural Beauty. The Wye supports a diverse fish fauna, many species of which are cited as features in the cSAC designation. Of these, perhaps the most important in terms of conservation and socio-economic status, is the atlantic salmon (Salmo salar). The Wye is well known as a historically important salmon fishery although catches have declined in recent years and the proportion of much sought-after large spring fish has also reduced.
Most of the water quality research within the Wye catchment to date has focused on the uppermost headwaters draining the Plynlimon Hills. These headwaters have been a major centre for experimental catchment research since the early 1970s (Neal and McCulloch, 1997). During the
Fig. 1a. Map of the Wye catchment showing rivers, brooks and major settlements
Fig. 1b. Map of the Wye catchment showing Environment Agency flow gauging stations
late 1970s and early 1980s, mass-balance and timeseries modelling of water quality was also undertaken across the wider Wye catchment (Oborne, 1981, Oborne et al., 1980), together with assessment of nutrient sources within two of the lowland subcatchments, the Frome and Trothy (Houston and Brooker, 1981). Edwards and Brooker (1982) examined longitudinal and temporal variations in water quality along the River Wye and the Elan Valley reservoirs.
This study takes the understanding of the Wye catchment further, by providing the first basin-scale assessment of the
nutrient water quality of the Wye. The study utilises the extensive water quality data collected by the EA, which allows better spatial resolution of nutrient pollution risk (for more than 1200 river and effluent monitoring sites) and temporal coverage in chemical concentrations (over a 10-year period), than previously available. This complements the more localised site-specific studies described above. The work focuses on the diverse water chemistry of the River Wye and its tributaries and describes the spatial and temporal variability in nutrient fluxes. This is needed to understand
1 0 0 1 0 2 0 K i l o m e t e r s N E W S Llandwrtyd Wells Rhayader Llandrindod Wells Builth Wells Hereford Leominster Monmouth R . W ye R . W ye R . Wy e R. Lug g R . L ug g R. A rrow R. I thon R. Ir fon R. Ly nfi R. Fro me R . M on no w Hay-on-Wye R . E lan R . H on nd u R . D o re R. T rothy Rudhill Brook How Caple Brook
Gamber Brook Garren Brook Worm Brook Yazor Brook Wriggle Brook R . W ye # # # # # # # # # # # # # # # # # # # # # ### # # # # # # # # # # # # # # # # Wye at Redbrook
Rudhill Brook at Sandford Bridge Wye at Belmont
Lugg at Lugwardine Frome at Yarkill Frome at Bishops Frome Lugg at Butts Bridge
Lugg at Byton Arrow at Titley Mill Wye at Ddol Farm
Wye at Cefyn Brwyn
Elan at Elan Village
Ithon at Disserth
Irfon at Cilmery Wye at Erwood
Llynfi at Three Cocks Yazor Brook at Three Elms
the nutrient functioning in one of the UKs most important rural and agricultural rivers of high conservation value and to examine the rural/agricultural water quality endmember types for comparison with UK urban and industrially impacted river systems (e.g. the Humber Rivers; Jarvie et
al., 1998, 2002a) and relatively clean rural rivers (e.g. the
Scottish River Dee; Langan et al., 1997; Smart et al., 1998), in relation to environmental management and research priorities at the regional and national level.
Study area
The River Wye rises on the Plynlimon mountains (741 A.O.D.) and flows approximately 215 km in a broadly south-east direction to the Severn Estuary. The geology of the catchment comprises rocks of Palaeozoic to Mesozoic age, which are overlain by glacial and alluvial drift (Fig. 2). The upland north-west of the catchment is composed of outcrops of Ordovician and Silurian sandstones, shales, grits and mudstones. The lowland catchment, south east of Hay-on-Wye is underlain by Old Red Sandstone, comprising readily-weathered marls of the Herefordshire lowlands and the more resistant sandstones of the Black Mountains. There is a marked contrast in precipitation across the catchment, with a mean annual rainfall of 2450 mm (19511995) at Cefyn Brwyn in the upland north-west, compared with 717mm (19711995) at Yarkhill in the lowland east of the catchment (Institute of Hydrology, 1998). The high precipitation inputs to the upland catchment and low groundwater inputs mean that the river regimes in the west tend to be flashier, whereas, in the eastern lowlands, there is more substantial groundwater supply, resulting in the lowland tributaries
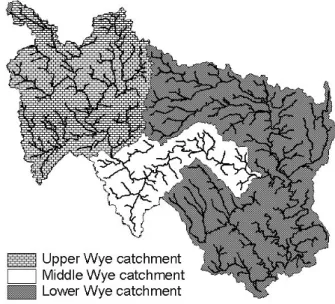
Fig. 2. Geology map of the Wye catchment Fig. 1c Map of the upper, middle and lower Wye catchment
Silurian: Tarranon and Llandovery beds Upper Ordovician
Silurian : Wenlock beds Silurian : Ludlow beds Lower Old Red Sandstone (Marl) Lower Old Red Sandstone (sandstone) Carboniferous Limestone
exhibiting less variable flow regimes. The Elan Valley reservoir system reduces downstream flood levels in the Rivers Elan and Wye, but is also used to compensate low flows and support river abstractions for public supply in the lower Wye catchment.
Land use in the Wye catchment is dominated by agriculture and the type of agriculture varies considerably, largely according to topography. Sheep farming is the main agricultural activity in grassland and moorland of the upland west of the catchment, whereas in the lowland eastern part of the catchment, arable and dairy farming predominate, with fruit, potato and hop production. The population of the catchment is approximately 240 000, centred on the main towns of Monmouth, Hereford, Ross-on-Wye, Hay-on-Wye, Leominster, Builth Wells and Rhayader (Fig. 1a). There are significant increases in population during the summer months through tourism. The Wye catchment is largely rural, with only a very small amount of heavy industry confined to Hereford (non-ferrous metal processing and natural gas fired power production). Other industrial activities are generally low level and include quarrying and timber production (concentrated in and around Builth Wells, Rhayader, Hereford and Leominster), and food processing concentrated around Hereford.
In 1994, the lower River Wye (from Hereford to the tidal limit) and the River Lugg were designated Eutrophic Sensitive areas under the Urban Wastewater Treatment Directive (1992) (Council of the European Communities, 1991) (Defra, 2002). As a result of this, tertiary treatment to reduce phosphorus (P) discharges (P-stripping) was introduced at some of the larger sewage treatment works (STWs) in the lower Wye catchment during the latter part of the study period. P-stripping was installed at Hereford Rotherwas and Hereford Eign STWs in April 1998, at Leominster in December 1998 and at Ross on Wye in June 2000 (Environment Agency, 2001). P-stripping was also installed at Cadburys food processing factory on the lower Lugg in October 1999, although this discharge does not qualify under the UWWTD, as it serves a population of <4000 (Environment Agency, 2001). 62% of the rivers within the Wye catchment are designated as River Ecosystem (RE) Class 1 (very good quality), with a further 24% of river classed as RE 2 (good quality).
The Wye is a large and diverse catchment. To describe the water quality functioning across the catchment, the Wye has been divided into six main areas, corresponding with the upper, middle and lower reaches of the main River Wye and their contributing tributaries (Figure 1c):
1. The upper main River Wye to the Erwood gauging station. Erwood represents the transition from the upland
to lowland catchment, linked to the change from the Ordovician and Silurian strata to the Old Red Sandstone series. The upper catchment is sparsely populated and drains moorland and grassland, with sheep farming as the main land use.
2. The upper tributaries. The Rivers Elan, Ithon, Irfon all drain predominantly upland catchments, with low intensity grazing (mainly sheep farming).
3. The middle main River Wye from Erwood to Hereford. This is a transitional reach with major changes in land use from grassland to intensive arable production. 4. The middle tributaries. The major tributary draining into
the middle reaches of the Wye is the Lynfi in the west and there are numerous small tributaries draining increasingly intensive agricultural land from west to east, the most easterly being Yazor Brook.
5. The lower River Wye from Hereford to Redbrook. This is a large, meandering and slow flowing lowland river. 6. The lower tributaries. The major lower tributary is the River Lugg, which is joined by the River Arrow in its middle reaches and the River Frome just before its confluence with the Wye. The extreme upper reaches of the Lugg drain upland low-intensity grazing land, and then pass through areas of intensive arable production (with many small agricultural tributaries) as the river flows eastwards, and through the town of Leominster. The other major tributaries to the lower Wye are the Monnow and Trothy, which join the Wye at Monmouth. These two rivers drain the south-western portion of the catchment, with the upper western Monnow draining upland areas of the Black Mountains. The eastern upper Monnow catchment drains land of lower elevation with a high proportion of arable land use. The Trothy to the south of the Black mountains drains lower elevation grassland. Between the Lugg and Monnow, there are numerous small tributaries (including Wriggle Brook, Rudhill Brook and Garren Brook) entering the main River Wye, which receive inputs from arable land and sewage works.
Methods
DATA
Water quality data spanning 10 years (from 1991 to 2000) were supplied for the whole of the Wye catchment from the
EAs National Water Information Management System. The Wye data included measurements from 668 river monitoring sites, 97 trade effluent sites and 454 sewage effluent discharge points (Fig. 3). Not all of these river monitoring sites were sampled on a regular basis over the 10 years: some sites were monitored sporadically, in response to particular incidents, such as accidental discharges or fish kills. To remove any bias towards such events, data were only retrieved for sites where regular monitoring had been undertaken over the 10-year period, i.e. where typically more than 50 samples had been collected for a particular determinand of interest. Determinands chosen for analysis included phosphorus (P) fractions, nitrate (NO3), ammonia (NH3), pH, alkalinity and calcium (Ca2+).
For phosphorus, data analysis has concentrated on the Total Reactive Phosphorus (TRP) fraction, which is measured most widely across the catchments. This analysis is undertaken on unfiltered water samples by the standard Murphy and Riley (1962) colorimetric method. The TRP analysis is not a true measurement of orthophosphate ions (PO43) in solution, but is broadly a measure of the Soluble Reactive Phosphorus (SRP) plus easily hydrolysable particle-associated P fractions (Denison et al., 1998,
Haygarth and Sharpley, 2000). In addition to TRP, the EA also provide measurements of Total Phosphorus (TP) whereby an unfiltered sample is subject to digestion using sulphuric acid and potassium persulphate. The acid-persulphate digestion converts particulate, organic and condensed phosphorus into orthophosphate, which is then measured colorimetrically. The difference between the TP and TRP measurements provides a measure of the Total Unreactive Phosphorus (TUP) fraction, which represents the dissolved and particulate-bound condensed phosphates, polyphosphates and organic P which are hydrolysed by acid-persulphate digestion.
To understand, better, the fractions of P measured, the relationships between TP, TRP and suspended solids (SS) were examined for the full Wye dataset: over the 10 years of data collection across the Wye catchment, 65 517 samples were analysed for all three determinands. For the regression relationship between TP and TRP, r2 was 0.927 (99% significance; TP = 1.157 (± 0.003) * TRP + 0.0175 (± 0.001)). This is a very strong regression relationship, with a gradient greater than 1, demonstrating that the acid-persulphate digestion step is indeed hydrolysing a component of condensed phosphates, polyphosphate and
Fig. 3. Map of the location of Environment Agency water quality monitoring sites
# S # S # S # S # S # S # S#S#S # S #S # S # S # S # S # S # S # S # S # S # S # S # S#S # S # S#S # S # S # S #S # S # S # S # S # S # S # S # S # S # S #S # S#S # S # S#S # S # S # S # S#S # S # S#S#S#S # S # S # S # S#S # S#S # S#S # S # S # S # S # S # S #S #S # S #S # S # S # S # S # S # S # S # S # S#S # S # S#S#S # S # S # S # S # S # S # S # S #S # S # S # S#S#S#S # S#S#S#S # S # S#S # S#S # S # S # S # S#S # S # S # S #S #S # S # S # S # S # S#S #S # S#S #S # S # S # S # S # S # S # S # S # S # S # S # S # S # S#S # S#S # S # S # S # S # S # S # S # S # S # S # S#S # S # S # S # S # S # S # S # S # S#S # S # S#S#S#S#S#S # S # S # S # S # S#S#S#S # S # S #S #S # S # S # S # S # S # S # S#S # S # S # S # S # S#S#S # S#S # S # S # S # S # S #S # S#S # S # S # S # S # S # S # S # S # S # S # S # S # S # S # S # S # S # S # S # S # S # S # S#S # S # S # S # S # S # S # S # S # S # S # S # S # S # S # S # S # S#S # S # S # S # S # S # S # S # S # S#S#S # S # S # S # S # S # S # S # S # S # S # S # S # S # S # S # S#S # S # S # S # S # S#S #S#S # S # S # S # S # S#S # S #S # S # S # S # S # S # S # S # S # S # S # S # S#S #S # S # S # S # S # S # S # S #S#S #S#S # S # S # S # S # S # S # S # S # S # S # S # S # S # S # S # S # S # S # S # S # S # S # S # S#S # S # S # S # S # S # S # S # S # S # S # S # S # S # S # S # S # S # S # S # S # S # S # S # S # S # S # S # S # S # S # S # S # S #S # S # S # S # S # S # S # S # S # S # S#S # S # S # S # S # S # S # S # S # S # S # S # S # S # S # S # S # S #S # S # S#S # S # S # S # S # S # S # S # S # S#S # S # S # S # S # S # S # S # S # S#S # S # S # S # S # S # S # S # S # S # S # S # S # S # S # S #S #S#S # S # S # S # S # S # S # S # S # S # S # S # S # S#S#S#S # S # S # S # S # S # S # S # S # S # S # S # S # S#S # S # S # S # S #S # S # S # S # S # S # S # S # S # S # S # S # S # S # S # S # S #S#S # S # S # S # S # S # S # S # S # S # S # S # S # S # S#S#S # S # S #S#S # S # S # S # S # S # S # S # S # S # S #S # S # S # S # S # S #S # S # S # S # S # S # S # S # S#S # S # S # S # S # S # S # S # S # S # S # S # S # S # S # S # S # S # S # S #S #S # S # S # S # S # S # S # S # S # S # S #S # S#S # S # S # S # S # S # S # S # S # S # S # S # S # S # S # S # S # S # S # S # S # S #S # S # S # S # S # S # S # S # S # S # S # S #S # S # S # S # S #S # S # S # S # S # S # S # S # S # S #S #S # S # S # S # S # S # S # S # S $ $$ $ $$ $ $ $ $ $$ $ $ $ $ $ $ $$ $ $ $ $ $ $$ $ $ $ $ $ $ $ $ $ $ $ $ $ $ $ $ $ $ $ $ $ $ $ $ $ $ $ $ $ $ $ $ $ $ $ $ $ $ $ $ $ $ $ $ $ $ $ $ $ $ $ $ $ $ $ $ $ $ $ $ $ $ $ $ $ $ $ $ $ $ $ $ $ $ $ $ $ $ $ $ $ $ $ $ $ $ $ $ $ $ $ $ $ $ $$ $ $ $ $ $ $ $ $ $ $ $ $ $ $ $ $ $ $ $ $ $ $ $ $ $ $ $ $ $ $ $ $ $ $ $ $ $ $ $ $ $ $ $ $ $ $ $ $ $ $ $ $ $ $ $ $ $ $ $ $ $ $ $ $ $ $ $ $ $ $ $ $ $ $ $ $ $ $ $ $ $ $ $ $ $ $ $ $ $ $ $ $ $ $ $ $ $ $ $ $ $ $ $ $ $ $ $ $ $ $ $ $ $ $ $ $ $ $ $ $ $ $ $ $ $ $ $ $ $ $ $ $ $ $ $ $ $ $ $ $ $ $ $ $ $ $ $ $ $ $ $ $ $ $ $ $ $ $ $ $ $ $ $ $ $ $ $ $ $ $ $ $ $ $ $ $ $ $ $ $ $ $ $ $ $ $ $ $ $ $ $ $ $ $ $ $ $ $ $ $ $ $ $ $ $ $ $ $ $ $$ $ $ $ $ $ $ $ $ $ $ $ $ $ $ $ $ $ $ $ $ $ $ $ $ $ $ $ $ $ $ $ $ $ $ $ $ $ $ $ $ $ $ $ $ $ $ $ $ $ $ $ $ $ $ $ $ $ $ $ $ $ $ $ $ $ $ $ $ $ $ $ $ $ $ $ $ $ $ $ $ $ $ $ $ $ $ $ $ $ $ $ $ $ $ $ $ $ $ $ $ $ $ $ $ $ $ $ $
Environment Agency river water quality monitoring sites Environment Agency effluent quality monitoring sites
organic P. For the multiple regression of TP against TRP and SS, r2 was 0.930 (99% significance; TP = 1.151 (± 0.002) * TRP + 0.0001 (± 0) * SS + 0.0160 (± 0.0004)). The addition of the SS term to the regression equation does not produce a significant improvement in the regression relationship and the SS term is insignificant. This indicates that the additional P released by the acid-persulphate digestion is linked primarily to changes in TRP levels and not directly linked to changes in SS concentration. This might suggest that the acid-persulphate digestion is hydrolysing dissolved polymeric and organic forms of P, or a component of the adsorbed phase which is directly linked to the TRP component. There is no significant relationship between TRP and SS (r2=0.05), which suggests that the TRP fraction is essentially dissolved. Average TUP as a percentage of TP ranged from around 5% to 75%, with some of the highest values at low SS concentrations, indicating that the TUP is not linked to a high particulate component and thus is probably largely composed of dissolved organic and inorganic polymeric forms of P.
Alkalinity measurements are based on acidimetric titration. There are many definitions of alkalinity but, in this case, the methodology used, the high levels of alkalinity measured and the pH range encountered, mean that the values presented represent bicarbonate alkalinity. The alkalinity as presented in the EA database has units of mg-CaCO3 l1. Alkalinity is widely presented in micro-equivalent units (µEq l1). Conversion of alkalinity in µEq l-1 requires values in mg-CaCO
3 l1 to be multiplied by 20. Mean daily river flow data were supplied for each of the gauging stations within the catchment by the UK National River Flow Archive at Wallingford (Fig. 1b). River water quality spot samples at gauging stations were then matched with the mean daily flow data, to enable concentration-flow relationships to be examined and load estimates calculated. Data manipulation and analysis was undertaken using Splus statistical software (Insightful Corporation) and displayed within a Geographical Information System (GIS) package (ArcView, ESRI). Timeseries trends were examined by fitting a LOESS smoothing model to the data (Robson et al., 1996, Venables and Ripley, 1999).
LOAD CALCULATIONS
Given the intermittent nature of the EA water quality sampling (typically at monthly intervals), an interpolation technique was employed to estimate annual riverine loads of nutrients. A load estimation algorithm, based on the product of the flow-weighted mean concentration and the mean daily flow over the period of the record was deemed
most appropriate, as the estimates produced have relatively small bias and lower variance than other comparable estimators (Walling and Webb, 1985, Webb et al., 1997):
River load =Kr(
S
(Ci * Qi)/S
Qi) * (Qr) (1)where:
Ci is the instantaneous concentration in the river at the time
of sampling
Qi is the instantaneous river flow at the time of sampling Qr is the average long-term river flow record over the period
of record
Kr is a conversion factor to take account of the units and
period of record
n is the number of samples
Simple estimates were also made of the nutrient loads from sewage and industrial (trade) effluents. In the absence of a detailed flow record for effluent discharges, effluent loads were calculated as the product of the dry weather consented discharges and mean of the upper 75% of recorded effluent concentrations. The upper 75% of effluent concentrations are assumed to correspond with dry weather conditions, when effluent concentrations are higher owing to lower water throughput at the treatment works:
Effluent load = Ke (DWC * DWF) (2)
Where:
DWC is an estimate of the average dry weather effluent
concentration, based on the mean of the upper 75% of effluent concentrations;
DWF is the EA effluent consented dry weather flow; Ke is a conversion factor to take account of the units and
period of record.
Results
PATTERNS IN MEAN RIVER-WATER CHEMISTRY ACROSS THE WYE CATCHMENT
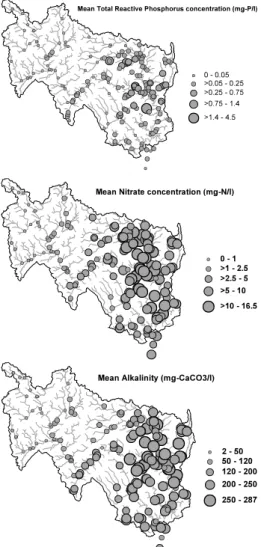
Three determinands have been chosen to demonstrate the major patterns in water quality across the Wye catchment: TRP, NO3 and alkalinity. Relationships between mean concentrations of these determinands and NH3, Ca and TP are then discussed. Maps of mean water quality across the Wye demonstrate a well-defined north-west/south-east split, largely corresponding to the transition from the upland to the lowland areas of the catchment (Fig. 4). The mean chemical concentrations are discussed in relation to the
n i=1
n i=1
upper, middle and lower River Wye reaches and their contributing tributaries, as shown in Fig. 1c.
Total Reactive Phosphorus (Fig. 4a) Upper Wye
Mean TRP concentrations are typically less than 0.01 mg-P l1 (i.e. close to detection limits) in the upper main river Wye (particularly upstream of the confluence with the Ithon) and also in the River Irfon and upper Ithon upstream of Llandridnod Wells, reflecting minimal inputs from a very low human population density (and thus minimal sewage effluent) and low intensity agriculture (sheep farming).
Middle Wye
Downstream of the Ithon confluence and along the middle reaches of the main River Wye, mean TRP concentrations remain below 0.03 mg-P l1 down to Hereford. However,
Fig. 4. Maps of mean water quality across the Wye catchment (1992
2001). (a) Total Reactive Phosphorus (mg-P l1); (b) Nitrate (mg-N
l1); (c) Alkalinity (mg-CaCO 3 l1)
higher mean TRP concentrations can be found in some of the tributaries draining into the middle Wye reflecting the more lowland topography and the influence of increasing P inputs from agriculture and sewage effluent: moving eastwards, TRP concentrations range from 0.04 to 0.20 mg-P l1 in the Lynfi subcatchment; 0.11 to 0.4 mg-P l1 in Coldstone Brook and 0.06 to 1.3 mg-P l1 in Yazor Brook.
Lower Wye
Immediately downstream of Hereford there are two major STW discharges and mean TRP concentrations in the main river Wye increase from <0.03 mg-P l1 upstream to 0.08 mg-P l1 downstream of Hereford Rotherwas and Hereford Eign STWs, but then decline to 0.05 immediately upstream of the confluence with the River Lugg, as a result of hydrological dilution and/or in-stream P uptake. Below the confluence with the River Lugg, mean TRP concentrations in the main River Wye remain between 0.06 and 0.07 mg-P l1 down to Redbrook. There is a wide range in mean TRP concentrations in the tributaries of the lower River Wye. The upper reaches of the Lugg have mean TRP concentrations below 0.05 mg-P l1, reflecting low intensity grassland and sparse population. However, moving downstream on the Lugg, mean TRP concentrations in the smaller tributaries reach a maximum of 1 mg-P l1. In contrast, mean concentrations on the main River Lugg do not exceed 0.20 mg-P l1 and mean TRP concentrations in the intensively cultivated River Frome subcatchment range from 0.08 to 0.6 mg-P l1). Highest mean TRP concentrations (4.4 mg-P l1) are found in the Wriggle Brook catchment downstream of Little Dewchurch STW, which joins the lower River Wye downstream of Hereford. Sampling sites in the western area of the Monnow subcatchment (including the River Honndhu), which drain mainly upland rural land, have mean TRP concentrations of less than 0.04 mg-P l1, whereas the lower River Dore in the east of the Monnow subcatchment receives inputs from lowland arable and dairy farming and a larger number of STWs, with mean TRP concentrations of up to 0.35 mg-P l1. TRP concentrations in the adjacent River Trothy, which drains a more homogeneous subcatchment (largely dairy farming), exhibit a lower range in mean TRP concentrations, from 0.06 to 0.15 mg-P l1.
Nitrate (Fig. 4b) Upper Wye
The upper main River Wye (above the confluence with the Ithon) and the Rivers Irfon and Elan exhibit the lowest mean NO3 concentrations in the catchment (all typically below 1 mg-N l1, Fig. 4b). The upper and lower Ithon, however,
have slightly higher average NO3 concentrations, ranging from 1.27 to 2 mg-N l1.
Middle Wye
Mean NO3 concentrations gradually increase along the middle main River Wye from 0.89 to 1.43 mg-N l1. Within the middle Wye, NO3 concentrations in the tributaries tend to increase eastwards: mean NO3 concentrations on the Lynfi in the west range from 0.85 to 2.7 mg-N l1, whereas in Yazor Brook in the east of the Middle Wye catchment, NO3 concentrations range from 10.4 to 11 mg-N l1.
Lower Wye
In the lower main River Wye, mean NO3 concentrations increase steadily from 1.6 mg-N l1 just downstream of Hereford to 3.3 mg-N l1 at Redbrook.
In the lower Wye tributaries, mean NO3 concentrations in the upper Lugg are typically <5 mg-N l1 and the concentration on the main River Lugg down to the confluence with the Wye do not exceed 6.5 mg-N l1. Highest mean NO3 concentrations in the Lugg subcatchment are found in the tributaries draining intensive arable land, and reach a maximum of 12.9 mg-N l1 in Wellington Brook. However, the highest mean NO3 concentration (16.4 mg-N l1) in the Wye catchment are found in the Gamber Brook, a tributary of the Garren, which enters the Lower Wye between Ross on Wye and Monmouth. Although NO3 concentrations are highest on the Gamber Brook, TRP concentrations are relatively low in this stream at 0.07 mg-P l1, suggesting different sources of NO
3 and TRP and/or different processes controlling in-stream concentrations. Like TRP, NO3 shows a westeast split in the Monnow subcatchment, with highest concentrations (reaching 11.4 mg-N l1 ) in the Worm Brook, a tributary of the River Dore in the East of the Monnow subcatchment, compared with average concentrations of less than 2 mg-N l1 in the western Rivers Monnow and Honddu. Again, similar to TRP, the Trothy exhibits a smaller range in mean NO3 concentrations compared with the adjacent Monnow subcatchment.
Alkalinity (Fig. 4c)
Like TRP and NO3, alkalinity shows a well defined NW SE split in concentrations although, unlike TRP, where the gradation is linked to a combination of agricultural intensity and population, and NO3 which is primarily linked to agricultural intensity, alkalinity is controlled mainly by geology, weathering rates and groundwater inputs, which provide a source of base cations (Neal et al, 1998b, Thornton and Dise, 1998). The lowest mean alkalinities are in the upper and middle River Wye to Hereford, and the Elan and
Irfon tributaries of the upper Wye, where alkalinities are typically less than 50 mg-CaCO3 l1. Alkalinities are higher on the Ithon reflecting drainage from the calcareous Wenlock Beds (Edwards and Brooker, 1982). The Ithon, the Upper Lugg catchment and the main lower River Lugg and the main lower River Wye all have concentrations of between 50 and 100 mg-CaCO3 l1. The highest concentrations of between around 100 and 250 mg-CaCO3 l1 are found in the small agricultural tributaries of the main middle and lower Wye, the middle and lower Lugg, the Frome, Monnow and Trothy. These are all small groundwater-fed tributaries located within the lower Old Red Sandstone series on both Marl and Sandstone lithologies. The highest mean alkalinity of 287 mg-CaCO3 l1was found on the upper How Caple Brook just below the Frome subcatchment, in the extreme east, draining an outcrop of Silurian Limestone.
INTER-DETERMINAND RELATIONSHIPS IN MEAN CHEMISTRY ACROSS THE WYE CATCHMENT
Figure 5 shows the relationships between mean TRP, TP, NO3, ammonia, calcium and alkalinity for each site in a matrix scatter plot. The relationship between mean site TP and TRP is strongly linear (r2 = 0.622 n=173; TP= 1.35 (± 0.013) * TRP + 0.074 (± 0.023) and the positive gradient greater than 1 and the small, but significant, positive intercept demonstrates that the acid-persulphate digestion method for TP analysis is hydrolysing a small but significant inorganic polymeric and/or adsorbed P fraction. Both TRP and TP demonstrate positive, but highly scattered, relationships with NO3 and ammonia as well as with alkalinity and calcium, indicating the broad increases in concentrations of all determinands from the upland to the lowland areas of the Wye catchment. However, the high data scatter indicates that there are a large number of factors controlling the distribution of these determinands across the catchment
For certain inter-determinand relationships there is some structure to the relationships. For example, the CaAlkalinity relationship shows a well-defined split into two separate linear relationships above c. 75 mg-Ca l1. Closer examination of the location of the sites making up the two arms of this split (Fig. 6) demonstrates that the sites with high Ca:Alkalinity are located within the more readily-weathered Marl of the Old Red Sandstone, whereas the sites with lower Ca:Alkalinity are located on the Sandstone lithologies of the Old Red Sandstone series (Fig. 2).
The NO3 to Ca relationship shows a more complex structure, with six separate river-water types identified (Fig. 7). Types I to IV form elements along a linear relationship continuum between NO3 and Ca, whereas Type
Fig. 5. Inter-determinand relationships for mean chemical concentrations at river monitoring sites across the Wye catchment
(units: Total Reactive Phosphorus (TRP), mg-P l1; Total Phosphorus (TP), mg-P l1; Nitrate (NO
3-), mg-N l1; Ammonia (NH3), mg-N l1;
Calcium (Ca2+), mg-Ca l1; Alkalinity, mg-CaCO 3 l1)
V lies below this linear continuum, with a lower NO3:Ca ratios, and Type VI lies above the linear continuum, with higher NO3:Ca ratios. Based on these separations, a typology of six river-water types has been identified: Type I: very low Ca (<10mg l1) and NO
3 (<1 mg-N l1), concentrations, found in the upper Wye and Rivers Elan and Irfon.
Type II: low Ca (1040 mg l1) and NO
3 (14 mg-N l1), lying along the same linear relationship as Type I. Type II sites are found in the River Ithon and upper River Arrow tributaries and along the main river Wye from Rhyader all the way down to the lowest gauging station at Redbrook. The persistence of such low Ca and NO3 concentrations along the full length of the River Wye, despite an extensive lowland reach receiving high concentration inputs from lowland tributaries, demonstrates the dilution capacity of the large hydrological contribution from the upland base- and nutrient-poor catchment.
Type III: medium Ca (4090 mg l1) and NO
3 (28 mg-N l1), lying along the same linear relationship as Types I and II. Type III sites are found in the main River Lugg and River Arrow, and various other tributaries of the middle and lower Wye.
Fig. 6. Examination of the split in the relationship between Ca and
alkalinity and location of sampling sites with high and low Ca:Alkalinity ratios TRP 0.0 0.4 0.8 0.0 0.4 0.8 0 100 200 300 0.0 0.5 1.0 0.0 0.4 0.8 TP NO3 -0 5 10 15 0.0 0.4 0.8 NH3 Ca2+ 0 50 100 0.0 0.5 1.0 0 100 200 300 0 5 10 15 0 50 100 Alkalinity # S # S # S#S # S # S # S # S # S # S # S # S # S#S # S#S # S#S#S # S # S # S#S#S#S # S # S#S # S # S#S#S # S # S # S # S # S # S#S # S # S # S # S #S # S # S $$ $$ $$ $ $ $ $ $ $ $ $ $$ $ $ $ $ $ $ $ $ $ $ $ $ $ $ $ $ $ # S Higher Ca:Alkalinity $ Lower Ca:Alkalinity 0 50 100 150 200 250 300 Alkalinity (mg-CaCO3/l) 30 80 130 Calc ium ( m g/l)
Type IV: high Ca (>90mg l1) and NO
3 (714 mg-N l1), lying along on the same linear relationship as Types I, II, III and IV. Type IV sites are located in the small tributaries draining predominantly arable land (the eastern middle Wye tributaries and the lower Wye tributaries).
Type V: lower NO3:Ca ratios. This grouping of sites lies below the line defined by Types I to IV. These sites are located predominantly in the south-western area of the Wye catchment, the Irfon, western Monnow and Trothy subcatchments, which lie within the Old Red Sandstone, but which drain lower intensity grassland. Two further sites are located in the eastern lower Wye tributaries, How Caple Brook and Pentaloe Brook, which drain deciduous woodland.
Type VI: higher NO3:Ca ratios. These sites are located in some of the most intensively farmed small
subcatchments in the lowlands: the Garren, Gamber and Rudhill Brooks, which drain directly into the upper Wye, upper Worm Brook in the eastern Monnow catchment, Curl Brook, which drains into the River Arrow and Pinsley Brook which drains into the River Lugg. This simple typological classification of river water quality demonstrates that water chemistry fingerprints can provide useful information for assessing differences in land use and geology across the catchment. Such typological classifications are used in many recent hydrological and hydrochemical models (e.g. Ewen, 1997, Cooper, 2000, Wade et al., 2001)
AVERAGE EFFLUENT CHEMISTRY ACROSS THE WYE CATCHMENT
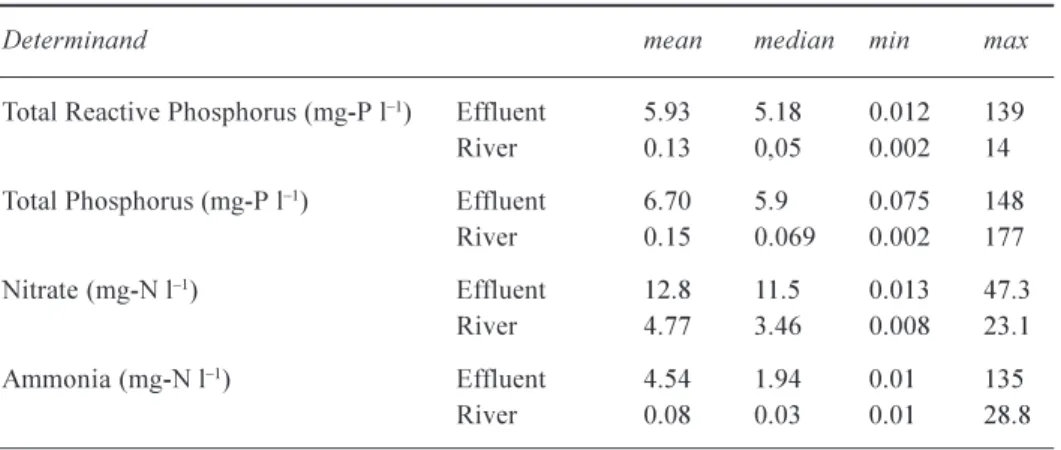
The average concentrations for effluents discharging into the Wye and its tributaries are considerably higher than the average concentrations at riverine monitoring sites; effluents typically show a higher degree of spatial variability in mean concentrations, (Table 1). Unlike riverine mean concentrations, effluent mean concentrations do not show comparable or consistent spatial patterns across the catchment linked to land use, geology or population. Indeed, the quality of effluent varies according to the nature of the discharge and the differences in quality of trade effluents (from various industrial sectors from food to timber production) and sewage effluents. The size of sewage treatment works is also significant: for example, economies of scale are such that it is generally more economically viable to install tertiary treatment processes (such as nutrient reduction) in the larger STWs serving urban populations. Therefore the larger urban STWs tend to have a higher level of effluent treatment and thus lower nutrient concentrations in discharged effluent than the small rural works (for example, average TRP concentrations for the STWs serving the city of Hereford (Rotherwas (120 000 p.e.) and Eign (60 000 p.e) STWs) are 1.02 and 1.19 mg-P l1 respectively, whereas Cleehonger STW (draining 1200 p.e.) has an average TRP concentration of 11.4 mg-P l1). The impact of these effluent discharges will be determined by the overall nutrient loading (the product of effluent concentration and flow) in relation to the flow and thus dilution capacity within the receiving river water. Therefore, reliance on spatial patterns in effluent concentrations alone can be misleading.
TEMPORAL AND FLOW-RELATED VARIATIONS IN RIVER WATER CHEMISTRY
While mean nutrient chemistry can provide valuable information on the spatial variability across the catchment Fig. 7. Typology of river monitoring sites across the Wye catchment
based on the relationship between nitrate and calcium concentrations 5 30 55 80 105 130 Ca (mg/l) 3 8 13 NO 3 (m g-N/l) Type I Type II Type III Type IV Type V Type VI $ T TypeVI $ TypeV N TypeIV Ñ#S TypeIIITypeII # TypeI $ T $ T $ T $ T $ T $ T $ T $ T $ T $T $ T$T $T$$$ $ $ $ $ $ $ $ $ $ $ $ $ $ $ $ $ $ $ $ $ $ $$ $ $ $ $$ $ $$ N NN N N N N N N N N N N N NNN N N N NNNN N N NN N N N N N N N N N N N NN N NN Ñ Ñ Ñ Ñ Ñ Ñ Ñ Ñ Ñ Ñ Ñ Ñ ÑÑ Ñ ÑÑÑÑ ÑÑ Ñ Ñ Ñ ÑÑ Ñ Ñ Ñ Ñ Ñ # S # S # S # S # S # S # S # S # S #S #S # S #S # S #S #S # S # S #S # S # S # S # S #S # S #S # S # S # S # S # S #S # S #S # S # S # S #S # S #S #S # S # S #S # S # # # # # # # # # # # # # # # # # # # # # # # # # # # #
Table 1. Mean, median and ranges in concentration of Total Reactive Phosphorus, Total Phosphorus,
Nitrate and Ammonia in river water and effluent for the Wye catchment.
Determinand mean median min max
Total Reactive Phosphorus (mg-P l1) Effluent 5.93 5.18 0.012 139 River 0.13 0,05 0.002 14 Total Phosphorus (mg-P l1) Effluent 6.70 5.9 0.075 148
River 0.15 0.069 0.002 177 Nitrate (mg-N l1) Effluent 12.8 11.5 0.013 47.3
River 4.77 3.46 0.008 23.1 Ammonia (mg-N l1) Effluent 4.54 1.94 0.01 135
River 0.08 0.03 0.01 28.8
for identification of hotspots in concentration and classification of river-water quality types, examination of temporal variability provides greater resolution of the dynamic behaviour of water quality across the catchment. EA routine river-water monitoring programmes are undertaken typically at monthly intervals, so the data cannot provide detailed information about short-term responses to individual storm events. However, timeseries of EA data do provide some valuable information about longer-term variability in water quality at seasonal and annual timescales. These data can also be used to examine relationships between concentrations and flow, although coverage of high flows tends to be relatively sparse and the detailed flow records are restricted to 18 gauging sites across the catchment (Fig. 1b).
Timeseries of river-water nutrient concentrations
Timeseries of TRP, NO3 and alkalinity were examined for all of the sites and selected sites were chosen to illustrate the main features of temporal variability in concentrations across the catchment (Fig. 8). A LOESS model was fitted to the data to examine trends over the 10-year period.
Total Reactive Phosphorus
At most sites there was evidence of seasonal variability in TRP concentrations, with highest concentrations in summer, linked to lower flows and lower effluent dilution.
Two main longer-term trends were seen:
1. Marked reductions in the amplitude of variability in TRP concentrations after c. 1998 on the lower main River Wye and the River Lugg. These reductions in in-stream TRP concentrations reflect introduction of effluent P-stripping, particularly Leominster, Hereford Eign and Hereford Rotherwas STWs in 1998.
2. Sporadically high TRP concentrations in 19957 in
some of the lowland tributaries (e.g. River Lodon at Stoke Lacy Bridge and Wriggle Brook at Hoarwith Bridge). 19957 were low-flow years (Fig. 9), and the higher TRP concentrations may reflect poor dilution of effluents as a result of depleted groundwater flows in these small groundwater-fed catchments
Nitrate
Four main trends in nitrate concentrations have been observed:
1. High baseline concentrations (in Gamber, Garren, Wriggle and Yazor brooks), indicating that highest NO3 -concentrations occur at low flows. Occasional lower concentrations occur, which are likely to reflect higher river flows and therefore dilution of groundwater by near-surface runoff. These sites are the lowland agricultural tributaries, which have a large groundwater input at low flows. Therefore, the high baseflow NO3 concentrations suggest high concentrations of NO3 in groundwater, which were also observed by Houston and Booker (1978).
2. Low baseline NO3 concentrations and occasional increased NO3 levels. These are the upland sites (both the main river Wye and its tributaries, e.g. Wye at Newbridge on Wye and upstream of the Marteg confluence, and the Rivers Edw and Ithon). Peaks in NO3 concentrations at these sites occur in 19951997, which may reflect post-drought flushing of NO3 from soils after prolonged periods of summer drought (Morecroft et al., 2000, Oborne et al., 1980). Edwards and Brooker (1982) also observed NO3 peaks on the Wye during the autumn of 1976, when a prolonged period of drought was terminated by heavy rainfall. 3. A 1995 minimum in NO3 concentrations, followed by
Fig. 8. Timeseries of Total Reactive Phophorus, Nitrate, Ammonia and Alkalinity concentrations at selected river
monitoring sites across the Wye catchment
Fig. 9. Mean annual flows on the River Wye at Erwood (upper catchment) and Redbrook (lower catchment) from 1994 to 1998. 0 20 40 60 80 100 120 140 1994 1995 1996 1997 1998 1999 2000 M e an a nnua l f low ( m 3 s -1)
Wye at Redbrook Wye at Erwood 1992 1993 1994 1995 1996 1997 1998 1999 2000 2001
50028 - R.WYE AT KERNE BR.GOODRICH TOTAL REACTIVE PHOSPHORUS (mg-P l-1)
1992 1993 1994 1995 1996 1997 1998 1999 2000 2001 50044 - R.LUGG @ HAMPTON CRT.BDG.UPPER
1992 1993 1994 1995 1996 1997 1998 1999 2000 2001 50072 - R LODON AT STOKE LACY BRIDGE TOTAL REACTIVE PHOSPHORUS (mg-P l-1)
1992 1993 1994 1995 1996 1997 1998 1999 2000 2001 50128 - GAMBER BRK AT KILBREECE BRIDGE
NITRATE (mg-N l-1)
1992 1993 1994 1995 1996 1997 1998 1999 2000 2001 50010 - R.WYE @ WYE BR.NEWB'DGE-ON-WYE
NITRATE (mg-N l-1)
1992 1993 1994 1995 1996 1997 1998 1999 2000 2001 50110 - R TROTHY AT TROY HOUSE BRIDGE
NITRATE (mg-N l-1)
1992 1993 1994 1995 1996 1997 1998 1999 2000 2001 50177 - R WYE AT GLYNN RAILWAY BRIDGE
AMMONIA - AS N (mg-N l-1)
1992 1993 1994 1995 1996 1997 1998 1999 2000 2001 50032 - R WYE AT REDBROOK RAILWAY BR.
ALKALINITY PH 4.5 (mg-CaCO3 l-1)
TOTAL REACTIVE PHOSPHORUS (mg-P l-1)
0. 0 0. 1 0. 2 0. 0 0. 3 0. 5 0. 0 1. 0 2. 0 0 10 20 0 1. 0 2. 0 0 3. 0 6. 0 0 0. 02 0. 10 0. 06 40 100 160
concentrations since 1998. This trend is apparent on the Rivers Trothy and Lugg.
4. No major trend over ten years in the main lower River Wye, although a relatively high degree of variability in concentrations around the LOESS trend line.
Ammonia
Many sites show no significant trend in NH3 concentrations, with low baseline concentrations and sporadically high concentrations throughout the sampling period. These may reflect flushing action under higher flows, perhaps linked to storm sewer overflows. Some sites along the main river Wye (e.g. the Wye at Glynn Railway Bridge) and on the tributaries (e.g. the Lugg at Mortimers Cross) show ammonia peaks similar to the NO3 peaks which occurred during 19951997. These may be linked to flushing of ammonia from soils after summer drought conditions.
Alkalinity
There are no consistent major trends in alkalinity across the catchment, although there may be a slight downturn in alkalinity in the drought years of 1995 to 1997 in the lower catchment (e.g. the River Wye at Redbrook). This reduction in alkalinity may result from CaCO3 precipitation under extreme baseflow conditions, where higher water residence times and greater in-stream biological activity promote degassing of CO2, and greater oversaturation of CaCO3 -saturated groundwaters as pH increases.
Relationships between river water concentrations and flow Total Reactive Phosphorus
Relationships between TRP concentrations and flow are generally poorly defined, suggesting that, rather than simple two-component mixing between low flow and high flow endmembers, there is a complex mixture of sources contributing under different flow conditions, together with in-stream processes, which may act as sources or sinks of TRP. The Lynfi, Arrow, Frome, Yazor Brook, Wye (at Ddol Farm) and Lugg (at Lugwardine) all show broadly negative relationships between TRP and flow (Fig. 10), suggesting that concentrations are most strongly influenced by point source (effluent) inputs, which are diluted under high flow conditions. In contrast, the Monnow at Tregate Bridge and Rudhill Brook have positive relationships between TRP and flow, suggesting TRP concentrations are most strongly linked to diffuse-source mobilisation.
Nitrate and Ammonia
Like TRP, relationships between NO3 and flow also exhibit a high degree of data scatter, suggesting complex source/
process controls. The Monnow, Wye at Cefyn Brwyn and Belmont and Ithon all show broadly positive relationships with flow, indicating the importance of diffuse (catchment) sources of NO3 at these sites. In contrast, there is some evidence of a negative relationship between NO3 concentrations and flow on the Lugg at Mortimers Cross Bridge and Yazor Brook. These two sites are located in the Herefordshire lowlands and will be strongly influenced by groundwater at baseflow. This corroborates earlier suggestions that the sporadically low NO3 concentrations in the lowland tributaries may be linked to dilution at high river flows by near-surface runoff with lower NO3 concentrations than groundwater. The relationships between NH3 and flow were highly scattered with no consistent patterns and are therefore not shown here.
Alkalinity
Most sites show a negative relationship between alkalinity and flow as a result of groundwater dilution by near-surface runoff at high flows. The negative relationships are weaker for some of the small lowland tributaries (Yazor Brook, Rudall Brook, the River Frome and the River Monnow), since a large proportion of runoff, even at higher flow conditions, comes from groundwater. In the lowland tributaries, even high flows have relatively large alkalinity values, and thus the variations in alkalinity between high and low flows are smaller.
Temporal variations in effluent water chemistry Total Reactive Phosphorus
Effluent discharges which have been subject to P-stripping, such as at Leominster, Hereford Eign and Hereford Rotherwas, show pronounced reductions in TRP concentrations (Fig. 11). TRP concentrations at Rotherwas and Eign STWs have fallen from summer maxima of around 2.5 mg-P l1 to less than detection limits (0.5 mg-P l1 for effluents). At Leominster, effluent concentrations have reduced from a maximum of 10 mg-P l1 prior to P-stripping to c. 1 mg-P l1 after P- stripping. There is a clear requirement here to improve detection limits for TRP concentrations in effluent in line with reductions in concentrations after P-stripping so as to assess variability in concentrations, effectiveness of the treatment process and for calculating TRP loadings to the river. Other STW discharges, which have not undergone P-stripping, such as at Presteigne, Ruardean, and Bronllys Hospital STWs, also show reductions in TRP concentrations after 1997. However, these reductions in TRP concentrations are not so well-defined. At these sites, the trends may simply reflect (a) upgrade to the STWs under the ongoing implementation of Asset
Fig. 10. Relationships with flow for Total Reactive Phosphorus, Nitrate and Alkalinity at selected river monitoring sites
across the Wye catchment
Management Plans by the Water Company and/or (b) variable effluent dilution effects, with lower throughput of water through the STWs during the drought years of 1995 7 and resultant higher concentrations of TRP in effluent. Reductions in TRP concentrations in 1998 may result from greater dilution of effluent under wetter conditions. Changes in concentrations of effluent linked to P-stripping therefore need to be examined with caution: in the absence of gauged effluent flows it is not possible to calculate changes in mass loads of TRP from STWs before and after P-stripping and changes in observed concentrations in effluent may therefore reflect changes in hydrological dilution. Prior to P-stripping, there was strong seasonality in effluent concentrations, which may be linked to seasonal changes in throughput of water through the STWs, with higher dilution and thus lower
concentrations during the winter months. As TRP concentrations fall below detection limits, these seasonal patterns cannot be resolved after P-stripping. At some sites (e.g. Clehonger STW), TRP concentrations have increased during the monitoring period
Nitrate
At sites with higher sampling frequency (e.g. Hereford Rotherwas STW), a strong seasonality in NO3 was apparent, with highest concentrations during the summer, linked to (a) lower water throughput through STWs and thus greater effluent concentration and (b) higher rates of nitrification at STWs during the summer months linked to higher temperatures. The main longer-term trend in NO3 observed at many STWs was a reduction in concentrations from 1992,
LLYNFI AT GREAT PORTHAMEL TOTAL REACTIVE PHOSPHORUS (mg-P l-1)
0 5 10 15 0 10 20 30 40 50
MONNOW AT TREGATE BRIDGE TOTAL REACTIVE PHOSPHORUS (mg-P l-1)
R LUGG @ MORTIMERS CROSS BR. NITRATE (mg-N l-1)
0 5 10 15 20 25 0 10 20 30 40 50
MONNOW AT TREGATE BRIDGE NITRATE (mg-N l-1)
R ARROW @ DOWNFIELD FARM BRDG ALKALINITY (mg-CaCO3l-1)
0 2 4 6 8 0 5 10 15
MONNOW AT TREGATE BRIDGE ALKALINITY (mg-CaCO3l-1) Flow (m3s-1) Flow (m3s-1) Flow (m3s-1) Flow (m3s-1) Flow (m3s-1) Flow (m3s-1) 0 1.0 2.0 0.5 1.5 2.5 0 0.2 0.1 0.3 0 4 2 6 1 3 5 50 100 150 200 120 220 160
reaching a minimum from 1993 to 1995 and then an increase to reach a maximum around 1998, with a fall-off in concentrations since 1999. This mirrors the NO3 concentration trend observed in the River Trothy, a river draining predominantly grassland, and lies within Type V (low NO3:Ca ratios). This may suggest that temporal patterns in NO3 concentrations in the Trothy are largely influenced by changes in effluent concentrations, or that the processes controlling riverine NO3 concentrations on the Trothy exhibit a similar environmental response as processes controlling NO3 concentrations in effluents.
Ammonia
NH3 concentrations in effluent do not show any well-defined seasonality. There is a diversity of trends in effluent NH3 concentrations with increases in concentration over the sampling period (e.g. Burghill STW) which may be linked to increased loading of STWs due to rising populations. Dramatic reductions in effluent NH3 concentrations during the monitoring period (e.g. Aberllynfi STW) may reflect improvements in the treatment process as a result of the Asset Management Plans adopted by the water company. At many sites there was an increase in concentrations during
the 19951997 drought period (e.g. Clehonger and Hay-on-Wye STWs), which may be linked to lower dilution of effluent. Many sites exhibit low and stable baseline concentrations, with periodic increases (e.g. Hereford Eign STW), which may be linked to storm overflows.
Nutrient loads and source contributions Variability in riverine nutrient loads
Analysis of spatial and temporal variations in riverine concentration data have indicated that factors controlling NO3 and TRP concentrations are complex and vary spatially and temporally according to differences in contributing sources (effluent, groundwater and diffuse catchment sources), changes in inputs from those sources over time as a result of agricultural, demographic and industrial changes in the catchment, changes in effluent treatment processes, variations in river flow and in-stream processing. To assess nutrient contributions from various parts of the catchments and the individual tributaries and variability in load contributions, annual mass loads of TRP, TP, NO3and NH3 were calculated for each of the EA flow gauging stations which had sufficient concentration and flow data to allow Fig. 11. Timeseries of Total Reactive Phosphorus, Nitrate and Ammonia concentrations at selected
effluent monitoring sites across the Wye catchment
1992 1993 1994 1995 1996 1997 1998 1999 2000 2001
LEOMINSTER (WORCESTER RD.)STW
TOTAL REACTIVE PHOSPHORUS (mg-P/l)
1992 1993 1994 1995 1996 1997 1998 1999 2000 2001 HEREFORD ROTHERWAS STW. 1992 1993 1994 1995 1996 1997 1998 1999 2000 2001 HEREFORD ROTHERWAS STW NITRATE (mg-N/l) 1992 1993 1994 1995 1996 1997 1998 1999 2000 2001 CLEHONGER STW. NITRATE (mg-N/l) 1992 1993 1994 1995 1996 1997 1998 1999 2000 2001 CLEHONGER STW AMMONIA - AS N (mg-N/l) 1992 1993 1994 1995 1996 1997 1998 1999 2000 2001 HEREFORD EIGN STW AMMONIA - AS N (mg-N/l) TOTAL REACTIVE PHOSPHORUS (mg-P/l)
2 4 6 8 10 0 1.5 3.0 0 5 10 15 0 10 20 30 40 0 10 20 30 40 5 15 0 10 20 30
estimation of load values to be for all of six consecutive years (1995 to 2000; see Methods, Table 2). Average loads per hectare per year and flow-weighted mean concentrations were also calculated.
Nutrient loads in the rivers of the Wye catchent vary spatially according to flow volume, with highest loads in the downstream reaches of the main River Wye and its major tributaries. For TRP, TP, NO3 and NH3, the highest mean annual loads were consistently found at Redbrook at the catchment outlet, and the lowest mean annual loads were found at Cefyn Brwyn. There is a high degree of inter-annual variability in river nutrient loads, with mean annual loads of TRP, TP, NO3 and NH3 typically highest in the high-flow years of 19982000 and lowest during 19951997, corresponding with the period of prolonged low river flows. However, nutrient load timeseries in some of the smaller tributaries show more complex patterns which do not correspond so closely with patterns in mean annual river flows and may therefore be linked to changes in local source availability. Differences in sampling practice can also have an important impact on load estimates. The change from periodic (e.g. regular monthly sampling) to storm event sampling can result in anomalously higher loads for particular years. For example, intensive storm-event sampling was undertaken on the Wye at Redbrook in 1995. Therefore, despite 1995 being a relatively low-flow year (Fig. 9), Redbrook exhibits the highest TRP and TP loads in 1995.
Although the annual load estimates show the magnitude of flux transfers through the catchment, these results merely demonstrate that the larger the catchment, the higher the flow and the greater the flux. Therefore, it is of value to examine the relative flux contributions for the various parts of the catchment, by examining mean annual loads on an area-weighted basis and flow weighted mean concentrations (Table 2). The highest and lowest mean annual loads per hectare are reported as well as those for the catchment outlet: (i) TRP - mean annual TRP loads per ha were highest on the Frome (0.67 kg-P ha1a1), an eastern tributary of the lower River Wye, compared with minimum of 0.04 kg-P ha1a1 on the Elan, a tributary in the upper Wye catchment. The mean annual TRP load per ha at the catchment outlet at Redbrook was 0.36 kg-P ha1 a1. (ii) TP highest mean annual TP loads per ha were found
on the Frome (0.93 kg-P ha1 a1), compared with a minimum of 0.15 kg-P ha1 a1 on the River Elan. The mean annual TP load per ha at the catchment outlet at Redbrook was 0.66 kg-P ha1 a1.
(iii) NO3 - the Lugg at Byton had the highest mean annual NO3 load per ha(30.3 kg-N ha1 a1) and the minimum
mean annual NO3- load per ha was 2.25 kg-N ha1 a1 in the Elan. The mean annual NO3- load per ha at the catchment outlet at Redbrook was 22.2 kg-N ha1 a1. (iv) NH3 - mean annual loads per ha ranged from a minimum
of 0.16 kg-N ha1 a-1 in the River Lugg at Byton, to 0.46 kg-N ha1 a1 in the River Irfon and upper Wye at Cefyn Brwynn. The mean annual NH3 load per ha at the catchment outlet at Redbrook was 0.35 kg-N ha1 a1.
The area-weighted TP fluxes for the Wye, presented here, are considerably lower than TP losses in runoff from UK arable fields and first order streams draining arable land, which are typically c. 3 kg-P ha-1 a-1 (Catt et al, 1998). TP fluxes for the Wye catchments would be expected to be lower than in agricultural first order streams and plot experiments, because of the larger catchment sizes, greater distance between the agricultural source and the monitoring station and the retention of particulate-bound P within the river system. However, area-weighted TP fluxes for the Wye are also lower than corresponding TP yields for other lowland UK rivers of similar catchment scale (e.g. 1.6 - 2.1 kg-P ha-1 a-1 , Russell et al, 1998). For the Wye, TP loads may be underestimated as a result of the relative infrequency of water sampling (monthly intervals), which has poor coverage of high-flow periods, when peak TP is transported. However, the Wye TRP area-weighted fluxes are more consistent with TRP yields for rural lowland in eastern Britain, e.g. River Tweed (0.2 kg-P ha-1 a-1), River Derwent (0.3 kg-P ha-1a-1) and River Ouse (Yorkshire) (0.6 kg-P ha-1 a-1) (Robson and Neal, 1997). Monthly sampling is less likely to underestimate fluxes for TRP because the major source of TRP in the Wye rivers is effluent. Fluxes derived from point sources tend to be more consistent across the flow cycle, compared with diffuse source fluxes, which are predominantly mobilized under high flows.
Flow-weighted mean concentrations show very similar spatial patterns to mean annual area-weighted loads for TRP, TP and NO3, with highest values on the Frome, the lower Wye, Monnow and Lugg and its tributaries, and lowest values in the upper Wye catchment, demonstrating the link between catchment area and flow. However, for NH3, the similarity breaks down, with highest NH3 loads per ha on the upper Wye, which may be linked to atmospheric sources.
Assessing contributions of nutrient from the upper and lower catchments and from effluent sources
Determining the relative contributions of point and diffuse sources to river nutrient loads is more problematic, because the EA monitoring programme does not monitor diffuse
Table 2. Mean annual nutrient loads (t a-1) and load ranges, flow-weighted mean concentrations and mean annual loads per hectare for Total Reactive Phosphorus, Total Phosphorus, Nitrate and Ammonia at river gauging stations within the Wye catchment.
Site Determinand mean median max min Year of Year of Flow-wtd Area-wtd max min mean load load load (mg l1) (kg ha1a1)
GSTN 55023: WYE AT REDBROOK Total Reactive 144 139 185 94.7 1998 1996 0.055 0.36
GSTN 55003: LUGG AT LUGWARDINE Phosphorus (as P) 50.8 54.5 69.8 29.4 2000 1997 0.128 0.57
GSTN 55002: WYE AT BELMONT 45.9 50.5 62.4 16.9 2000 1999 0.027 0.24
GSTN 55007: WYE AT ERWOOD 21.5 15.4 52.8 9.17 1998 1996 0.016 0.17
GSTN 55029: MONNOW AT GROSSMONT 14.0 9.67 42.2 3.82 2000 1995 0.058 0.39
GSTN 55028: FROME AT BISHOPS FROME 5.24 4.84 10.35 2.76 2000 1995 0.266 0.67
GSTN 55013: ARROW AT TITLEY MILL 4.57 4.66 6.04 2.85 1998 1997 0.057 0.36
GSTN 55012: IRFON AT CILMERY 3.38 3.35 6.05 0.87 1995 1997 0.009 0.14
GSTN 55014: LUGG AT BYTON 3.07 3.02 4.85 1.83 1998 1996 0.022 0.15
GSTN 55026: WYE AT DDOL FARM 2.44 2.24 4.37 1.20 1995 1997 0.010 0.14
GSTN 55032: ELAN AT ELAN VILLAGE 0.73 0.49 2.50 0.13 1995 1996 0.005 0.04
GSTN 55008: WYE AT CEFYN BRWYNN 0.13 0.12 0.24 0.07 1995 1997 0.006 0.12
GSTN 55023: WYE AT REDBROOK Total 263 237 448 147 1995 1996 0.099 0.66
GSTN 55002: WYE AT BELMONT Phosphorus (as P) 89.4 91.7 139 32.3 1998 1996 0.052 0.47
GSTN 55007: WYE AT ERWOOD 52.3 41.2 120 17.4 1998 1996 0.038 0.41
GSTN 55029: MONNOW AT GROSSMONT 22.4 14.5 65.8 7.91 2000 1997 0.094 0.63
GSTN 55012: IRFON AT CILMERY 7.97 7.16 16.6 2.88 2000 1997 0.020 0.33
GSTN 55028: FROME AT BISHOPS FROME 7.29 6.04 16.2 3.57 2000 1996 0.359 0.93
GSTN 55026: WYE AT DDOL FARM 7.18 7.09 13.7 2.34 1995 1996 0.030 0.41
GSTN 55014: LUGG AT BYTON 4.89 4.87 8.03 2.35 1998 1996 0.035 0.24
GSTN 55032: ELAN AT ELAN VILLAGE 2.73 2.07 7.40 0.51 1999 1996 0.015 0.015
GSTN 55008: WYE AT CEFYN BRWYNN 0.46 0.36 1.11 0.22 1995 1996 0.022 0.41
GSTN 55023: WYE AT REDBROOK Nitrate (as N) 8896 8990 11515 6334 2000 1997 3.25 22.2
GSTN 55002: WYE AT BELMONT 2912 2706 4244 2323 2000 1995 1.74 15.4
GSTN 55007: WYE AT ERWOOD 1469 1513 1722 1002 1998 1995 1.19 11.5
GSTN 55029: MONNOW AT GROSSMONT 711 709 856 544 1998 1997 3.31 20.1
GSTN 55014: LUGG AT BYTON 615 620 736 444 1998 1998 4.44 30.3
GSTN 55013: ARROW AT TITLEY MILL 314 316 395 221 1998 1997 4.04 24.9
GSTN 55012: IRFON AT CILMERY 275 286 378 160 1998 1996 0.75 11.3
GSTN 55026: WYE AT DDOL FARM 204 203 281 128 1998 1995 0.85 11.7
GSTN 55028: FROME AT BISHOPS FROME 148 155 238 61.5 1999 1995 7.69 19.0
GSTN 55032: ELAN AT ELAN VILLAGE 41.3 43.1 65.5 7.81 1998 1996 0.24 2.25
GSTN 55008: WYE AT CEFYN BRWYNN 4.44 4.77 5.55 2.87 1999 1995 0.20 4.04
GSTN 55023: WYE AT REDBROOK Ammonia (as N) 139 126 206 92.4 1998 1996 0.052 0.35
GSTN 55002: WYE AT BELMONT 60.8 48.0 107 34.2 1998 1997 0.035 0.32
GSTN 55007: WYE AT ERWOOD 33.2 33.2 47.5 14.6 2000 1997 0.026 0.26
GSTN 55003: LUGG AT LUGWARDINE 24.4 17.6 56.1 7.94 2000 1996 0.058 0.28
GSTN 55012: IRFON AT CILMERY 11.2 12.4 16.4 3.23 1996 1997 0.031 0.46
GSTN 55029: MONNOW AT GROSSMONT 10.5 9.24 18.4 5.76 2000 1998 0.048 0.30
GSTN 55026: WYE AT DDOL FARM 5.05 5.33 5.59 3.58 2000 1997 0.021 0.29
GSTN 55032: ELAN AT ELAN VILLAGE 4.52 3.51 7.28 2.95 1998 1997 0.031 0.25
GSTN 55013: ARROW AT TITLEY MILL 4.35 4.22 6.11 3.04 1996 2000 0.058 0.34
GSTN 55014: LUGG AT BYTON 3.18 3.12 4.47 2.07 1995 1998 0.023 0.16
GSTN 55028: FROME AT BISHOPS FROME 2.63 1.24 9.55 0.52 2000 1999 0.106 0.34
source contributions specifically, and sampling sites in agricultural headwater regions are very sparse. Most water quality monitoring is focused around point sources and downstream river reaches. The lack of gauged effluent flow data means that it is also impossible to assess changes in loads of sewage effluent over time. Therefore, to assess sources of nutrients in the Wye, a more pragmatic approach was adopted whereby average annual effluent loads were calculated for each of the major effluent discharge points in the catchment, based on the product of the upper 25% of concentrations and the consented dry weather flow (see Methods) for the two years prior to the introduction of P-stripping at STWs across the catchment (19956) and for the two years after the main phase of P-stripping (1999 2000) (Table 3). However, the accuracy of TRP loads estimates in the aftermath of P-stripping is hampered by values falling below detection limits. Therefore, effluent inputs after P-stripping are likely to be over-estimated.
Riverine nutrient loads for 1995, 1996, 1999 and 2000 were then calculated for the main River Wye at Erwood, which drains the upper Wye catchment and the main River Wye at Redbrook, which drains the whole Wye catchment. The loads from the upper catchment to Erwood were subtracted from the loads at Erwood to provide an estimate of the load contributions from the lower catchment. Annual effluent loads draining to upper and lower catchments were then calculated, using the average annual pre-stripping and post-stripping effluent loads at each STW.
Comparing the estimated average annual effluent loads before and after introduction of P-stripping, there was a 26% reduction in TRP and a 36% reduction in TP loads at Redbrook, compared with a 10% reduction in TRP loads and a 29% reduction in TP loads at Erwood. However, comparison of riverine loads from 19956 and 19992000 to examine the effects of P-stripping on in-stream P loading is complicated by changes in hydrology during this period (Fig. 9): 19956 were low-flow years, whereas 19992000 were high-flow years, when a larger contribution of P from diffuse sources might be expected. Therefore, despite introduction of P-stripping, annual TRP riverine loads at Redbrook increased by 60% between 1996 and 1999. The anomalously high TRP and TP loads at Erwood and Redbrook during the low-flow year of 1995 were influenced by a bias towards high flow sampling, as discussed above. The annual riverine load data indicate that the upper catchment contributes between 6 and 15 % of the TRP load and between 9 and 28 % of the TP load of the whole catchment. For the TUP fraction, the upper catchment provides between 10 and 42 % of the whole-catchment TUP load. The upper catchment also contributes between 16 and 49% of the whole-catchment NH3 load, compared with
between 12 and 22 % of the whole catchment NO3 load. Effluent nutrient loads expressed as percentages of river load are consistently higher for the lower catchment, reflecting the greater density of population and industry and thus effluent inputs to the lower catchment. Effluent loads of NO3 represent the smallest percentage of riverine loads (0.6 to 1.1% of the upper catchment river NO3 loads and 2.1 to 2.8% of the lower catchment river NO3 loads), suggesting that riverine NO3 loads have a greater diffuse source component than the other determinands. In contrast, effluent loads account for up >100 % of riverine NH3 loads in the lower catchment, indicating that more ammonia is entering the river than is measured in the stream, suggesting the importance of in-stream processes in nitrification of ammonia. Effluent loads as a percentage of riverine loads are consistently smaller for TUP than TRP, suggesting that there is a greater diffuse source contribution to riverine TUP loads than TRP loads. Effluent loads as a percentage of riverine loads are highest during 1996, which has the lowest flows of the four years shown here: in 1996 up to 93% of the TRP load from the lower catchment may be attributed to effluent inputs.
Conclusions
The Wye is an important catchment from an ecological perspective, given the wide diversity of habitats, from upland base- and nutrient-poor streams to nutrient and sediment-rich lowland agricultural tributaries. This study has shown that the nutrient water quality across the upper and middle catchment and along the main river Wye is generally very good, mainly as a result of dilution by high-quality water from the upland areas of the upper Wye catchment. However, the main areas of concern lie in the small agricultural tributaries in the south and east of the catchment, which have low dilution capacity and high agricultural and effluent inputs. These small streams drain predominantly Old Red Sandstone series, with water sources dominated by NO3-rich groundwaters, are subject to high nutrient concentrations and are at risk of eutrophication. The highest concentrations of NO3, TRP and alkalinity are all found in these eastern tributaries, although the sites with highest concentrations vary for different determinands according to the major sources: TRP concentrations are highest in the sewage-impacted tributaries, NO3 concentrations are highest in sub-catchments with high arable intensity, and alkalinity is highest in areas where weathering rates are highest, particularly groundwater-fed streams. Ratios of Ca:Alkalinity demonstrate a split between the Sandstones and Marls of the Old Red Sandstone series. The Marls, which have higher weathering rates (Edwards and Brooker, 1982),