Effects of proof tests on the safety performance of
safety-instrumented systems
Noureddine Asklou* and Rachid Noureddine
University of Oran 2 Mohamed Ben Ahmed, Institute of Maintenance and Industrial Safety, Oran, Algeria
Email: [email protected] Email: [email protected] *Corresponding author
Abstract: The imperfection in the values of the average probability of failure
on demand (PFDavg) creates uncertainty about the effectiveness of safety-instrumented system (SIS). To overcome this problem, many parameters such as dangerous failures, common cause failures, diagnostic coverage rate and proof tests are taken into consideration. In order to emphasise the importance of the proof tests and show their effects on the safety performance of the SIS, a new analytical formula is developed in this study. The impact of these tests on the SIS’s allocation of the safe integrity level (SIL) is shown through the results obtained in the present research.
Keywords: Safety-instrumented system; proof test; average probability of
failure on demand; PFDavg; safety integrity level; SIL.
Reference to this paper should be made as follows: Asklou, N. and
Noureddine , R. ‘Effects ofproof testsonthesafety performance ofsafety -instrumentedsystems’,Int.J.IndustrialandSystemsEngineering,( inpress).
Biographical notes: Noureddine Asklou is doctoral student in Electro-MechanicsatInstituteofMaintenanceandIndustrialSafety(IMSI)of Universityof Oran 2Mohamed BenAhmed (Algeria). Hisinterests include maintenance,reliabilityandoptimizationofsafety-instrumentedsystems(SIS). Rachid Noureddine is an Associate Professor in Mechanics Engineering at InstituteofMaintenanceandIndustrialSafety(IMSI)ofUniversityofOran2 MohamedBenAhmed(Algeria)since2002.HeisaResearch Directorsince 2013andhisresearchinterestsinvolvemaintenanceandsafetyengineeringin industrialsystems. He was an AssistantDirector of the IMSIinstitute from 2014 to 2017 where he served as the Head of the Electro-Mechanical Departmentfrom2005to2007.
1 Introduction
Complex industrial systems present risks to people, the environment and property. For this reason, various types of safety must be implemented: These types of safety, such as safety-instrumented system (SIS) use mean of contributing either in prevention or in protection to reduce the consequences of failures.
The role of a SIS is to detect dangerous events that could lead to an accident and then to initiate a set of actions necessary for the safe fall-back position of the equipment under control (EUC). This defines the safety integrity function (SIF) also called safety loop.
To design these systems, standards are used, including ANSI/ISA S84.01-1996 (ISA-TR84.00.02, 2002; Rausand, 2014) and IEC 61511 (IEC 61511, 2003), which is a sector process industry standard derived from the generic standard IEC 61508 (IEC 61508, 2010). So, different techniques can be used and among these techniques may be found, the reliability block diagrams (Catelani et al., 2011; Jin et al., 2016, 2015), Petri networks (Signoret et al., 2013; Liu and Rausand, 2016), the Markov chains (Torres-Echeverria et al., 2011; Chebila and Innal, 2015; Dutuit et al., 2008; Innal et al., 2015; Mechri et al., 2015; Aggarwal et al., 2017; Gupta and Ram, 2018), as well as bayesian networks (Cai et al., 2016).
In this work, a new analytical formula is presented to evaluate the performance of the SIS. The proposed approach combines the considerations of the efficiency parameter ‘ξ’ and the safety parameter ‘γ’ related to the proof tests with the IEC 61508 standard formulas.
2 Safety-instrumented system
The safety-instrumented system is a system with one or more SIF. It consists of (Rausand, 2014):
• Sensor(s) (S): used to monitor process state (temperature, pressure, level, flow, etc.). • Logic solver(s) (LS): determine, based on signals from the sensors elements, whether
an abnormal situation has occurred and initiates the required actions.
• Finalelement(s)(FE):Maybevalves,relays,circuitbreakerscapableofstopping flowandisolatingelectricalequipmentandmanymore.
An essential step in designing a SIS, is to establish a safety integrity level (SIL) translated into target failure measures.
2.1 Safety integrity level
For a SIS characterised by low or high (continuous) demand, the safety integrity level (SIL) should be identified by its average probability of failure on demand (PFDavg) and its probability of dangerous failure per hour (PFH), respectively. The IEC 61508 standard establishes the classification of systems studied according to 4 levels, defined in Table 1.
Table 1 Safety integrity level (SIL) according to PFDavg and PFH SIL PFDavg PFH (/h) 1 [10–2; 10–1] [10–6; 10–5] 2 [10–3; 10–2] [10–7; 10–6] 3 [10–4; 10–3] [10–8; 10–7] 4 [10–5; 10–4] [10–9; 10–8]
The SIF performances provided by an SIS are determined by calculating and combining the performance of their three subsystems (S, LS and FE). This can be expressed by the following equations (IEC 61508, 2010):
( ) ( ) ( )
avg avg avg avg
PFD =PFD S +PFD LS +PFD FE (1)
( ) ( ) ( )
PFH=PFH S +PFH LS +PFH FE (2)
( ) ( ) ( )
avg avg avg avg
PFS =PFS S +PFS LS +PFS FE (3)
( ) ( ) ( )
avg avg avg avg
STR =STR S +STR LS +STR FE (4)
2.2 KooN architecture
Each of the three subsystems cited above, is represented by a KooN architecture, which makes it possible to achieve a compromise between safety, availability and installations’ costs. A KooN type redundancy is a redundancy known as majority redundancy such that a function is only ensured if at least K of the existing N means are operational or functioning. The most frequently encountered SIS architectures are as follows (Rausand, 2014):
• 1001: single element architecture, such that any dangerous failure of this element prevents the correct processing of any valid alarm signal.
• 1002: architecture constituted by two elements so that each one can process the safety function.
• 2002: architecture consisting of two elements so that the safety function is activated only if both elements request it. In this scheme, production availability is ensured at the expense of safety.
• 2003: architecture consisting of three elements so that the safety function is activated only if two of the three elements demand it.
3 Failure rate
The IEC 61508 standard specifies the necessary parameters to evaluate SIS performance such as the failure rate of components, periodic test interval, mean time to restoration, diagnostic coverage rate and common cause failure factor.
3.1 Dangerous failure – safe failure
All SIS failures, random and systematic ones, can be classified, according to their effects, into one of two categories: ‘safe failures’ or ‘dangerous failures’. The definitions of these two categories according to the IEC 61508 standard are given below:
• Dangerous failure: failure which tends to inhibit the safety function when requested by the EUC, which hence will be in a dangerous state.
• Safe failure: spurious failure which tends to anticipate the activation of the safety function (without a demand condition), leading effectively the EUC into a safe state. From the definitions above, it can be said that a dangerous failure is a failure that tends to prevent the system from fulfilling its safety function in the event of a request from the EUC which will then be in a dangerous state. A safety failure called also safe fault which tends to anticipate the activation of the safety function, in the absence of any request, by effectively driving the EUC in a safe state. That is, the occurrence of any adverse event is no longer possible. According to IEC 61508, the random failure rate (λ) of each element can be then written as:
S D
λ=λ +λ (5)
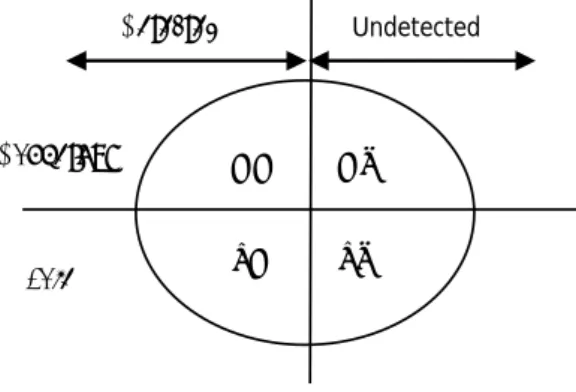
Another decomposition of the failures is generated, when taking into account their detection or no detection, by on-line tests (diagnostic tests): The first ones are called ‘detected failures’ and the second ones ‘undetected failures’ (IEC 61508, 2010). Undetected failures can only be revealed during proof tests or when the EUC requests the SIS, are known as undetected failures. Figure 1 shows this double decomposition. Figure 1 Failure decomposition according to IEC 61508 standard
Detected Undetected Dangerous Safe DD SD DU SU 3.2 Diagnostic coverage
The ability of an SIS to detect its failures online is characterised by its coverage rate or diagnostic coverage DC (IEC 61508, 2010). This coverage is expressed as a number from 0 to 1, or as a percentage.
By introducing diagnostic coverage, the various failure rates mentioned above, are defined as follows according to IEC 61508:
DD D
(1 ) DU D λ = −DC λ⋅ (7) SD S S λ =DC λ⋅ (8)
(
1)
D S S λ = −DC ⋅ (9) λ D DD DU λ =λ +λ (10) S SD SU λ =λ +λ (11)3.3 Common cause failures
There are also failures that can simultaneously affect all components of a redundant architecture called common cause failures CCF. To estimate their failure rate (λCCF), the IEC 61508 uses the beta-factor model (IEC 61508, 2010).
(
1)
x xind xCCF x x x x
λ =λ +λ = −β λ +β λ (12)
The index ‘ind’ means independent failures rate whose occurrence only affects the channel in question, while ‘x’ is used to account for the previous failures partition (DU, DD, SD and SU). In practice fact, the β factor represents the ratio between the dependent part and the total failure rate.
3.4 Proof tests
Diagnosis (online testing) and proof tests (offline testing) are very important means of verifying whether an SIS is able to fulfil its safety functions and to reveal failures that hinder the process from being safe when there is a request. Diagnosis is a means of online detection of deviations, degradation and discrepancies and is often carried out by dedicated hardware and software implemented in devices. So far, it has been assumed that proof tests and the associated repair actions are perfect in the sense that (Rausand 2014): – the proof test is carried out under conditions that are identical with and covers all relevant demand conditions; – all DU faults and all element faults that increase the likelihood of a DU fault are revealed by the proof test.; – all channels with a (revealed) DU fault are repaired and all channels are always restarted in an as-good-as-new condition. This is obviously not always realistic. Some demands are hazardous events and may occur in many different ways. To simulate a demand may also be hazardous and may need to be repeated several times to cover all aspects of the demand. Proof tests are often carried out under conditions that are different from real demand conditions and may, therefore, not be fully realistic.
4 Proposed approach
4.1 Analytical formulas review
There are several analytical equations in the literature that deal with the performance of safety-instrumented systems, the most commonly used are the formulas given by IEC 61508. There are also the formulas developed in the Norwegian organism SINTEF
(SINTEF, 2006), which implements a generalised factor, less pessimistic than used by the IEC 61508. In the US standard ISA (ISA, 2002), the formulas given represent more optimistic approximations than those of IEC 61508 standard. In Innal et al. (2015) PFDavg, PFH (probability of dangerous PFH), spurious trip rate (STR) and analytical formulations have been developed using the Markov method. Goble (1998) calculates only PFDavg and probability of failing safely (PFS) by Markovian models, while Jin et al. (2013) takes into account the detected dangerous faults and neglects β factor (common cause failures proportion) for the calculation of PFH.
Usually the proof test is considered perfect, but in fact, it is not the case, which means that it doesn’t cover 100% of the failures not detected by the self-diagnosis test. There are researches addressing this imperfection (Jin et al., 2015; Mechri et al., 2015) and (Asklou and Noureddine, 2017). Jin et al. (2015) considers that there is λDU that cannot be detected by the proof test but can only be found when the SIS is working. While Mechri et al. (2015) processed the SIS using the Markov chain, in particular by entering two parameters: efficiency parameter ‘ξ’ and safety parameter ‘γ’. In Asklou and Noureddine (2017), Jin’s et al. (2015) corrections are introduced into the analytical formulas derived from the IEC 61508 standard. This approach is referred to below as the IECξ approach in this study.
4.2 Formulas IEC 61508
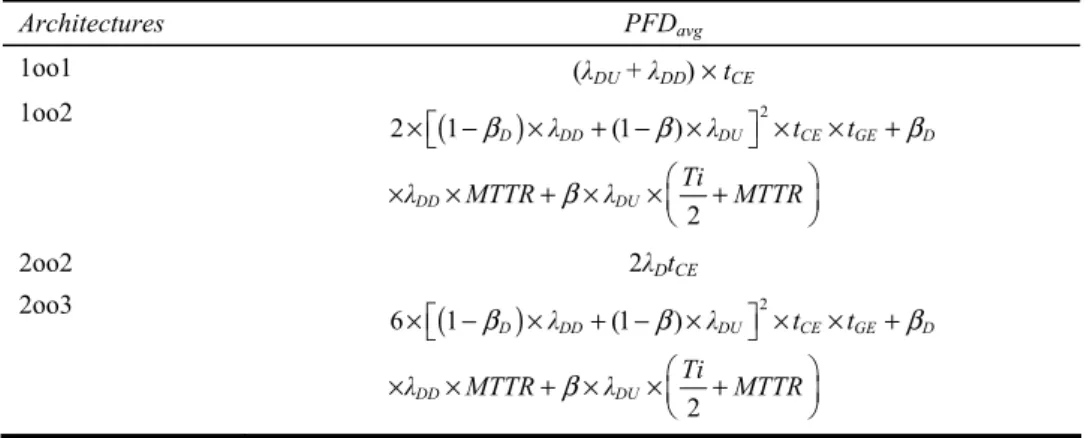
IEC 61508 part 2 provides simplified formulas for the PFDavg for SIS architectures with no more than three channels whose are mutually independent and homogeneous (Rausand, 2014). The different formulas of the components 1oo1, 1oo2, 2002, 2003 and reliability parameters used (λ, DC, β, …) are grouped in Table 2.
Considering that: 1 2 DU DD CE D D λ T λ T MTTR MTTR λ λ ⎛ ⎞ = ×⎜⎝ + ⎟⎠+ × (13) 1 3 DU DD GE D D λ T λ T MTTR MTTR λ λ ⎛ ⎞ = ×⎜ + ⎟+ × ⎝ ⎠ (14) 2 D = × β β (15) So:
4.3 Proof test corrections
It is very difficult to find out all potential dangerous failures by proof test and some dangerous failures still exist in the whole life period of the system instead of being found. Mechri et al. (2015) and Jin et al. (2015) consider the imperfect proof test.
Mechri et al. (2015) defines two parameters to increase the efficiency and performance of proof tests by basing its analysis on multi-phase Markov chains. The parameters considered are:
• Efficiency parameter ξ: this is the conditional probability that an undetected failure will not be detected by the proof test since the fault occurs when the proof test is started. This parameter represents the ability of the proof test to reveal latent failures.
Therefore (1 – ξ) represents the proof test capacity to reveal latent failures. A proof test is perfect if ξ = 0 since all undetected failures are revealed and a proof test is imperfect if ξ > 0. The corresponding possible occurrence time of the dangerous failure undetected by proof test is the system life period SL. Some analysts provide an estimate of ξ in the manual This estimate is obtained for example by conducting a detailed FMECA to assess the capacity of the proof test to reveal latent failures. • Safety parameter γ: this is the probability of failure due to the test. This parameter
represents the safety of the proof test. Therefore, a proof test is ideal if γ = 0 since no failures are caused by the proof test.
Table 2 Analytical formulas for the PFDavg of KooN architectures according to IEC 61508-6 Architectures PFDavg 1oo1 (λDU + λDD) × tCE 1oo2
(
)
2 2 1 (1 ) 2 D DD DU CE GE D DD DU λ λ t t Ti λ MTTR λ MTTR ⎡ ⎤ ×⎣ − × + − × ⎦ × × + ⎛ ⎞ × × + × ×⎜⎝ + ⎟⎠ β β β β 2oo2 2λDtCE 2oo3(
)
2 6 1 (1 ) 2 D DD DU CE GE D DD DU λ λ t t Ti λ MTTR λ MTTR ⎡ ⎤ ×⎣ − × + − × ⎦ × × + ⎛ ⎞ × × + × ×⎜⎝ + ⎟⎠ β β β β Source: IEC 61508 (2010)Jin et al. (2015) only considers the efficiency parameter ξ.
In consideration of the proof test coverage ξ, λDU1 (that can be detected by periodic
test) = ξ . λDU and λDU2 (that cannot be detected by periodic test) = (1 – ξ) λDU, the dangerous failure rate of an element will consist of:
• λDD: dangerous failure rate that can be detected through self-diagnostic test. • λDU1: dangerous failure rate that can be detected by proof test.
• λDU2: dangerous failure rate that cannot be detected by proof test.
4.4 Proposed IECξγ approach
In this section, we propose to combine the consideration of Mechri et al. (2015), linked to the failure rate not detected by the proof test, with the formulas of IEC 61508 standard in order to improve the evaluation of the performance of low-demand safety-instrumented systems, safe failures are not covered in the presented models. This proposal will be referred to as the IECξγ approach.
Taking into account Mechri’s consideration by introducing the two parameters ξ and γ into equations (13) and (14), the formulas below can be obtained:
1 (1 ) (1 ) 2 2 DU DD DU CE D D D ξ γ λ T λ ξ λ SL T MTTR MTTR MTTR λ λ λ − ⎛ ⎞ − ⎛ ⎞ = ×⎜ + ⎟+ × + ×⎜ + ⎟ ⎝ ⎠ ⎝ ⎠ (16)
1 (1 ) (1 ) 3 3 DU DD DU GE D D D ξ γ λ T λ ξ λ SL T MTTR MTTR MTTR λ λ λ − ⎛ ⎞ − ⎛ ⎞ = ×⎝⎜ + ⎟⎠+ × + ×⎜⎝ + ⎟⎠ (17)
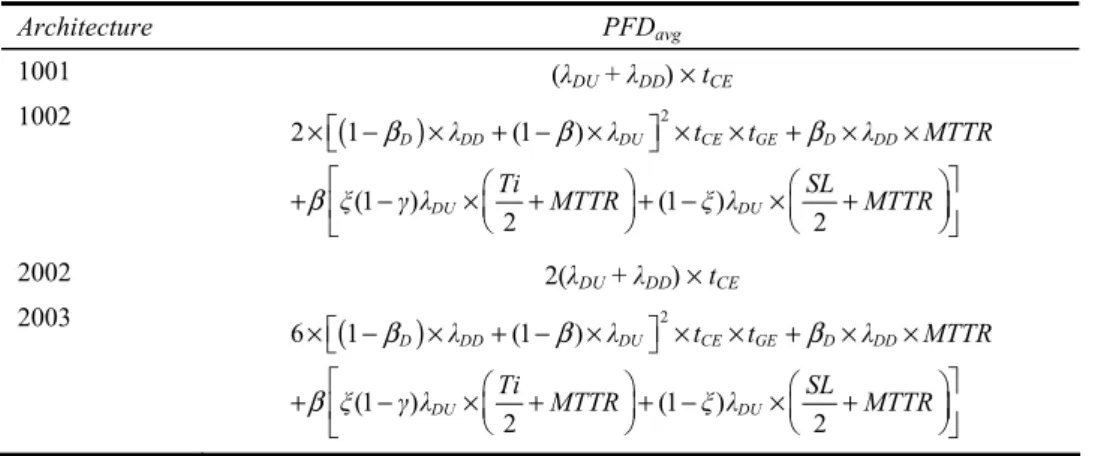
These new equations are used to generate the PFDavg formulas in the IECξγ approach, given in Table 3.
Table 3 Proposed ‘IECξγ’ formulas for PFDavg
Architecture PFDavg 1001 (λDU + λDD) × tCE 1002
(
)
2 2 1 (1 ) (1 ) (1 ) 2 2 D DD DU CE GE D DD DU DU λ λ t t λ MTTR Ti SL ξ γ λ MTTR ξ λ MTTR ⎡ ⎤ ×⎣ − × + − × ⎦ × × + × × ⎡ ⎛ ⎞ ⎛ ⎞⎤ + ⎣⎢ − ×⎝⎜ + ⎟⎠+ − ×⎝⎜ + ⎠⎟⎥⎦ β β β β 2002 2(λDU + λDD) × tCE 2003(
)
2 6 1 (1 ) (1 ) (1 ) 2 2 D DD DU CE GE D DD DU DU λ λ t t λ MTTR Ti SL ξ γ λ MTTR ξ λ MTTR ⎡ ⎤ ×⎣ − × + − × ⎦ × × + × × ⎡ ⎛ ⎞ ⎛ ⎞⎤ + ⎢ − ×⎝⎜ + ⎠⎟+ − ×⎜⎝ + ⎟⎠⎥ ⎣ ⎦ β β β β 5 Case studyThe case considered is an example inspired from Torres-Echeverria et al. (2011) and Mechri et al. (2015). Figure 2 shows the layout of the SIS being studied, which makes it possible to secure a chemical reactor. This type of system can be set up when a temperature or pressure exceedance is detected, the safety system cuts off the reactor supply to avoid a runaway reaction.
Figure 2 Chemical reactor SIS Sub-system LS Sub-system detection SI Sub-system FE Chemical reactor S2 S1 LS3 FE2 FE3 S4 S3 Sub-system detection SII FE1 LS2 LS1
5.1 Reliability diagram
The four subsystems that make up the SIS are: two temperature sensors, two pressure sensors, three logic solvers and three valves.
The KooN architecture of the four subsystems is as follows: • Sub-system SI (S1, S2: pressure sensors): 1oo2.
• Sub-system SII (S3, S4: temperature sensors): 1oo2. • Sub-system LS (LS1, LS2, LS3: logic solvers): 1oo3. • Sub-system FE (FE1, FE2, FE3: valves): 1oo3.
The reliability block diagram corresponding to this SIS is given in figure 3. Figure 3 SIS reliability diagram
1/2 1/3 1/3 S1 S2 S3 S4 LS1 LS2 LS3 FE1 FE2 FE3 1/2
On this case study, we apply the proposed approach IECξγ by calculating the probability of failure on demand average (PFDavg) of the SIS.
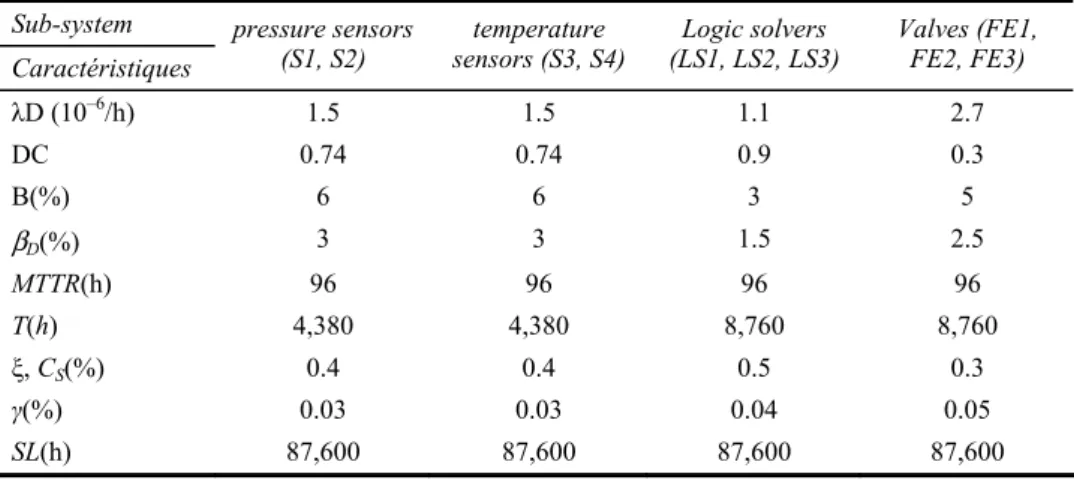
The reliability data in Table 4 from the reference Solfrid et al. (2013) in Iddir (2015) coupled with the example of Mechri et al. (2015) are retained.
Table 4 Reliability data characterising the SIS Sub-system
Caractéristiques
pressure sensors
(S1, S2) sensors (S3, S4) temperature (LS1, LS2, LS3) Logic solvers Valves (FE1, FE2, FE3)
λD (10–6/h) 1.5 1.5 1.1 2.7 DC 0.74 0.74 0.9 0.3 Β(%) 6 6 3 5 βD(%) 3 3 1.5 2.5 MTTR(h) 96 96 96 96 T(h) 4,380 4,380 8,760 8,760 ξ, CS(%) 0.4 0.4 0.5 0.3 γ(%) 0.03 0.03 0.04 0.05 SL(h) 87,600 87,600 87,600 87,600
5.2 Presentation of results
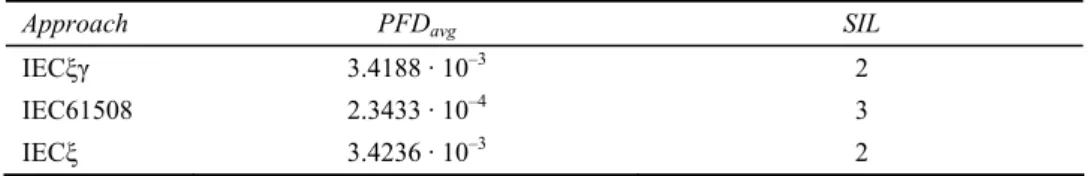
For this system, the probability of average failure on demand is calculated using both IECξγ and IEC61508 approaches, taking into account the results obtained by the IECξ approach (Asklou and Noureddine, 2017). Thus, the results obtained from PFDavg using IECξγ, IEC61508 and IECξγ approaches are presented in Table 5.
5.3 Interpretation of results
In this work, the determination of PFDavg of the SIS using the proposed IECξγ approach, is evaluated as follows:
3
3.4188 10 avg
PFD = ⋅ −
With regard to this PFDavg value and the normative values of the safety integrity levels (Table 1), this SIS is evaluated at a SIL 2.
A comparison of this level of integrity with those obtained by the other two approaches IEC 61508 and IECξ is presented in Table 5.
From these results, it can be seen that the IECξγ approach shows the influence of the precision brought to the level of the proof tests on the average value of PFDavg of the SIS, whereas these parameters are often neglected in practice. These results show that there is an impact on the SIL integrity level.
Compared to the PFDavg = 2.3433 · 10–4 value obtained by the IEC 61508 approach, the IECξγ approach allows a risk decrease of the order of 10.
The PFDavg = 3.4236 · 10–3 value obtained by the IECξ approach gives the same order of risk as the IECξγ approach. However, it allows for a refinement of the calculated value, which could result in a better cost ratio as well.
Therefore, the effects of the proof tests should be taken into account when conducting the accurate quantitative calculation of the safety-instrumented system performance. Table 5 Comparison of results
Approach PFDavg SIL
IECξγ 3.4188 · 10–3 2
IEC61508 2.3433 · 10–4 3
IECξ 3.4236 · 10–3 2
6 Conclusions
Proof tests are very important means to verify whether a SIS is able to perform its safety functions and to detect failures that impede the process from being safe when there is a request. However, their effectiveness is not completely controlled, which has been shown throughout this study.
After a review of the different analytical formulas for assessing SIS performance, a new model was proposed, taking into account the efficiency and performance of proof tests. This formula, referred to as the IECξγ approach is based on the IEC 61508 standard model, in which two parameters were introduced: the efficiency parameter ξ which
represents the ability of the proof test to reveal latent failures and, the parameter γ which represents the safety of the proof test.
The model was applied to a SIS and the results obtained through the study show that the proposed modeling, using the IECξγ approach, is more accurate than the IEC 61508 approach and the IECξ approach studied previously. Indeed, the impact of the precision brought to the proof tests on the average value of PFDavg of the SIS can be clearly seen by using the IECξγ model. The direct consequence has an impact on the allocation of the SIL integrity level. Compared to IEC 61508, the IECξγ approach allows a better safety with a better cost ratio compared to the IECξ approach.
References
Aggarwal, A.K., Kumar, S. and Singh, V. (2017) ‘Reliability analysis and performance optimization of the serial process in refining system of a sugar plant’, International Journal of Industrial and Systems Engineering, Vol. 26, No. 2, pp.149–181.
Asklou, N. and Noureddine, R. (2017) ‘Amélioration de l’évaluation des performances des systèmes instrumentés de sécurité par la correction des tests périodiques’, Qualita’17.
Cai, B., Liu, Y. and Fan, Q. (2016) ‘A multiphase dynamic Bayesian networks methodology for the determination of safety integrity levels’, Reliability Engineering and System Safety, Vol. 150, pp.105–115.
Catelani, M., Ciani, L. and Luongo, V. (2011) ‘A simplified procedure for the analysis of Safety Instrumented Systems in the process industry application’, Microelectronics Reliability, Vol. 51, No. 9, pp.1503–1507.
Chebila, M. and Innal, F. (2015) ‘Generalized analytical expressions for safety instrumented systems’ performance measures: PFDavg and PFH’, Journal of Loss Prevention in the Process Industries, Vol. 34, pp.167–176.
Dutuit, Y., Innal, F. and Rauzy, A. (2008) ‘Probabilistic assessments in relationship with safety integrity levels by using fault trees’, Reliability Engineering and System Safety, Vol. 93, No. 12, pp.1867–1876.
Goble, W.M. (1998) ‘Control systems safety evaluation and reliability’, ISA, ISBN# 1-55617-636-8.
Gupta, A. and Ram, M. (2018) ‘Finite difference solution to stochastic partial differential equations in reliability’, International Journal of Industrial and Systems Engineering, Vol. 28, No. 2, pp.166–177.
Iddir, O. (2015) ‘Probabilité de défaillance à la sollicitation d’une fonction instrumentée de sécurité, Management de la sécurité’, Technique de l’Ingénieur, Réf : 42154210.
IEC 61508 (2010) Functional Safety of Electrical/Electronic/Programmable Electronic Safety Related Systems, Part 1–7. International Electrotechnical Commission Std.
IEC 61511 (2003) functional Safety. Safety Instrumented Systems for the Process Industry Sector, Parts1–3, International Electrotechnical Commission Std.
Innal, F., Dutuit, Y. and Chebila, M. (2015) ‘Safety and operational integrity evaluation and design optimization of safety instrumented systems’, Reliability Engineering and System Safety, Vol. 134, pp.32–50.
ISA-TR84.00.02 (2002) ‘Safety instrumented functions (SIF) – safety integrity level (SIL) Evaluation Techniques’, Part 2: Determining the SIL of a SIF via Simplified Equations. Jin, H., Lundteigen, M.A. and Rausand M. (2013) ‘New PFH-equations for k-out-of-n: F-systems’,
Reliability Engineering and System Safety, Vol. 111, pp.112–118.
Jin, J., Pang, L., Hu, B. and Wang, X. (2016) ‘Impact of proof test interval and coverage on probability of failure of safety instrumented function’, Annals of Nuclear Energy, Vol. 87, No. 2, pp.537–540.
Jin, J., Pang, L., Zhao, S. and Hu, B. (2015) ‘Quantitative assessment of probability of failing safely for the safety instrumented system using reliability block diagram method’, Annals of Nuclear Energy, Vol. 77, pp.30–34.
Liu, Y. and Rausand, M. (2016) ‘Proof-testing strategies induced by dangerous detected failures of safety-instrumented systems’, Reliability Engineering and System Safety, Vol. 145, No. 2, pp.366–372.
Mechri, W., Simon, C., Bicking, F. and Othman, K. B. (2015) ‘Prise en compte de la performance des proof tests sur celle des systèmes instrumentés de sécurité’, 11ème Congrès International Pluridisciplinaire en Qualité, Sûreté de Fonctionnement et Développement Durable, QUALITA’15.
Rausand, M. (2014) Reliability of Safety-Critical Systems: Theory and Applications, John Wiley and Sons, Hoboken, NJ.
Signoret, J.P., Dutuit, Y., Cacheux, P.J., Folleau, C., Collas, S. and Thomas, P. (2013) ‘Make your Petri nets understandable: Reliability block diagrams driven Petri nets’, Reliability Engineering and System Safety, Vol. 113, pp.61–75.
SINTEF (2006) Reliability Prediction Methods for Safety Instrumented Systems – PDS Method Handbook, SINTEF Technology and Society.
Solfrid, H., Stein, H. and Tor, O. (2013) Reliability Data for Safety Instrumented Systems: PDS Data Handbook, SINTEF Technology and Society, ISBN: 9788253613345.
Torres-Echeverria, A., Martorell, S. and Thompson, H. (2011) ‘Modeling safety instrumented systems with MooN voting architectures addressing system reconfiguration for testing’, Reliability Engineering and System Safety, Vol. 96, No. 5, pp.545–563.
Nomenclature
IEC International Electrotechnical Commission
DC Diagnostic coverage for dangerous failures [%]
CCF Common cause failures
DCS Diagnostic coverage for safe failures [%]
EUC Equipment under control
FE Final Element
ISA Instrumentation, Systems and Automation Society KooN K out of N
LS Logic solver
MTTR Mean time to repair [h]
PFDavg Average probability of failure on demand
PFH Probability of dangerous failure per hour (average) [/h] PFS Probability of failing safely
S Sensor
SINTEF Stiftelsen for industriellogtekniskforskning STR Spurious trip rate (average)
SIF Safety integrity function SIL Safety integrity level
SIS Safety-instrumented system
Nomenclature (continued)
tCE Channel equivalent mean down time (hour) for 1oo1, 1oo2, 2oo2 and
2oo3 architectures (this is the combined down time for all the components in the channel of the subsystem)
[h]
tGE Voted group equivalent mean down time (hour) for 1oo2 and 2oo3
architectures (this is the combined down time for all the channels in the voted group)
[h]
T Proof tests interval [h]
β CCF proportion (β factor) [%]
βD β for dangerous detected (DD) failures [%]
γ Safety of the proof test [%]
λ Failure rate [/h]
λD Dangerous failure rate [/h]
λDD Dangerous detected failure rate [/h]
λCCF Dependent failure rate [/h]
λDU Dangerous undetected failure rate [/h]
λDU1 Dangerous failure rate that can be detected by proof test [/h]
λDU2 Dangerous failure rate that cannot be detected by proof test [/h]
λS Safe failure rate [/h]
λSD Safe detected failure rate [/h]
λSU Safe undetected failure rate [/h]
![Table 1 Safety integrity level (SIL) according to PFD avg and PFH SIL PFD avg PFH (/h) 1 [10 –2 ; 10 –1 ] [10 –6 ; 10 –5 ] 2 [10 –3 ; 10 –2 ] [10 –7 ; 10 –6 ] 3 [10 –4 ; 10 –3 ] [10 –8 ; 10 –7 ] 4 [10 –5 ; 10 –4 ] [10 –9 ; 10 –8 ]](https://thumb-eu.123doks.com/thumbv2/123doknet/15045021.692821/3.892.173.717.227.337/table-safety-integrity-level-sil-according-pfd-pfh.webp)