a back-colonization from the islands to the mainland.
How have anoles evolved such diverse morphologies? This is an exciting time in anole biology because recently the genome of the green anole, Anolis carolinensis, was completely sequenced (http://www.broad.mit. edu/models/anole/). The completion of an anole genome opened a new avenue of research into the genetic changes that accompany adaptive radiation. Researchers would like to know how many, and which, genes are involved in adaptive change, what is the magnitude of their effects on phenotype, and whether there is variation in those genes in existing populations on which natural selection can act. Of particular interest are the genetic changes underlying phenotypic evolution in ecologically important characteristics such as color, limb and digit
morphology, and cranial morphology. Given that anoles have convergently evolved similar morphologies, an obvious question arises...
Have similar morphologies evolved through the same kinds of genetic changes in different species? It is early days in the analysis of the genetics of adaptive radiation in anoles, but studies on the developmental genetics of limb and cranial morphology are underway. Studies of developing embryos have shown that differences in limb morphology among species are established during the earliest stages of bone formation during limb development. This is important because now we can identify genes that determine limb growth and differentiation at the stage when differences among species are established. Comparing the DNA sequences and patterns of expression of those genes among species should allow researchers to determine if similar changes in gene sequence and expression are involved in the convergent evolution of limb morphology. A similar approach is being applied to understand the genetic basis of cranial development and variation. Having the genome of Anolis carolinensis as a reference greatly facilitates the identification and mapping of genes that may be important in adaptive evolution.
Anoles are colorful animals and color and pattern play important roles in social communication and predator
avoidance. In particular, the dewlap is a colorful signal that has important roles in social communication and predator deterrence, as discussed above. As with other aspects of morphology, similar colors (both body and dewlap) have evolved repeatedly among species of anoles. Studies on the genetics of coloration are underway and genes that are known to produce pigments in other organisms are being examined within and among anole species to determine how color patterns are produced and if similar genetic mechanisms underlie similar phenotypes among distantly related species.
How else is the Anolis carolinensis genome being used? All of the comparative studies among species discussed above rely on an estimate of the evolutionary relationships among species (a phylogenetic tree). The Anolis carolinensis genome has proved a great resource from which to develop a large number of genetic markers that can be used to infer the evolutionary relationships among species. This is a massive undertaking, given the great number of anole species, but the resulting data will provide a hypothesis of relationships among species that can be used to trace the evolution of genes, phenotypes, behavior and ecology. As with nearly all such analyses, the results are likely to generate more questions than they answer and anole biology promises to be a fruitful field of research for years to come. Where can I find out more?
Losos, J.B. (2009). Lizards in an Evolutionary Tree: Ecology and Adaptive Radiation of Anoles. (Berkeley: University of California Press.) Roughgarden, J. (1995). Anolis Lizards of the
Caribbean: Ecology, Evolution, and Plate Tectonics. (Oxford: Oxford University Press.) Schneider, C.J. (2008). Exploiting genomic
resources in studies of speciation and adaptive radiation of Anolis lizards. Integr. Comp. Biol. 48, 520–526.
Schoener, T.W. (1968). The Anolis lizards of Bimini: resource partitioning in a complex fauna. Ecology 49, 704–726.
Williams, E.E. (1983). Ecomorphs, faunas, island size, and diverse end points in island radiations of Anolis. In Lizard Ecology: Studies of a Model Organism, eds. R.B. Huey, E.R. Pianka, and T.W. Schoener. (Cambridge, MA: Harvard University Press.) pp. 326–370.
Museum of Comparative Zoology and Department of Organismic and Evolutionary Biology, Harvard University, Cambridge MA 02138, USA; and Department of Biology, Boston University, Boston MA 02215, USA. E-mail: [email protected]
Dinosaurs
Michael J. BentonEvery two weeks, a new species of dinosaur is named from somewhere in the world, and the fact is reported in newspapers worldwide. This astonishing statistic makes one ask how evolutionary biologists might be able to look behind the intense public fascination to understand the real importance of the dinosaurs.
Dinosaurs were hugely successful animals that existed for over 160 million years, and in one way or another shaped the terrestrial ecosystems of the Mesozoic Era. Dinosaurs originated in the Triassic, some 230 million years ago, rising to substantial positions in terrestrial ecosystems through the Jurassic and Cretaceous, and dying out at the end of the Cretaceous 65 million years ago. Dinosaurs are divided into several major groups (Figure 1) that came and went variously through their long existence, and these groups may track changing aspects of their environment.
Dinosaurs arose in the Middle or Late Triassic from among the archosaurs, the wider group that includes birds and crocodilians today. The Archosauria split into the Crurotarsi (the ‘crocodile line’) and the Avemetatarsalia or Ornithodira (the ‘bird line’), and these two groups continued through the Triassic at equal levels of diversity. Basal avemetatarsalians were all bipedal and small, and they branched into the flying pterosaurs and the ground-based dinosauromorphs. One or two intriguing little dinosauromorphs from the Middle and Late Triassic show us that the first dinosaurs were less than 1 metre long, bipedal, and flesh eating. Quadrupedalism evolved independently several times among dinosaurs, presumably as their body masses increased.
The fundamental split of dinosaurs into Saurischia and Ornithischia occurred soon after their origin (Figures 1 and 2). Saurischians retain the generalised reptilian hip bones, and they share several unique features of the skull and forelimb. This clade includes the long-necked, plant-eating sauropodomorphs, sometimes divided into prosauropods (Late Triassic to
prosauropod dinosaurs rose markedly in diversity and hugely in abundance, but not a great deal in disparity. Indeed, dinosaur disparity remained lower than that of crurotarsans, their key supposed competitors. After the extinction of most crurotarsans, at the end of the Triassic, 200 million years ago, theropod dinosaurs radiated (overall diversity and abundance increased), but disparity increased only a little more. So it seems that dinosaurs radiated fast into empty ecospace, and were lucky twice, but they seemingly did not outcompete their precursors. Perhaps there are lessons here for our understanding of all such major biotic replacements through the history of life, and also for terms such as ‘success’, ‘competition’ and ‘progress’ in a macroevolutionary context.
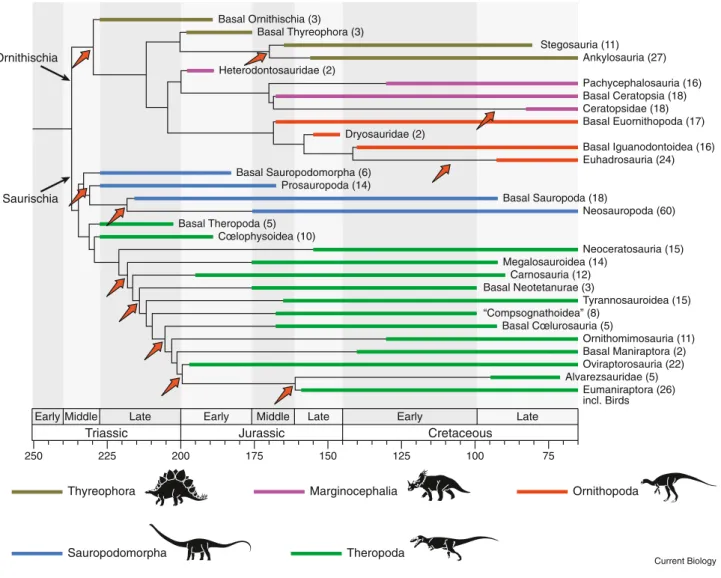
As for the subsequent 160 million years of dinosaurian evolution, a substantial numerical study has shed some light. Based on a supertree of dinosaurs (Figure 2), there are 11 statistically significant diversification shifts, each corresponding to an unexpected proliferation of species. Early Jurassic) and sauropods (Late
Triassic to Late Cretaceous). The sauropods include all the real giants, such as Diplodocus and Brachiosaurus, and were especially important in the Late Jurassic. The prosauropods include small to large plant-eaters, all with long necks, but many of the smaller ones still standing and running on their hind legs.
The other saurischian clade, the Theropoda, was immensely diverse. It includes all the flesh-eaters, from tiny Compsognathus, the size of a turkey, to giants such as Tyrannosaurus, five tonnes in mass and still bipedal. In the Late Jurassic and Cretaceous, theropods diversified hugely, giving rise to ostrich-like toothless forms (ornithomimosaurs), giant ground sloth-like plant-eaters (therizinosaurs), birds, long-snouted fish-eaters (spinosaurids), and truly giant hunters (carcharodontosaurids, tyrannosaurids).
The ornithischians split into the armoured thyreophorans, including the stegosaurs, with plates and spikes down their backs, and the ankylosaurs, with bony armour over the backs, bellies, and heads, and the unarmoured cerapodans, including the bipedal ornithopods such as Iguanodon and the duckbilled hadrosaurs, especially important herbivores in the Cretaceous, the horned-faced ceratopsians such as Triceratops of the Late Cretaceous, and the thick-headed pachycephalosaurs, also important in the Late Cretaceous.
This narrative of dinosaurian diversity and history does not, however,
offer insights into the patterns and processes of their evolution. New numerical studies have shed some light on these broader issues.
Dinosaurian success (and extinction) Dinosaurs provide an excellent model to assess ideas about large- scale evolution. Ever since Darwin, leading evolutionists have tussled with notions of progress and success. Natural selection ensures survival of the fittest, and surely this feeds up to larger-scale clade replacements? Indeed, until the 1980s, the initial diversification of the dinosaurs was seen as evidence for their greater competitive abilities when compared to precursor groups, so too was their demise at one time attributed to competition with the superior mammals. It is worth exploring the
three phases of dinosaurian evolution: origin, diversifications, and extinction.
Paleontologists have proposed two basic models to describe the early period of dinosaur evolution: the ‘competitive’ and ‘opportunistic’ models. The first holds that there was something inherently special about dinosaurs — perhaps warm- blooded metabolism or upright and fast locomotion — which enabled them to outcompete other reptile groups that lived during the Late Triassic. The second model posits that dinosaurs weathered one or several mass extinctions, which knocked out other Triassic vertebrates. In this view, there was nothing particularly special about dinosaurs, only that they were able to weather the storm during periods of intense environmental trauma.
Studies of diversity (numbers of taxa worldwide), abundance (numbers in ecosystems) and disparity (range of form and adaptation) of the early dinosaurs show a complex pattern, but support the opportunistic model. Key herbivore groups died out some 225 million years ago, and herbivorous Figure 1. The three major dinosaurian groups.
Ornithischians, represented by Camptosaurus (A), theropods, represented by Allosaurus (B), and sauropodomorphs, represented by Camarosaurus (C). These three genera lived together in Morrison Formation times (Late Jurassic) in North America. (Courtesy of Paul Sereno and Carol Abraczinskas.)
These events are concentrated in the first third of dinosaur history, particularly in the Late Triassic and Early Jurassic. Dinosaurs continued radiating through the Late Jurassic and Cretaceous, and many remarkable new groups appeared, but their diversification rate rarely exceeded the expectations of a random walk. This is particularly significant in the light of other major events on land. There was a substantial remodeling of terrestrial ecosystems during the Early Cretaceous, termed the Cretaceous Terrestrial Revolution, when the flowering plants (angiosperms) appeared and radiated dramatically. Their radiation led to massive expansions in diversity of leaf-eating insects, social insects
such as termites, ants and bees, lizards, snakes, and early mammals. Dinosaurs carried on at their normal rate of evolution, and it seems they did not particularly exploit the new food sources and opportunities.
It would be wrong though to imply that dinosaurs were doomed to extinction; their rate of diversification in the Cretaceous was healthy, but not spectacular. Indeed, there is now strong evidence that the dinosaurs died out as a result of a major
meteorite impact on the Earth, and yet somehow they are still said to have been declining for many millions of years before their final disappearance. Numerical studies of Late Cretaceous dinosaurs show categorically that dinosaurian diversity was either level
right to the end, or even increasing, and this result obtains whether the studies are global or regional in scale, and involving various correction factors. The end of the dinosaurs then must be associated with a huge crater at Chicxulub, on the Yucatán Peninsula. There a meteorite, perhaps 10 km across, struck the proto-Caribbean, and excavated a crater some 180 km across. Apart from regional indignities, a vast cloud of dust was lofted high into the atmosphere and surrounded the Earth, blacking out the sun, preventing photosynthesis and causing freezing for several weeks or months. This could have been enough to remove plant productivity from marine and terrestrial ecosystems, and so cause
75 100 125 150 175 200 225 250 Late Early Late Middle
Middle Late Early
Early
Triassic Jurassic Cretaceous
Alvarezsauridae (5) Basal Cœlurosauria (5) “Compsognathoidea” (8) Basal Neotetanurae (3)Carnosauria (12)
Megalosauroidea (14) Basal Theropoda (5) Cœlophysoidea (10) Basal Sauropoda (18) Basal Sauropodomorpha (6) Prosauropoda (14) Dryosauridae (2) Heterodontosauridae (2) Eumaniraptora (26) incl. Birds Oviraptorosauria (22) Basal Maniraptora (2) Ornithomimosauria (11) Tyrannosauroidea (15) Neoceratosauria (15) Neosauropoda (60) Euhadrosauria (24) Basal Iguanodontoidea (16) Basal Euornithopoda (17) Ceratopsidae (18) Basal Ceratopsia (18) Pachycephalosauria (16) Ankylosauria (27) Stegosauria (11) Basal Thyreophora (3) Basal Ornithischia (3)
Thyreophora Marginocephalia Ornithopoda
Sauropodomorpha Theropoda Saurischia
Ornithischia
Current Biology Figure 2. Phylogeny of the dinosaurs.
This diagram shows a simplified outline of dinosaurian relationships based on several cycles of cladistic analyses and revisions, and summarized from a supertree of 420 of the 550 or so currently valid dinosaurian species. Major groups are plotted against time, highlighting the known fossil record (thick line) and inferred earlier unknown record (‘ghost range’). Numbers of species included in the supertree are indicated for each clade. Red arrows indicate 11 statistically significant diversification shifts. A full-scale version of the 2008 dinosaur supertree may be seen at http://palaeo.gly.bris.ac.uk/macro/supertree/. (Based on Lloyd et al. (2008), and drafted by Simon Powell.)
microscope (Figure 3). Fossil bone is often preserved to cellular detail, and thin slices may be compared with modern bone. Dinosaurs have highly vascular bone, very like that of mammals, but quite unlike the bone of lizards and other living reptiles. In juveniles, the bone grew rapidly, producing a fibrolamellar structure, full of blood vessels in life, and as growth slowed at sexual maturity, the bone structure became more compact in the outer regions. Lines of arrested growth may also be identified in dinosaur bones; these are equivalent to tree rings and document times of low food supply (probably winter). The lines of arrested growth give a rough estimate of a dinosaur’s age, although many measurements are taken in case there is not an exact annual equivalence. Such studies show clearly that dinosaurs were fast growers, reaching adult size in only a few years. Even the sauropods grew at rates more equivalent to whales than to crocodilians, growing from a
the demise of consumers, especially larger animals, and those that could not burrow or hibernate.
Dinosaurs as models
Dinosaurs have attracted attention because they were huge. This attribute gives them great importance in studies of functional biology because they explore limits of physiology and biomechanics that have never been seen among living animals, especially not among mammals or birds.
The large size of dinosaurs has always amazed us; there were turkey-sized dinosaurs, but the distribution of dinosaurian body sizes is an order of magnitude larger than the distribution of mammalian body sizes today. Some explanations for the large size of dinosaurs rather missed the point: perhaps the world was different then (higher oxygen levels, lower gravity) or perhaps dinosaurs lived underwater. In fact, none of these is likely, so in a world that was not so different from ours it is intriguing to seek to understand dinosaurian biology.
Serious consideration of this theme began in the 1970s, when Bob Bakker proposed that dinosaurs might have been fully endothermic. Initially the debate was rather unsatisfactory as the proponents on each side wielded clever ideas and observations that tended to support one view or the other, but none was decisive. Indeed, many suggested that we will never know about the physiology of dinosaurs, and so it isn’t worth investigating. This was nicely expressed in the famous Gary Larson cartoon that shows an earnest scientist, with a time machine in the background and a huge thermometer in his hands, approaching the rear end of a Diplodocus: ‘An instant later, both Professor Waxman and his time machine are obliterated, leaving the cold-blooded/warm-blooded dinosaur debate still unresolved’.
Since 1970, three lines of research on dinosaurian physiology and function have proved immensely fruitful. First came bone histology, the study of cross sections of bone under the
Maximum growth rate = 5466 kg yr 30,000 25,000 20,000 15,000 10,000 5,000 0 0 5 10 15 20 Age (years) Mass (kg) A B –1 Current Biology Figure 3. Measuring the growth rate of a sauropod dinosaur.
(A) Cross-section through the bone wall of the femur of the sauropod Janenschia from the Late Jurassic of Tanzania; the animal was full grown, and the femur was 1.27 m long. The section was made by drilling into the bone and extracting a core that was then cut through; the centre of the bone is to the left, the outside to the right. Lines of arrested growth (LAGs) are the darker bands, where the bone structure is tighter, indicating slow-down in growth. These are marked off with tick marks on the side of the slide. (B) Growth curve for the sauropod Apatosaurus based on sections from the limb bones and ribs of sev-eral individuals, juveniles and adults, show-ing how the animal reached adult size with a spurt of growth from years 5–12. (Courtesy of Martin Sander and Greg Erickson.)
B
E F G
GRF
Early stance Mid-stance Muscle moment Late stance Knee moment arm Stance phase Swing phase
{
C D
A
Current Biology Figure 4. The running stride of Tyrannosaurus rex.
(A) The main components of a stride, showing the stance phase when the foot touches the ground, and the swing phase. (B–D) Three positions of the limb in early stance, mid-stance and late stance, as the body moves forward, and showing the main forces, including the ground reac-tion force (GRF). (E–G) Three alternative postures for the limb, with the body held high or low. More information, and computer-generated animations, may be seen at http://www.rvc.ac.uk/Abou-tUs/Staff/jhutchinson/ResearchInterests/beyond/Index.cfm. (Courtesy of John Hutchinson.)
10 kg hatchling to a 10 tonne adult in 10–15 years, rather than 100. Such fast growth in dinosaurs probably implies a form of endothermy, at least when they were young, and with a seamless switch to a lower-input form of inertial homeothermy when they reached large size. The recent discovery of numerous species of theropod dinosaurs with feathers, from the Jehol biotas in China, has confirmed that birds are dinosaurs, and theropod dinosaurs at least had evolved feathers as insulation long before flight was attempted.
The second theme in studies of dinosaurian biology is locomotion. Postulated endothermy in dinosaurs implies rapid gaits. However, this was not confirmed from studies of fossil trackways. Knowing the estimated leg length of a dinosaur track-maker allows an easy calculation of its
running speed; and these calculated running speeds were generally no faster than 20–30 km/h. Enthusiasts for dinosaurian endothermy argue that in reality dinosaurs hurtled around at ostrich-like speeds (60 km/h), but they slowed down when they crossed a field of gloop, the typical site of preservation of fossil tracks. Others urge caution, and mechanical studies of dinosaur skeletons have shown that indeed they mostly moved at a comfortable amble (Figure 4).
A dinosaur like Tyrannosaurus, weighing at least 6 tonnes, could not have exceeded 40 km/h; it would have required thigh muscles relatively as large as those of a chicken, and this would have scaled to 99% of its body mass. Kinetic studies of dinosaurian locomotion have also focused on the position of the limbs and the exact limb
cycle. These studies have highlighted the range of possible postures, and different computer-based approaches that use a variety of biomechanical algorithms are tested against living bipeds, such as ostriches or humans. If the predictions for living organisms match reality, then perhaps the predictions for dinosaurs can be accepted. Interestingly, independent computing-intensive analyses of the locomotion of dinosaurs have all converged on the same models of locomotion, and those models ‘look right’. The dinosaur stands tall and the limbs move smoothly, but if he runs too fast he falls over.
A third theme is feeding. Endothermy would imply that dinosaurs had to consume huge amounts. At human sizes, there is a ten-fold differential between the food requirements of an endotherm and an ectotherm, but at larger sizes the figures converge. But it always seemed implausible that large dinosaurs, particularly sauropods, had to eat unnutritious ferns and cycads at elephant-like rates and pass all that food through their tiny heads and narrow necks. Some estimates suggest that an endothermic 40-tonne sauropod would have had to eat a tonne or more a day, three times as much as an ectotherm of the same mass would have had to eat. There would also be severe problems of heat dissipation from a massive dinosaur in the warm conditions of the Jurassic and Cretaceous. Homeothermic ectothermy in adult sauropods meant that they did not have to eat so much, and they used their body mass to maintain a stable temperature.
New biomechanical approaches to dinosaurian function have also elucidated aspects of feeding mechanics. Finite element analysis is a modelling approach that allows engineers to calculate stresses and strains on buildings. The method has been adapted to study skeletons of living and extinct organisms: a three-dimensional scanned model of the limb bone or skull is converted to a mesh of cells, and forces are applied. Knowing the physical properties of modern bone, and transferring these to the dinosaurian model, it has been possible to establish why some dinosaur skulls adopted particular shapes, the function of particular struts and openings, as well as some aspects of feeding. Maximum bite Figure 5. The skull of Tyrannosaurus rex and feeding stresses.
(A) Skull in left lateral view, showing major bones and openings: aof, antorbital fenestra; en, external naris; j, jugal; l, lacrimal; ltf, lower temporal fenestra; m, maxilla, n, nasals; or, orbit; p, premaxilla; po, postorbital; pt, pterygoid; q, quadrate; qj, quadratojugal; sq, squamosal. Scale bar 10 cm. (B) Stress in the fused finite element skull model generated by vertical biting, and showing the principal stress 3 [P3], compressive stress; convergent arrows indicate orientation of compressive stress trajectories. Units are Pa or Nm-2. (Courtesy of Emily Rayfield.)
force in flesh-eating dinosaurs may be estimated by ratcheting up the assumed forces applied at points along the tooth row: these studies confirm estimates that Tyrannosaurus bit with a point force of 13,000 Newtons at its longest teeth, and the skull, although superficially lightly connected, could readily withstand tearing forces as it yanked off great chunks of flesh from its prey (Figure 5).
Dinosaurs were large, and their secret seems to have been a combination of abundant small juveniles (dinosaur nests contain 8–50 eggs; juvenile body size was constrained by maximum egg size), rapid growth to sexual maturity in 5–15 years, and variable physiology (switching from full endothermy to inertial homeothermy). Modern reptiles cannot match the rapid growth rates seen in dinosaurs, and modern birds and mammals are committed to endothermy and so cannot enjoy the benefits of switching it off at large body size. Future biological studies of dinosaurs may focus on their population structures and energy pathways in Jurassic ecosystems as we seek to understand how these astonishing animals retained their key position on Earth for so long.
Further reading
Benton, M.J. (2008). Fossil quality and naming dinosaurs. Biol. Lett. 4, 729–732.
Brusatte, S.L., Benton, M.J., Ruta, M., and Lloyd, G.T. (2008). Superiority, competition, and opportunism in the evolutionary radiation of dinosaurs. Science 321, 1485–1488.
Erickson, G.M., Rogers, K.C., and Yerby, S.A. (2001) Dinosaurian growth patterns and rapid avian growth rates. Nature 412, 429–432.
Farlow, J.O., and Brett-Surman, M.K. (eds) (1997). The Complete Dinosaur (Bloomington: Univ. of Indiana Press).
Fastovsky, D.E., and Weishampel, D.B. (2009). Dinosaurs: A Concise Natural History (Cambridge: Univ. of Cambridge Press). Lloyd, G.T., Davis, K.E., Pisani, D., Tarver, J.E.,
Ruta, M., Sakamoto, M., Hone, D.W.E., Jennings, R., and Benton, M.J. (2008). Dinosaurs and the Cretaceous Terrestrial Revolution. Proc. R. Soc. Lond. B 275, 2483–2490.
Rayfield, E.J. (2004). Cranial mechanics and feeding in Tyrannosaurus rex. Proc. R. Soc. Lond. B 271, 1451–1459.
Sander, P.M. (2000). Long bone histology of the Tendaguru sauropods: Implications for growth and biology. Paleobiology 26, 466–488. Sander, P.M., and Clauss, M. (2008). Sauropod
gigantism. Science 232, 200–201.
Seebacher, F. (2003). Dinosaur body temperatures: The occurrence of endothermy and ectothermy. Paleobiology 29, 105–122.
Sereno, P.C. (1999). The evolution of dinosaurs. Science 284, 2137–2147.
Weishampel, D.B., Dodson, P., and Osmólska, H. (eds) (2004). The Dinosauria (2nd edn) (Berkeley:
Univ. of California Press).
Department of Earth Sciences, University of Bristol, Bristol BS8 1RJ, UK.
E-mail: [email protected]
changes the signals that are averaged between the contours. Figure 1B shows color matching data from three observers, using the same procedure as in Figure 1A (see also Experiment 1 in the Supplemental Data). The perceived afterimage color depended on the adapting colors that lay on both sides of the subsequent test outline; the colors inside the test outline induced an afterimage in the complementary color, whereas the colors outside the test outline induced an afterimage color similar to the inducing colors, because of contrast induction [2]. Both effects were confirmed in a second experiment, using adapting stimuli with a broader range of equiluminant colors (see Experiment 2 in the Supplemental Data). In this color judgement experiment (15 observers), there were adapting stimuli with just one color that could either be included or excluded by the subsequent test outline, as well as stimuli with two different colors, balanced with regard to the position of the test outlines (as in Experiment 1). For the various color combinations, the results revealed mixed afterimage colors, but also showed that the colors inside the subsequent test outline have a dominant influence on the perceived afterimage.
Our results show that afterimage colors may spread to previously uncolored areas, triggered and constrained by contours presented after the colored image. In the past decades, similar color–contour interactions have also been reported for filling-in phenomena with ‘real’ colors like the neon-color effect or the watercolor illusion [3,4]. It is commonly believed that such color filling-in phenomena are generated by neural circuitry that also process normal color perception, where early cortical areas are thought to fill-in colors by means of a contour-based filling-in mechanism [4,5]. To date, however, a full explanatory account of filling-in effects still has to be given [4–10]. Our results with afterimages indicate that cortical color filling-in processes are also involved when incoming signals are caused by adaptation of retinal receptors. Given the similarities between ‘real-color’ filling-in and afterimage color filling- in, a common underlying mechanism for these effects seems plausible as well. For example, the same
Filling-in afterimage
colors between
the lines
Rob van Lier1, Mark Vergeer1, and Stuart Anstis2
It is known that when a colored surface is viewed for some time and a blank screen is presented afterwards, an afterimage can be perceived in the complementary color. Color appearances in afterimages are due to adaptation of retinal cones and they are especially vivid when contours, presented after the adapting image, coincide with the blurred edges of the afterimage [1]. We report here that one and the same colored stimulus can induce multiple, differently colored afterimages, and that colored afterimages can also be perceived at regions that were not adapted to color. The observed filling-in of afterimage colors strongly depends on contours presented after the colored stimulus, revealing color– contour interactions that resemble filling-in of ‘real’ colors.
We measured the effect of contours on the filling-in of afterimage colors by adapting to star-like shapes that comprised red and cyan colored quadrilateral spikes attached to a grey central area (Figure 1A). This adapting star alternated over time with different achromatic test outlines. These test outlines were positioned either to include the red spikes and exclude the cyan spikes of the adapting star, or vice versa. The afterimage-color, which appeared to be tinged with red or cyan, filled in the outlined area, even within the grey central area that was never colored (see Movie S1 in the Supplemental Data). Moreover, when both test outlines were presented in succession (as indicated in Figure 1A), the color of the afterimage switched rapidly (see Movies S2A/B in the Supplemental Data). That is, multiple colored afterimages were perceived in the central area of the test outline, following one and the same adapting stimulus.
Apparently, the shift of contours presented after the colored stimulus