Steady-state evoked potentials distinguish brain mechanisms of
self-paced versus synchronization
finger tapping
Michael De Pretto
a,b,c,⁎, Marie-Pierre Deiber
d,e, Clara E. James
a,faFaculty of Psychology and Educational Sciences, Department of Psychology, University of Geneva, 40 Boulevard du Pont-d’Arve, CH-1211 Geneva,
Switzerland
bNeurology Unit, Medicine Department, Faculty of Sciences, University of Fribourg, Chemin du Musée 5, CH-1700 Fribourg, Switzerland
cSchool of Philosophy, Psychology and Language Sciences, Department of Psychology, University of Edinburgh, 7 George Square, Edinburgh EH8 9JZ,
UK
dPsychiatry Department, Division of Psychiatric Specialties, University Hospitals of Geneva, 20 bis rue de Lausanne, CH-1201 Geneva, Switzerland
eNCCR Synapsy, 9 Chemin des Mines, CH-1202 Geneva, Switzerland
fSchool of Health Sciences Geneva, HES-SO University of Applied Sciences and Arts Western Switzerland, 47 Avenue de Champel, CH-1206 Geneva,
Switzerland
A R T I C L E I N F O
Keywords: Beat processing Left inferior frontal gyrus Inferior parietal lobule Event-based timing Emergent timing EEG source estimation
A B S T R A C T
Sensorimotor synchronization (SMS) requires aligning motor actions to external events and re-presents a core part of both musical and dance performances. In the current study, to isolate the brain mechanisms involved in synchronizingfinger tapping with a musical beat, we compared SMS to pure self-pacedfinger tapping and listen-only conditions at different tempi. We analyzed EEG data using frequency domain steady-state evoked potentials (SSEPs) to identify sustained electrophysiological brain activity during repetitive tasks. Behavioral results revealed different timing modes between SMS and self-pacedfinger tapping, associated with distinct scalp topo-graphies, thus suggesting different underlying brain sources. After subtraction of the listen-only brain activity, SMS was compared to self-pacedfinger tapping. Resulting source estimations showed stronger activation of the left inferior frontal gyrus during SMS, and stronger activation of the bilateral inferior parietal lobule during self-pacedfinger tapping. These results point to the left inferior frontal gyrus as a pivot for perception–action coupling. We discuss our findings in the context of the ongoing debate about SSEPs interpretation given the variety of brain events contributing to SSEPs and similar EEG frequency responses.
1. Introduction
Sensorimotor synchronization (SMS) refers to the act of synchronizing motor actions with external events such as auditory beats (seeRepp, 2005; Repp & Su, 2013for exhaustive reviews). Neuroimaging studies of beat processing reported combined cortical activation of the pre-supplementary and supplementary motor areas (pre-SMA/SMA), premotor cortex (PMC), inferior frontal gyrus (IFG), and superior temporal gyrus (STG) in detecting and synchronizing with the beat (e.g.Chen, Penhune, & Zatorre, 2008; De Pretto & James, 2015; Grahn & McAuley, 2009; Kung, Chen, Zatorre, & Penhune, 2013). Motor areas also responded during pure perceptual tasks in both musicians and non-musicians (e.g.Bengtsson et al., 2009; Chen et al., 2008; Grahn & Brett, 2007; James, Michel, Britz, Vuilleumier, & Hauert, 2012; Teki, Grube, Kumar, & Griffiths, 2011), suggesting a strong inclination of the motor
⁎Corresponding author at: University of Fribourg, Chemin du Musée 5, 1700 Fribourg, Switzerland. E-mail address:[email protected](M. De Pretto).
http://doc.rero.ch
Published in "Human Movement Science 61(): 151–166, 2018"
which should be cited to refer to this work.
system to respond to rhythmic events. Thus, comparing SMS to self-pacedfinger tapping is crucial to isolate the brain mechanisms involved in auditory-motor coupling.
Compared to rest, self-pacedfinger tapping involved the pre-supplementary motor area (pre-SMA), left primary sensorimotor cortex, and left middle cingulate motor area (Kawashima et al., 1999). However, neuroimaging studies yielded contrasting results when comparing SMS to a continuation phase, where participants had to continue tapping at the same tempo after the stimulus was turned off (e.g.Bijsterbosch et al., 2011; Jantzen, Oullier, Marshall, Steinberg, & Kelso, 2007; Jantzen, Steinberg, & Kelso, 2004; Rao et al., 1997).Jantzen et al. (2004, 2007)showed that brain activation differences during on-beat synchronization versus off-beat (syncopated)finger tapping persisted during the continuation phase. These results indicate that the cognitive resources engaged during continuation depended on the previous context, suggesting that self-pacedfinger tapping performance might be influenced by a previously heard metronome. Thus, the synchronization-continuation paradigm might not be well suited for the evaluation of spontaneous self-paced rhythm production.
Here, we used EEG steady-state evoked potentials (SSEPs;Regan, 1989)– frequency domain representations of stable neural responses to a periodic stimulus– to compare the brain electrophysiological responses to spontaneous self-paced finger tapping, SMS, and passive beat perception. SSEP analysis provides a powerful tool to study modulations of brain activity without the need to isolate specific events and is therefore especially adapted to the study of sustained rhythmic tasks (Zhou, Melloni, Poeppel, & Ding, 2016). In recent years, an increasing number of studies analyzed the neural correlates of beat processing using SSEPs (e.g.; Celma-Miralles, de Menezes, & Toro, 2016; Nozaradan, Peretz, Missal, & Mouraux, 2011; Nozaradan, Zerouali, Peretz, & Mouraux, 2015; Stupacher, Witte, Hove, & Wood, 2016; Stupacher, Wood, & Witte, 2017; Tierney & Kraus, 2014), suggesting direct entrainment of neural oscillations to the frequency of the beat. However, SSEP often reflect complex waveforms aligned on the interonset interval (IOI) and repeating over time, rather than pure sinewave oscillations (Regan, 1989; Zhou et al., 2016). Pure neural oscillations at the frequency of the beat will show power spectra peaks restricted to the frequency of the oscillation (F0), whereas complex waveforms will also show peaks at higher-order harmonics (integer multiples of the stimulus’ frequency; H1, H2, etc.). Indeed, Fourier transform is a mathematical conversion from time to frequency domain. The resulting power spectra do not report the exact oscillatory content of the analyzed signal, but rather the frequencies necessary to reconstruct that signal (Luck, 2014).
Additionally, transient event-related potentials (ERPs), such as auditory evoked potentials in response to the perceived beats, might induce peaks in the power spectra at the frequency of the beat and/or at its higher-order harmonics depending on the tempo (Zhou et al., 2016). Transient ERPs are discrete waveforms, not taking advantage of the repetition of the events to which they are related (Regan, 1989), in contrast to SSEPs. At faster tempi, the rapid succession of events will prevent the brain mechanisms to return to resting state between each repetition, resulting in power spectra peaks at F0. At slow tempi, transient ERPs are less likely to induce peaks at the frequency of the stimuli and will rather increase power at higher-order harmonics.
Thus, the effect of event-related potentials on the resulting power spectra has to be taken into account when designing a study, analyzing the data, and interpreting the results. To cancel out overlap between SSEPs and transient ERPs, the tasks were performed at three different tempi. Additionally, by performing scalp topography analysis and computing source estimations, we were able to evaluate whether the observed SSEPs relied on distinct brain mechanisms and identify potential brain sources specifically involved in auditory-motor coupling.
Previous SSEP studies of beat processing showed that synchronizingfinger taps to every other beat resulted in increased SSEP peak amplitude at the frequency of the tapping, centered at electrodes above the contralateral primary motor area (Nozaradan et al., 2015).Tierney and Kraus (2014)showed that top-down processes may modulate frequency peak amplitudes. Listening to musical excerpts with added emphasis on thefirst beat of the metrical grid (strong beat) induced strong SSEP peaks at the frequency of the beat (F0) and at itsfirst harmonic (H1; i.e., twice the stimulus’ frequency). If the second beat of the metrical grid (weak beat) was accentuated, the power spectra showed a peak at F0 only. According to the authors, this may reflect reduced attention to the metrical grid when accents occurred on the weak beat. Similarly, studies in the visual domain showed that peaks at H1 increased when participants paid attention to the stimuli (Kim, Grabowecky, Paller, & Suzuki, 2010) and were associated with different brain sources than at F0 (Heinrichs-Graham & Wilson, 2012; Pastor, Valencia, Artieda, Alegre, & Masdeu, 2007).
Our original paradigm allowed investigating SMS and its basic components, namely, beat perception andfinger tapping. First, at the behavioral level, we hypothesized greater stability of tapping during SMS than during self-paced finger tapping, due to the presence of the metronome (Semjen, Schulze, & Vorberg, 2000), and at relatively fast tempi. Indeed, the estimation of the intervals is more difficult at slower tempi (Lewis & Miall, 2003; Madison, 2001). Second, we hypothesized that auditory-motor coupling during sensorimotor synchronization would induce SSEPs reflecting more than the sum of auditory and movement-related brain activity. We expected associated activations within pre-SMA/SMA, PMC, IFG and STG. Third, we hypothesized stronger brain activity associated to H1 when the attentional demands of the tasks increased, that is, during SMS compared to passive listening, and at slower tempi. Based on previousfindings, we expected associated source estimations within the inferior parietal lobule (Bolger, Coull, & Schön, 2013; Konoike et al., 2012; Rao, Mayer, & Harrington, 2001) and/or middle/posterior cingulate gyrus (Leech & Sharp, 2014; Vogt, 2009).
2. Material and methods 2.1. Participants
Sixteen right-handed young adults (8 women; Mean age = 27.7 years; SD: 3.3 years), without any history of neurological or psychiatric illness, participated in the study. Six of them had never received extracurricular musical education. Of the eight who had
learned to play an instrument, six had abandoned practicing more than 4 years before participating in the study, and two were still playing (one piano and one guitar) on an occasional basis (< 1 h per week). They all provided informed consent. The procedure was approved by the local ethics committee and the experiment was conducted in agreement with the University of Geneva guidelines and the ethical standards of the declaration of Helsinki. Two participants were excluded from the analyses, one because of a technical problem during recording, the other because of tapping coefficient of variation over two standard deviations above the mean in five of the six tapping conditions. Thus, the data of 14 participants were further processed (7 women; Mean age = 27.7 years; SD: 3.1 years).
2.2. Tasks and stimuli
The participants performed three rhythmic tasks at three different tempi. They either produced self-paced finger tapping (SP task), sensorimotor synchronization with a metronome (SMS task), or simply listened to the metronome (listen-only, LO task). The intermediate tempo corresponded to the participants’ spontaneous motor tempo (SMT tempo), in other words, the tempo at which each individual spontaneously produces self-pacedfinger tapping. They were also asked to produce a faster tempo (FA) and a slower tempo (SL) as detailed in the Procedure section. During the synchronization conditions, the tempo of the metronome corresponded to the tapping speed of the self-paced condition. Thus, each participant completed nine conditions: three self-paced conditions (SPSMT,
SPFA, SPSL), three synchronization conditions (SMSSMT, SMSFA, SMSSL), and three listen-only conditions (LOSMT, LOFA, LOSL).
During the tapping tasks, the participants tapped with their right indexfinger on a response button (see Procedure section). The metronome sounds consisted of 500 Hz sine wave tones of 80 ms duration, emitted through loudspeakers at a level that the parti-cipant judged comfortable.
2.3. Procedure
After positioning the EEG cap and electrodes, the participants sat comfortably in a shielded room. They were instructed to minimize movements, muscle tension and eye blinks while executing the tasks. The response button was on a joystick positioned horizontally and adjustable in height, so that the participants could keep their arms as relaxed as possible, alongside their body. The screen displayed the instruction before the start of each condition, and turned black during execution of the task. Afixation point on top of the screen helped the participants to stabilize their gaze. Stimuli were presented and responses recorded using Presentation experimental software (version 12.2, Neurobehavioral System).
Thefirst condition recorded was always SPSMTto set the spontaneous motor tempo, followed by SPFAand SPSLin balanced order.
For half the participants, the synchronization conditions (SMSFA, SMSSMT, and SMSSL, in a balanced order) came next, followed by the
listen-only conditions (LOFA, LOSMT, and LOSL, in a balanced order). The other half did the listen-only conditions before the
syn-chronization ones. Each condition was divided into three blocks of 40 intertap intervals (ITI or IOIs in the LO conditions). Thus, for each condition, 120 ITIs/IOIs were recorded. The participants performed all three blocks of each condition in a row to ensure that they produced the same tempo in each block.
Before recording, the experimenter explained the task to the participants. For the SPSMTcondition, they were asked to tap at their
most natural pace, at a frequency they could maintain without mental effort and for a long period of time. For the SPFAand SPSL
conditions, they were asked to tap at a significantly faster rate but not too fast, or at a significantly slower rate but not too slow. They were aware that they would have to synchronize at these frequencies later on and thus, the experimenter warned them that these faster and slower tempi shouldfit in a range where synchronization was possible. For the LO conditions, participants received the instruction not to move while listening to the beat. A webcam allowed on-line screening of overt movements. All participants satisfactorily followed this instruction.
2.4. EEG data acquisition and preprocessing
The EEG signal was continuously acquired from 64 active Ag–AgCl electrodes (BioSemi Active-Two, V.O.F., Amsterdam, the Netherlands) equally distributed over the scalp, with a sampling rate of 2048 Hz and impedances kept below 50 kΩ. Offline pre-processing was performed using the Matlab toolbox EEGlab (http://sccn.ucsd.edu) and the Cartool software by Denis Brunet (cartoolcommunity.unige.ch).
First, the EEG data were imported into EEGlab, downsampled to 1024 Hz andfiltered with a 0.1 Hz FIR high-pass filter. Then, we removed eye blinks from the EEG signal through an ICA procedure. In Cartool, electrodes with excessive noise were interpolated using a 3D spherical spline algorithm (mean: 2.5% of interpolated electrodes;Perrin, Pernier, Bertnard, Giard, & Echallier, 1987), and the data were recalculated against the average reference.
The data were then processed as a function of the comparisons of interest (SMS vs LO and SMS vs SP, see following sub-chapters andFig. 1). For all behavioral and EEG analysis, thefirst three intervals of each block were discarded as several taps are necessary to adjust thefinger tapping to the beat (Repp, 2005). The last interval was also removed as the script interrupted the presentation of the stimuli at the 41st tap, preventing the presentation of the last metronome tone in the SMS conditions when the tap preceded the tone. 2.4.1. SMS versus LO
Each condition was divided into nine epochs (three per block) of twelve metronome inter-onset intervals. After averaging these epochs to reduce non-stimulus locked oscillations, a Fast Fourier Transform Approximation (FFTA) was applied. The FFTA is an
equivalent to the classical Fast Fourier Transform (FFT) that transfers the FFT power of each electrode into a sine–cosine space and uses the bestfitting line of the plotted data as a reference to implement polarity in the output, necessary for source estimation (Lehmann & Michel, 1990). The resolution of the FFTA (as for the classical FFT) is calculated as the inverse of the period duration. Here, the period duration was equal to twelve beats, yielding a power spectra resolution of 1/12th of the beat frequency. 2.4.2. SMS versus SP
The preprocessing steps followed the procedure used in the comparison between SMS and LO. However, for the SMS versus SP comparison, each condition was divided into 18 epochs (six per block) of six ITIs. Thus, after averaging these epochs to reduce non-tapping locked oscillations, the FFTA yielded a power spectra resolution of 1/6th of the non-tapping frequency. This lower resolution compared to the SMS versus LO comparison compensated the tapping variability (see Results section below). Indeed, to reconstruct the original signal, FFT (and FFTA) uses pure sinewaves at frequencies equal to the frequency bins of the power spectra. If the signal oscillates at a frequency not represented in the power spectra, it will leak in the neighboring frequency bins (Lyon, 2009). If the FFTA resolution is lower, each frequency bin accounts for a bigger range of frequencies present in the EEG signal. Thus, we took advantage of this phenomenon to compensate for the behavioral variability.
In order to extract synchronization-related brain activity of the SMS and SP tasks, we recomputed the FFTA of the LO conditions with the same parameters as the SP condition and subtracted it from the FFTA of the corresponding SMS conditions to remove the contribution of passive listening. In other words, the results of this subtraction will highlight specific brain activations reflecting the sound-to-action processes during SMS, and removing brain activations associated with passive beat perception.
Because, for the SMS versus SP comparison, the signal on which we applied the FFTA was time-locked to thefinger taps, we recomputed the FFTA of the LO conditions to virtualfinger taps. Specifically, to determine the onset of each epochs of the LO conditions, we calculated the deviation between thefirst metronome sound and associated finger tap for each epoch of the SMS conditions, and we used these values to calculate the distance between thefirst sound of the LO epochs and onsets of the epochs. 2.4.3. SMS versus LO and SMS versus SP
Once we obtained the FFTA power spectra of each electrode for both SMS versus LO and SMS versus SP comparisons, the data went through a standardization procedure adapted from the method ofNozaradan et al. (2011). Assuming that, in the absence of an SSEP at a given frequency bin, the power of the neighboring frequency bins are similar, we divided for each electrode the frequency power at each frequency bin by the mean of the four neighboring bin values of the global power spectra (GPS, i.e., the average across all electrodes of the frequency power absolute values;Sallard, Spierer, Ludwig, Deiber, & Barral, 2014), such as:
= + + + − − + + NP P GPS GPS GPS GPS ( )/4 f f f 2 f 1 f 1 f 2
where Pfis the power, at a given frequency bin, of a single electrode, GPSfis the GPS power at a given frequency bin, and NPfis the
normalized power.
In order to preserve brain topography, which is crucial for source localization, our procedure included the following changes compared to that ofNozaradan et al. (2011): 1) We normalized the data by division rather than by subtraction, as subtraction might reverse the polarity of the values inconsistently throughout the electrode setting. 2) For each frequency bin, rather than normalizing the power of a given electrode by the average value of the neighboring frequency bins from that same electrode, we used the GPS values so to normalize the data by the same value throughout the scalp.
2.5. Data analysis 2.5.1. Behavioral data
For the tapping tasks (SMS and SP), the behavioral performances were evaluated by the ITI mean and variability, and the lag-1 autocorrelation. Given that tapping variability increases linearly as the tempo decreases (Madison, 2001), the coefficient of variation (CV = Std/mean) was used to allow between-tempo comparisons. The lag-1 autocorrelation function is defined by:
Preprocessing
SMS vs LO
SMS vs SP
Averaging FFTA Subtraction Standardizationof power spectra
9 epochs of 12 ITIs • SMS • LO 18 epochs of 6 ITIs • SMS • SP • LO
Remove the contribution of passive listening • SMS - LO Resolution: 1/6th of the beat frequency Resolution: 1/12th of the beat frequency
Divide electrode power values of each frequency bin by the GPS values of the 4 neighbouring bins
(Adapted from Nozaradan et al., 2011)
Fig. 1. EEG data preprocessing procedure as a function of the comparisons of interest (SMS vs LO and SMS vs SP, seeSection 2.4.1and following for details).
=∑ − − ∑ − =− + = r x x x x x x ( ¯)( ¯) ( ¯) k i n k i i k i n i 1 1 2
where x̅ is the average of the n observations and k is the time lag.
We performed a 2 × 3 ANOVA on those variables using SPSS (Version 23; IBM Corp., Armonk, NY) with the following factors: Task (SMS; SP), Tempo (FA; SMT; SL). The reported p-values were corrected for sphericity violation using the Greenhouse-Geisser estimates depending on the results of Mauchly’s test.
For the synchronization conditions, we also tested the mean and variability of the asynchrony (i.e., the distance betweenfinger taps and metronome onsets). In order to neutralize effects due to tempo differences (Semjen et al., 2000), the variability was esti-mated by dividing the standard deviation from the ITI mean. We performed a one-way ANOVA over the factor Tempo (FA; SMT; SL).
2.5.2. EEG data
EEG data were analyzed using the Cartool software programmed by Denis Brunet (cartoolcommunity.unige.ch), the STEN toolbox developed by Jean-François Knebel and Michael Notter (http://doi.org/10.5281/zenodo.1164038), and the RAGU toolbox (Koenig, Kottlow, Stein, & Melie-Garcia, 2011).
To test for between-condition modulations of the EEG frequency response, we performed statistical analyses on the GPS and the Global Map Dissimilarity index (GMD). These global measures of the EEG frequency response offer reference independent, and data-driven analyses preventing from pre-selecting a subset of electrodes of interest. GMD quantifies topographic differences between two electricfields and thus indicates modulations in the EEG scalp topography (Tzovara, Murray, Michel, & De Lucia, 2012). It is calculated as the root mean square of the difference between conditions, electrode by electrode, of the normalized voltage potentials. Normalization prevents significant differences due to the amplitude of the signal. Between-condition GPS modulations alone re-present differences in the activation strength of a given brain network. GMD modulations indicate differences in the underlying brain sources of the signal (Michel & Murray, 2012; Murray, Brunet, & Michel, 2008; Tzovara et al., 2012).
To statistically evaluate between-condition GMD differences, the scalp topographies went through a bootstrapping procedure (Koenig et al., 2011): the GMD values were compared with an empirical distribution based on randomly reassigning each partici-pant’s data across the electrode montage to any of the conditions (5000 permutations per data point).
2.5.2.1. SMS versus LO. We performed a 2 × 3 × 2 ANOVA on the GPS and GMD data with the following factors: Task (SMS; LO), Tempo (FA; SMT; SL), Harmonic (F0; H1). Because the influence of ERPs on the amplitude of the power spectra at F0 and H1 varied with tempo (Zhou et al., 2016), we considered neither the main effects of Tempo and Harmonic, nor the Tempo × Harmonic and Task × Tempo × Harmonic interactions.
2.5.2.2. SMS versus SP. For the comparison of SMS and SP conditions, we analyzed F0 only, due to the variability of the tapping, and its impact on the corresponding higher-order harmonics. Indeed, if the tapping frequency varied from the average used to determine the FFTA resolution, each multiplication of the fundamental frequency increased the difference between the target FFTA power spectra frequency bin and the corresponding tapping frequency multiples. Thus, we performed a 2 × 3 ANOVA on the GPS and GMD at F0 with the following factors: Task (SMS; SP), Tempo (FA; SMT; SL). We did not consider the main effect of Tempo for the same reasons as for the SMS versus LO comparison.
2.5.2.3. Source estimations. In order to identify potential differences in the underlying brain generators of the signal recorded at the scalp, we performed source estimations for contrasts showing significant GPS or GMD effects. First, a LAURA (local autoregressive average) distributed linear inverse solution (Grave de Peralta Menendez, Gonzalez Andino, Lantz, Michel, & Landis, 2001; Grave de Peralta Menendez, Murray, Michel, Martuzzi, & Gonzalez Andino, 2004) yielded source estimations for each condition and harmonic of each participant. The solution space included 3005 nodes spread over a realistic head model on a 6 × 6 × 6 mm grid. The solution points were equally distributed within the grey matter of the Montreal Neurological Institute (MNI) average brain. Even though EEG source estimation has been applied successfully in various clinical and fundamental studies (e.g. Britz, Landis, & Michel, 2009; Corrigan et al., 2009; De Pretto, Rochat, & Spierer, 2017; Geukes et al., 2013; James, Britz, Vuilleumier, Hauert, & Michel, 2008; James et al., 2012; James, Oechslin, Michel, & De Pretto, 2017; Rihs et al., 2013; Sallard et al., 2014), such method only guarantees a 1–2 cm spatial accuracy (Martuzzi et al., 2009; Plomp, Michel, & Herzog, 2010).
We performed ANOVAs on the current density of each solution point including the same factors as for GPS and GMD (2 × 3 × 2 ANOVA for SMS vs LO, and a 2 × 3 ANOVA for SMS vs SP). To correct for multiple testing, we applied a cluster extent threshold of at least 15 contiguous nodes with p < 0.05. This spatial criterion was determined using the AlphaSim program (available from the Analysis of Functional NeuroImages website:http://afni.nimh.nih.gov). This program computed 10,000 Monte Carlo permutations over the 3005 nodes masked within our leadfield matrix, and assuming a spatial smoothing of 6 mm FWHM and a cluster connection radius of 8.5 mm. For clusters of at least 15 nodes, the output yielded a cluster-level likelihood of p < 0.05, and a corresponding node-level false positive probability of p < 0.0001.
3. Results
3.1. Behavioral results
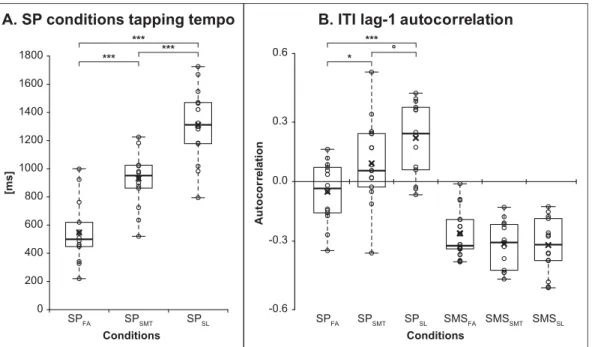
During the self-paced conditions, the participants produced a wide range of tapping frequencies with some overlap between tempo conditions (Fig. 2A,Table 1). The Task (2) × Tempo (3) ANOVA (Table 2) showed a significant effect of Tempo. Post-hoc analyses using Fisher’s Least Significant Difference (LSD) indicated that each tempo was significantly different from the others (p < 0.001). The 2 × 3 ANOVA on the ITI CV showed no significant effect (Table 2).
The 2 × 3 ANOVA on the ITI lag-1 autocorrelation (Table 2) showed a main effect of Task, illustrating higher values during the SP conditions compared to the SMS conditions, and a main effect of Tempo. This result was driven by the SP conditions, as illustrated by an interaction effect between Task and Tempo (Fig. 2B). Post-hoc analyses using Fisher’s LSD indicated that the values were sig-nificantly different during SPFAfrom the values during SPSMT(p < 0.05) and SPSL(p < 0.001), and marginally different between
SPSMTand SPSLtempi (p = 0.072). Because ITI lag-1 autocorrelation values increased with longer ITIs (as tempo became slower), and
because each participant produced his/her own tempo, we computed the correlation between ITI and lag-1 autocorrelation to verify whether the ITI lag-1 autocorrelation increase was associated with between-subject differences in ITI. A positive correlation was statistically significant in the SPSLcondition (r = 0.71, p = 0.014, Bonferroni corrected).
The one-way ANOVA on the asynchrony mean and variability showed no statistically significant effect of tempo (Table 2).
0 200 400 600 800 1000 1200 1400 1600 1800 SPFA SPSMT SPSL [ms] Conditions
A. SP conditions tapping tempo
-0.6 -0.3 0.0 0.3 0.6 SMSFA SMSSMT SMSSL SPFA SPSMT SPSL A u to co rr elat io n Conditions
B. ITI lag-1 autocorrelation
* *** ° *** *** ***
Fig. 2. Behavioral results. The graphs show the individual performances (grey circles), the median (thick horizontal line), and the mean (cross). A. Spontaneous self-paced tapping intertap intervals for each tempo condition. B. ITI lag-1 autocorrelation for each tempo of the SMS and SP con-ditions. °p = 0.072,*p < 0.05,***p < 0.001.
Table 1
Behavioral results.
Condition Tempo Intertap intervals Lag-1 autocorr. Asynchrony
Mean (Std) Mean (Std) CV (Std) Mean (Std) Mean (Std) Var. (Std)
[Hz] [ms] [%] [au] [ms] [%] SPFA 2.1 (0.9) 548 (219) 5.6 (1.5) −0.05 (0.14) – – SPSMT 1.1 (0.3) 931 (204) 5.6 (1.3) 0.08 (0.20) – – SPSL 0.8 (0.2) 1312 (265) 5.9 (1.6) 0.20 (0.17) – – SMSFA 2.1 (0.9) 549 (220) 5.4 (1.4) −0.25 (0.12) −36 (43) 7.3 (6.3) SMSSMT 1.1 (0.3) 936 (204) 5.9 (1.4) −0.29 (0.11) −48 (40) 5.1 (1.0) SMSSL 0.8 (0.2) 1306 (2 6 2) 5.9 (1.8) −0.30 (0.13) −37 (41) 5.2 (1.7)
CV = coefficient of variation; Std = between-subject standard deviation; Var. = average within-subject variability.
3.2. EEG results 3.2.1. SMS versus LO
3.2.1.1. Global frequency indices (SMS vs LO). The GPS of each task and tempo showed prominent peaks at the frequency of the tapping and higher-order harmonics (Fig. 3). The Task (2) × Tempo (3) × Harmonic (2) ANOVA on GPS resulted in a main effect of Table 2
ANOVA results for behavioral measures.
F df p-val ηp2 ε* ITI MEAN Task 0.00 1,13 0.986 0.00 – Tempo 96.14 1.27,16.53 0.000 0.88 0.64 Task × Tempo 3.32 1.32,17.17 0.077 0.20 0.66 ITI CV Task 0.01 1,13 0.927 0.00 – Tempo 0.44 1.22,15.80 0.554 0.03 0.61 Task × Tempo 0.64 2,12 0.545 0.10 –
ITI LAG-1 AUTOCORRELATION
Task 80.48 1,13 0.000 0.86 – Tempo 5.05 2,12 0.026 0.46 – Task × Tempo 7.79 2,12 0.007 0.56 – ASYNCHRONY MEAN Tempo 1.26 2,12 0.318 0.17 – ASYNCHRONY VARIABILITY Tempo 1.83 1.09,14.15 0.199 0.12 0.54
*Greenhouse-Geisser Epsilon reported for effects violating sphericity assumption and corrected using Greenhouse-Geisser estimates of sphericity.
0 1 2 3 4 5 6 F0 H1 H2 H3 H4 H5 A m plitude [ V] Frequency [AU] SMS - Fast 0 1 2 3 4 5 6 F0 H1 H2 H3 H4 H5 A m plitude [ V] Frequency [AU] SMS - Spontaneous 0 1 2 3 4 5 6 F0 H1 H2 H3 H4 H5 A m plitude [ V] Frequency [AU] SMS - Slow 0 1 2 3 4 5 6 F0 H1 H2 H3 H4 H5 A m plitude [ V] Frequency [AU] LO - Fast 0 1 2 3 4 5 6 F0 H1 H2 H3 H4 H5 A m plitude [ V] Frequency [AU] LO - Spontaneous 0 1 2 3 4 5 6 F0 H1 H2 H3 H4 H5 A m plitude [ V] Frequency [AU] LO - Slow V +4 -4 F0 H1 V +3 -3 F0 H1 V +3 -3 F0 H1 V +3 -3 F0 H1 V +4 -4 F0 H1 V +3 -3 F0 H1
Fig. 3. SSEPs for each tempo of the SMS and LO conditions. The thin grey power spectra represent each participant and the thick black power spectra represent the inter-individual averages.
Task reflecting higher GPS amplitude during SMS than LO (Table 3). GMD analysis indicated significant Task main effect and Task × Harmonic interaction effect (Table 3).
3.2.1.2. Electrical source estimations (SMS vs LO). The main effect of Task showed significant differences at the bilateral middle/ posterior cingulate gyrus, and SMA; left IFG; and the right STG (Table 4;Fig. 4A). The average current density (CD, expressed in μA/ mm3) for all these sites was stronger during SMS than LO. The Task × Harmonic interaction yielded significant differences at the bilateral middle/posterior cingulate gyrus (Table 4;Fig. 4B). Post-hoc analyses using Fisher’s LSD indicated that during SMS, CD was significantly higher at H1 than F0 (p < 0.005); and during LO, the CD values did not differ significantly between F0 and H1. 3.2.2. SMS versus SP
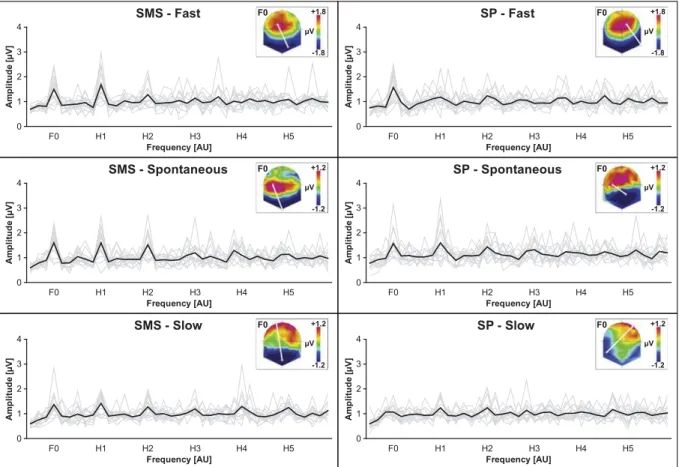
3.2.2.1. Global frequency indices (SMS vs SP). For the SMS task, the GPS of each tempo showed prominent peaks at the frequency of the tapping and higher-order harmonics (Fig. 5). For the SP task, peaks appeared at F0 in the fast condition and at F0 and H1 in the spontaneous condition. In the slow condition, only small peaks emerged from the inter-individual noise at H1 and H2. The Task (2) × Tempo (3) ANOVA on GPS at F0 yielded no significant effect (Table 5). GMD analyses yielded significant Task × Tempo interaction effect and a marginal main effect of Task (Table 5). As the behavioral results indicated a significant lag-1 autocorrelation main effect of Task, we analyses electrical source estimation for this contrast too.
3.2.2.2. Electrical source estimations (SMS vs SP). The main effect of Task showed significant differences at the bilateral inferior parietal lobule (IPL); and a cluster centered on the left IFG and encompassing the insula and STG (Table 6;Fig. 6A). The average CD for each cluster indicated stronger activation of the bilateral IPL during SP than SMS, and stronger activation of the left IFG during SMS than SP. The Task × Tempo interaction yielded significant differences at the bilateral IPL; right pre-SMA; and left fusiform gyrus, and a cluster centered on the inferior temporal gyrus and encompassing the parahippocampal gyrus (Fig. 6B). Post-hoc analyses using Fisher’s LSD indicated stronger CD during SP than SMS at spontaneous tempo for the bilateral IPL and left fusiform gyrus (p < 0.05); stronger CD during SMS than SP at slow tempo for the right pre-SMA, and left IFG (p < 0.05).
We also computed the SMS versus SP analysis without subtraction of the LO signal, in order to verify the influence of the subtraction on the results, and compared the results of both analyses (see Supplementary Material).
4. Discussion
By contrasting neurophysiological activity of beat perception, self-pacedfinger tapping, and sensorimotor synchronization, we could isolate brain activity related to synchronizingfinger movement with a steady beat. Comparing SMS versus SP we showed stronger activation of the left IFG during synchronization and of the bilateral IPL during self-pacedfinger tapping. At the behavioral level, the results suggested the use of two different timing modes for successive intertap intervals. The negative lag-1 autocorrelation values for SMS seems associated with event-based timing, whereas positive ITI lag-1 autocorrelation values may represent emergent timing (Delignières & Torre, 2011; Dione & Delevoye-Turrell, 2015; Ivry, Spencer, Zelaznik, & Diedrichsen, 2002). Event-based timing supposes an internal representation of temporal intervals, informing the nervous system on the timing of the upcoming beat. Table 3
Results for the global frequency indices comparing SMS versus LO.
GPS GMD
F df p-val ηp2 ε* p-val
Task 24.94 1,13 0.000 0.66 – 0.007
Task × Tempo 0.32 2,12 0.735 0.05 – 0.497
Task × Harmonic 1.60 1,13 0.228 0.11 – 0.000
*Greenhouse-Geisser Epsilon reported for effects violating sphericity assumption and corrected using Greenhouse-Geisser estimates of sphericity.
Table 4
Main Brain Region Activations for the 2 Task × 3 Tempo × 2 Harmonic ANOVA on current density for SMS versus LO.
Brain region Hemisphere x y z F-values Cluster size
TASK
Middle/Posterior Cingulate Cortex bilateral −15 −28 41 27.47 154
Supplementary Motor Area bilateral −3 −21 64 12.66
Superior Temporal Gyrus right 45 −27 15 21.31 106
Inferior Frontal Gyrus left −41 5 29 9.79 31
TASK × HARMONIC
Middle/Posterior Cingulate Cortex bilateral −3 −16 28 23.66 89
Note. Talairach x y z coordinates of local maxima for each significant cluster at p < 0.05. Minimal cluster size: 15 solution points. Brain areas are grouped by cluster.
In emergent timing, temporal information arises from the dynamic of the movement, requiring less cognitive involvement (Delignières & Torre, 2011; Repp & Su, 2013).
Here, compared to SMS, SP conditions showed an implication of the bilateral IPL during SPSMTand reduced cerebral activation,
including pre-SMA, during SPSL– where behavioral data suggest the predominant use of emergent timing (see Behavioral Findings
section). Compared to passive beat perception (LO conditions), SMS involved more strongly auditory, motor, and prefrontal regions, including the bilateral SMA; left IFG; and the posterior part of the right STG. These brain areas have recurrently been associated to beat processing and sensorimotor synchronization tasks (e.g.Chen et al., 2008; De Pretto & James, 2015; Grahn & McAuley, 2009; James et al., 2012; Konoike et al., 2012; Kung et al., 2013).
Taken together, these results partly confirm the findings ofCoull and Nobre (2008). In their review, these authors suggested that event-based timing may rely on the basal ganglia, SMA, IFG, and cerebellum, whereas emergent timing may rely on left-lateralized IPL and premotor cortex. We propose the alternative hypothesis that the IPL pattern of activation observed here reflects increased engagement of attentional resources for interval retention.
4.1. Behavioralfindings
The average SMT (SPSMTcondition) in this study (931 ms) was slow compared to the population mean (around 600 ms;Fraisse, 1982). However, the values measured here still fit within the range of inter-individual variability reported in the literature (Michaelis, Wiener, & Thompson, 2014; Monier & Droit-Volet, 2016; Schwartze, Keller, Patel, & Kotz, 2011; Sternad, Dean, & Newell, 2000). In the current study, the participants kept their arms along-side their body (sagittal plane). Recent evidence indicated lower corticomotor excitability in this position than if the arms were positioned on a table in front of the participant (Mogk, Rogers, Murray, Perreault, & Stinear, 2014), and that higher corticomotor excitability resulted in faster SMT (Bisio et al., 2015). The reverse may also be true (lower corticomotor excitability inducing slower SMT) and thus, the imposed position would explain the observed slow pace of SMT in the current experiment.
The ITI lag-1 autocorrelation showed consistent negative values for SMS associated with a stable representation of the beat (Dione & Delevoye-Turrell, 2015), and increasing values for SP– from negative to positive – with reducing tempo (Fig. 2). Negative values of ITI lag-1 autocorrelation indicate that longer intervals are mostly followed by shorter ones and reversely, and reflect correction of interval length (Semjen et al., 2000). Positive values suggest that successive intervals tend to be of similar duration, and typically reflect slow temporal drifts (Collier & Ogden, 2004). The values close to zero in the SPFAand SPSMTconditions suggest a hybrid use of
event-based and emergent timing (Dione & Delevoye-Turrell, 2015; Repp & Steinman, 2010; though seeDelignières & Torre, 2011).
SMS vs LO
A. Main effect of Task
p < 0.05 p < 0.001 0 1.5E-03 3.0E-03 bilateral Cingulate bilateral SMA right STG left IFG [ A/ m m 3]
main effect of TASK
SMS LO ** * * * *
B. Interaction effect Task x Harmonic
0 0.8E-03 1.6E-03 SMS LO [ A/ m m 3] Task Interaction effect TASK x HARMONIC F0 H1 ***
Middle/Posterior Cingulate Gyrus Middle/Posterior Cingulate Gyrus
Middle/Posterior Cingulate Gyrus SMA
right STG left IFG
**
Fig. 4. Distributed electrical source estimations for the main and interaction effects of significant GPS or GMD differences between SMS and LO. The bar graphs depict the current density mean and standard error for each cluster.*p < 0.05,**p < 0.01,***p < 0.001.
0 1 2 3 4 F0 H1 H2 H3 H4 H5 A m plit ude [ V] Frequency [AU] SMS - Fast 0 1 2 3 4 F0 H1 H2 H3 H4 H5 A m plit ude [ V] Frequency [AU] SP - Fast 0 1 2 3 4 F0 H1 H2 H3 H4 H5 A m plit ude [ V] Frequency [AU] SMS - Spontaneous 0 1 2 3 4 F0 H1 H2 H3 H4 H5 A m plit ude [ V] Frequency [AU] SMS - Slow 0 1 2 3 4 F0 H1 H2 H3 H4 H5 A m plit ude [ V] Frequency [AU] SP - Spontaneous 0 1 2 3 4 F0 H1 H2 H3 H4 H5 A m plit ude [ V] Frequency [AU] SP - Slow F0 V +1.8 -1.8 F0 V +1.2 -1.2 F0 V +1.2 -1.2 F0 V +1.8 -1.8 F0 V +1.2 -1.2 F0 V +1.2 -1.2
Fig. 5. SSEPs for each tempo of the SMS and SP conditions. The thin grey power spectra represent each participant and the thick black power spectra represent the inter-individual averages.
Table 5
Results for the global frequency indices comparing SMS versus SP.
GPS GMD
F df p-val ηp2 ε* p-val
Task 1.16 1,13 0.302 0.08 – 0.059
Task × Tempo 1.33 2,12 0.301 0.18 – 0.022
*Greenhouse-Geisser Epsilon reported for effects violating sphericity assumption and corrected using Greenhouse-Geisser estimates of sphericity.
Table 6
Main Brain Region Activations for the 2 Task × 3 Tempo ANOVA on current density for SMS versus SP.
Brain region Hemisphere x Y z F-values Cluster size
TASK
Inferior Parietal Lobule left −40 −58 47 19.71 79
Inferior Frontal Gyrus left −49 8 4 16.60 150
Inferior Parietal Lobule right 40 −39 57 12.52 35
TASK × TEMPO
Inferior Parietal Lobule left −34 −64 47 15.18 112
Inferior Parietal Lobule right 60 −38 43 8.79 90
pre-SMA (SFG) right 9 25 54 8.51 16
Fusiform Gyrus left −42 −56 −8 6.18 156
Inferior Temporal Gyrus left −32 0 −35 5.89
Note. Talairach x y z coordinates of local maxima for each significant cluster at p < 0.05. Minimal cluster size: 15 solution points. Brain areas are grouped by cluster.
The absence of significant correlation between ITI and ITI lag-1 autocorrelation indicate that this was not directly related to the tapping frequency. However, during SPSLmost participants seemed to favor emergent timing (Fig. 2), and the slower the tapping
tempo, the more they were likely to use this mode of timing control.
Our results imply a weaker representation of the ITIs during SPSL, and that faster tempi facilitate the creation of an internal
representation of the beat, even without external stimulation. Even though the tapping variability was similar between all conditions, thesefindings are consistent with our behavioral hypothesis predicting increased stability during SMS and at faster tempi. These findings are in line with distinction between sub-second (roughly corresponding to SPFAand SPSMT) and supra-second (roughly
corresponding to SPSL) timing (Lewis & Miall, 2003).
4.2. Cerebral correlates of event-based versus emergent timing
In the current study, the left IFG showed stronger activation in the SMS conditions compared to SP and to LO. However, the left IFG clusters of the SMS versus SP and SMS versus LO contrasts did not overlap. In SMS versus LO, the cluster was at the border with the premotor cortex, roughly corresponding to Broca’s area. In the SMS versus SP comparison, the cluster was more ventral, cor-responding to the activations identified byCoull and Nobre (2008)that they associated with event-based timing, corroborating our behavioral results. Thus, the ventral portion of the left IFG may play a central role in event-based timing, probably through its implication in working memory (Kumar et al., 2016; Strand, Forssberg, Klingberg, & Norrelgen, 2008). The increased cerebral
SMS vs SP
A. Main effect of Task B. Interaction effect Task x Tempo
p < 0.05 p < 0.001 0 2.0E-03 4.0E-03 left IPL left IFG right IPL [ A/ m m 3]
main effect of TASK
SMS SP ** ** ** 0.0E+00 2.0E-03 4.0E-03 left IPL right IPL right pre-SMA left Fusiform left ITG [ A/ m m 3] Slow * ** 0.0E+00 2.5E-03 5.0E-03 [ A/ m m 3] Spontaneous SMS SP ** * * 0.0E+00 1.5E-03 3.0E-03 [ A/ m m 3] Fast
interaction effect TASK x TEMPO
left IPL left IFG right IPL left IPL right IPL right preSMA left Fusiform left ITG
Fig. 6. Distributed electrical source estimations for the main and interaction effects of significant GPS or GMD differences between SMS and SP. The bar graphs depict the current density mean and standard error for each cluster.*p < 0.05,**p < 0.01.
activation during event-based timing at slower tempi (SMSSLvs SPSL) supports the hypothesis of a greater need for brain resources
during event-based than emergent timing (Delignières & Torre, 2011), and at slower tempo (Lewis & Miall, 2003).
On the other hand, our results do not confirm the association of the IPL with emergent timing suggested byCoull and Nobre (2008). Their conclusions on emergent timing were based on perceptual tasks only, justifying that the mechanisms involved differ significantly, whereas for event-based timing they reviewed both perception and production tasks, for which the mechanisms were considered similar. Alternatively, previous studies associated the IPL with the allocation of attentional resources during temporal processing and in the temporary retention of interval durations (Bolger et al., 2013; Konoike et al., 2012; Rao et al., 2001). As, for practical reasons, SPSMTwas always thefirst condition that the participants completed, this area might rather have been involved in
the initial retention of the intervals.
The left fusiform gyrus activation, showing the same pattern of activation as IPL, is mainly associated with visual discrimination or categorization of letters strings (e.g.Pernet, Celsis, & Démonet, 2005), but also musical notation and notably rhythm (James et al., 2014; Proverbio, Manfredi, Zani, & Adorni, 2013; Stewart, 2005), suggesting that it may act as a pattern analyzer. Thus, this area may support the IPL in the initial evaluation of the intertap intervals.
4.3. Cerebral correlates of auditory-motor coupling
In accordance with our second hypothesis, we observed stronger involvement of the bilateral SMA, left IFG and right STG during SMS compared to LO. The dorsal stream, running from temporo-parietal to inferior and pre-frontal areas, was defined as the sound-to-action pathway supporting auditory-motor integration in language in the left hemisphere (Hickok & Poeppel, 2007, 2015), and in music processing in the right hemisphere (Oechslin, Gschwind, & James, 2018). Several studies of functional and anatomical connectivity pointed out a potential coordinated implication of SMA, IFG, and STG in SMS. We previously proposed that the network including the bilateral SMA, IFG and STG, along with cerebellar areas and the left premotor cortex may play a role in interfacing auditory and motor processing (De Pretto & James, 2015). Similarly,Kung et al. (2013)suggested that the right posterior STG and bilateral IFG were part of a network involved in finding and maintaining the beat. Using diffusion tensor magnetic resonance imaging,Blecher, Tal, and Ben-Shachar (2016)observed significant correlation between synchronization accuracy and fractional anisotropy of white matter tracks connecting the bilateral temporal lobes, and connecting the left STG to the left IFG and premotor areas, reflecting potential faster communication within these tracts in participants producing smaller SMS asynchrony. Taken to-gether, these results provide converging evidence of a coordinated activity of the right STG and left IFG during SMS.
Regarding the implication of SMA, a wide range of studies associated it to beat processing, along with the basal ganglia (e.g. Grahn & Brett, 2007; Schwartze et al., 2011; Teki et al., 2011). In particular,Grahn and McAuley (2009)observed combined stronger activation of left IFG and SMA in participants with better ability to extract the beat of complex stimuli, suggesting a potential joint role of these areas in beat processing.
Confirming our third hypothesis, the cingulate gyrus showed stronger activation during SMS at H1 than F0 and no difference during LO. The activation cluster encompassed the posterior and middle cingulate cortices. Activation of these areas have been reported during self-pacedfinger tapping (Kawashima et al., 1999), temporal sensory prediction (James et al., 2012), and beat perception (Grahn & Rowe, 2013). The cingulate cortex seems to play a key role in attention-related motor control (Leech & Sharp, 2014; Vogt, 2009). Thus, the current result is compatible with thefindings ofKim et al. (2010)showing stronger peaks at H1 when paying attention to the stimuli, and supports the notion that modulations of H1 in SSEP analysis provide information on the at-tentional processes involved. In our case, the differences between F0 and H1 occurred at the level of brain topography, indicating that these modulations accompanied changes in the underlying brain sources and are consistent withfindings in the visual domain showing different brain sources for F0 and H1 (Heinrichs-Graham & Wilson, 2012).
4.4. Neural processes contributing to SSEPs
Some authors hypothesized the existence of endogenous oscillators involved in beat processing (e.g.Large, 2000; McAuley, Jones, Holub, Johnston, & Miller, 2006; Michaelis et al., 2014; Repp, 2008), and it may be tempting to interpret the SSEPs as reflecting neural oscillations at the frequency of the beat and higher-order harmonics. However, SSEPs often reflect complex waveforms (Regan, 1989) and other factors may influence the configuration of peaks in the power spectra, such as the presence of transient ERPs or the acoustic features of the sound, (for discussions, seeHenry, Herrmann, & Grahn, 2017; Nozaradan, Keller, Rossion, & Mouraux, 2017; Zhou et al., 2016).
In the current study, the power spectra of the SMS and LO conditions showed high F0 peaks at all tempi relative to the peaks at higher-order harmonics (Fig. 4), indicating the presence of SSEPs. It most likely reflects a neural linkage between the beats, also during passive listening, consistent with the notion of induced feeling of a regular pulsation (Honing, 2013).
In the SMS versus SP comparison, the pattern of peaks in SP (Fig. 6) was consistent with the idea that the peaks are the con-sequence of regularly occurring transient ERPs. No clear evidence occurred that the SP condition induced SSEPs. This observation can be explained by the emergent timing mode dominating in SP, showing a more instinctive functioning that requires less cognitive involvement. Here, the participants produced self-paced tapping before being exposed to an auditory beat. The results might have been different in the context of a synchronization-continuation paradigm, where the continuation phase might require an internal
representation of the previously heard beat (Jantzen et al., 2007, 2004). This could explain the contrasting neuroimaging results when comparing SMS to a continuation phase (e.g.Bijsterbosch et al., 2011; Jantzen et al., 2007, 2004; Rao et al., 1997), as the internal persistence of the auditory beat might vary depending on the task or instruction.
On the other hand, in SMS the power spectra at all three tempi showed a similar pattern, especially peaks at F0, indicating the presence of SSEPs. Even though we cannot disentangle whether this result derives from pure oscillatory neural entrainment or more complex waveforms, source localization suggest that auditory-motor coupling is mediated by the left ventral IFG, making it the best candidate for the hypothesized endogenous oscillation generator related to beat processing.
4.5. Limitations
First, although we controlled for overt movements during the LO conditions by means of a webcam, we cannot exclude that micro-movements were produced in response to the auditory beats. Such micro-movements during the LO conditions may have reduced the differences between conditions. However, the differences that we did observe are unlikely induced by the presence of unwanted movements in the LO conditions. Indeed, the differences were either showing stronger activation in SMS than LO, or, in the case of SMS vs SP after subtraction of LO, were also observable before the subtraction (see Supplementary Material).
Second, asking participants to tap at their own pace resulted in a wide range of inter-individual tapping frequencies overlapping between tempo conditions. This prevented from fully analyzing the GPS differences between tempi and interpreting them in relation with potential effects of ERPs. We would like to underline that the different inter-individual tempi highlighted cognitive effects of the task rather than physiological effects, given the fact that SMT (SMSSMTand SPSMTconditions) represented the“most natural” to the
participants, as instructed.
Third, as SSEP analysis transfers the EEG signal into the frequency domain, the temporal information is lost. Temporal resolution is one of the main advantages of EEG over other neuroimaging technics such as fMRI. However, whereas fMRI reflects slow he-modynamic processes (Huettel, Song, & McCarthy, 2014), SSEPs represent events occurring within the millisecond range (Zhou et al., 2016). Moreover, because the tempo differences might modulate the latency or amplitude of classical ERP components (Jongsma, Meeuwissen, Vos, & Maes, 2007; Snyder & Large, 2004), SSEPs are more robust than ERPs to this issue.
Finally, regarding spatial resolution, EEG source estimation can only guarantee a 1–2 cm spatial accuracy (Martuzzi et al., 2009; Plomp et al., 2010), as compared to the millimeter precision of fMRI. This holds true especially for deeper brain sources (Sohrabpour et al., 2015; Song et al., 2015). Thus, our design could not evaluate the implication of brain areas such as the basal ganglia and the cerebellum, which influence in timing and SMS is well established (e.g.Grahn & Brett, 2007; Kung et al., 2013; Schwartze et al., 2011; Teki et al., 2011). In conclusion, EEG and fMRI measure different brain mechanisms and provide complementary information (Disbrow, Slutsky, Roberts, & Krubitzer, 2000).
5. Conclusion
This study investigated the still under explored neurophysiological correlates of self-pacedfinger tapping in comparison with SMS. By comparing SMS to auditory perception and isochronous motor action at different tempi, we could highlight brain areas involved in perception-action coupling. Based on previousfindings, we hypothesized the use of two attentional processes: one associated with the middle/posterior cingulate cortex and oriented towards the external beats; and one associated with the inferior parietal lobules and oriented towards the internal retention of intervals. Most importantly, the comparison of SMS versus LO suggests a role of the dorsal stream in SMS supporting sound-to-action processes, whereas the comparison of SMS versus SP pointed to the left inferior frontal gyrus as playing a key role in beat-based auditory-motor coupling. We hypothesize that this brain area acts as a working memory structure by aligning its neural activity to the beat frequency.
Acknowledgments
We would like to thank Claude-Alain Hauert for his precious advice at every stage of this study.
The Cartool software (cartoolcommunity.unige.ch) has been programmed by Denis Brunet, from the Functional Brain Mapping Laboratory (FBMLab), Geneva, Switzerland, and is supported by the Center for Biomedical Imaging (CIBM) of Geneva and Lausanne. The STEN toolbox (http://doi.org/10.5281/zenodo.1164038) has been programmed by Jean-François Knebel and Michael Notter, from the Laboratory for Investigative Neurophysiology (the LINE), Lausanne, Switzerland, and is supported by the Center for Biomedical Imaging (CIBM) of Geneva and Lausanne and by National Center of Competence in Research project“SYNAPSY – The Synaptic Bases of Mental Disease”; project no. 51AU40_125759.
This research did not receive any specific grant from funding agencies in the public, commercial, or not-for-profit sectors. Appendix A. Supplementary data
Supplementary data associated with this article can be found, in the online version
References
Bengtsson, S. L., Ullén, F., Ehrsson, H. H., Hashimoto, T., Kito, T., Naito, E., ... Sadato, N. (2009). Listening to rhythms activates motor and premotor cortices. Cortex,
45(1), 62–71.https://doi.org/10.1016/j.cortex.2008.07.002.
Bijsterbosch, J. D., Lee, K.-H., Hunter, M. D., Tsoi, D. T., Lankappa, S., Wilkinson, I. D., ... Woodruff, P. W. R. (2011). The role of the cerebellum in sub- and
supraliminal error correction during sensorimotor synchronization: Evidence from fMRI and TMS. Journal of Cognitive Neuroscience, 23(5), 1100–1112.https://doi.
org/10.1162/jocn.2010.21506.
Bisio, A., Avanzino, L., Lagravinese, G., Biggio, M., Ruggeri, P., & Bove, M. (2015). Spontaneous movement tempo can be influenced by combining action observation
and somatosensory stimulation. Frontiers in Behavioral Neuroscience, 9.https://doi.org/10.3389/fnbeh.2015.00228.
Blecher, T., Tal, I., & Ben-Shachar, M. (2016). White matter microstructural properties correlate with sensorimotor synchronization abilities. NeuroImage,
138(Supplement C), 1–12.https://doi.org/10.1016/j.neuroimage.2016.05.022.
Bolger, D., Coull, J. T., & Schön, D. (2013). Metrical rhythm implicitly orients attention in time as indexed by improved target detection and left inferior parietal
activation. Journal of Cognitive Neuroscience, 26(3), 593–605.https://doi.org/10.1162/jocn_a_00511.
Britz, J., Landis, T., & Michel, C. M. (2009). Right parietal brain activity precedes perceptual alternation of bistable stimuli. Cerebral Cortex, 19(1), 55–65.https://doi.
org/10.1093/cercor/bhn056.
Celma-Miralles, A., de Menezes, R. F., & Toro, J. M. (2016). Look at the beat, feel the meter: Top–down effects of meter induction on auditory and visual modalities.
Frontiers in Human Neuroscience, 108.https://doi.org/10.3389/fnhum.2016.00108.
Chen, J. L., Penhune, V. B., & Zatorre, R. J. (2008). Listening to musical rhythms recruits motor regions of the brain. Cerebral Cortex, 18(12), 2844–2854.https://doi.
org/10.1093/cercor/bhn042.
Collier, G. L., & Ogden, R. T. (2004). Adding drift to the decomposition of simple isochronous tapping: An extension of the Wing-Kristofferson model. Journal of
Experimental Psychology: Human Perception and Performance, 30(5), 853–872.https://doi.org/10.1037/0096-1523.30.5.853.
Corrigan, N. M., Richards, T., Webb, S. J., Murias, M., Merkle, K., Kleinhans, N. M., ... Dawson, G. (2009). An investigation of the relationship between fMRI and ERP
source localized measurements of brain activity during face processing. Brain Topography, 22(2), 83.https://doi.org/10.1007/s10548-009-0086-5.
Coull, J. T., & Nobre, A. (2008). Dissociating explicit timing from temporal expectation with fMRI. Current Opinion in Neurobiology, 18(2), 137–144.https://doi.org/10.
1016/j.conb.2008.07.011.
De Pretto, M., & James, C. E. (2015). Principles of parsimony: fMRI correlates of beat-based versus duration-based sensorimotor synchronization. Psychomusicology:
Music, Mind, and Brain, 25(4), 380–391.https://doi.org/10.1037/pmu0000122.
De Pretto, M., Rochat, L., & Spierer, L. (2017). Spatiotemporal brain dynamics supporting the immediate automatization of inhibitory control by implementation
intentions. Scientific Reports, 7(1), 10821.https://doi.org/10.1038/s41598-017-10832-x.
Delignières, D., & Torre, K. (2011). Event-based and emergent timing: Dichotomy or continuum? A reply to Repp and Steinman (2010). Journal of Motor Behavior,
43(4), 311–318.https://doi.org/10.1080/00222895.2011.588274.
Dione, M., & Delevoye-Turrell, Y. (2015). Testing the co-existence of two timing strategies for motor control in a unique task: The synchronisation spatial-tapping task.
Human Movement Science, 43, 45–60.https://doi.org/10.1016/j.humov.2015.06.009.
Disbrow, E. A., Slutsky, D. A., Roberts, T. P. L., & Krubitzer, L. A. (2000). Functional MRI at 1.5 tesla: A comparison of the blood oxygenation level-dependent signal
and electrophysiology. Proceedings of the National Academy of Sciences, 97(17), 9718–9723.https://doi.org/10.1073/pnas.170205497.
Fraisse, P. (1982). Rhythm and tempo. In D. Deutsch (Ed.). The psychology of music. New York: Academic Press.
Geukes, S., Huster, R. J., Wollbrink, A., Junghöfer, M., Zwitserlood, P., & Dobel, C. (2013). A Large N400 but no BOLD effect – Comparing source activations of
semantic priming in simultaneous EEG-fMRI. PLoS One, 8(12), e84029.https://doi.org/10.1371/journal.pone.0084029.
Grahn, J. A., & Brett, M. (2007). Rhythm and beat perception in motor areas of the brain. Journal of Cognitive Neuroscience, 19(5), 893–906.https://doi.org/10.1162/
jocn.2007.19.5.893.
Grahn, J. A., & McAuley, J. D. (2009). Neural bases of individual differences in beat perception. NeuroImage, 47(4), 1894–1903.https://doi.org/10.1016/j.
neuroimage.2009.04.039.
Grahn, J. A., & Rowe, J. B. (2013). Finding and feeling the musical beat: Striatal dissociations between detection and prediction of regularity. Cerebral Cortex, 23(4),
913–921.https://doi.org/10.1093/cercor/bhs083.
Grave de Peralta Menendez, R., Gonzalez Andino, S. L., Lantz, G., Michel, C. M., & Landis, T. (2001). Noninvasive localization of electromagnetic epileptic activity. I.
method descriptions and simulations. Brain Topography, 14(2), 131–137.https://doi.org/10.1023/A:1012944913650.
Grave de Peralta Menendez, R., Murray, M. M., Michel, C. M., Martuzzi, R., & Gonzalez Andino, S. L. (2004). Electrical neuroimaging based on biophysical constraints.
NeuroImage, 21(2), 527–539.https://doi.org/10.1016/j.neuroimage.2003.09.051.
Heinrichs-Graham, E., & Wilson, T. W. (2012). Presence of strong harmonics during visual entrainment: A magnetoencephalography study. Biological Psychology, 91(1),
59–64.https://doi.org/10.1016/j.biopsycho.2012.04.008.
Henry, M. J., Herrmann, B., & Grahn, J. A. (2017). What can we learn about beat perception by comparing brain signals and stimulus envelopes? PLoS One, 12(2),
e0172454.https://doi.org/10.1371/journal.pone.0172454.
Hickok, G., & Poeppel, D. (2007). The cortical organization of speech processing. Nature Reviews Neuroscience, 8(5), 393.https://doi.org/10.1038/nrn2113.
Hickok, G., & Poeppel, D. (2015). Chapter 8– Neural basis of speech perception. In M. J. Aminoff, F. Boller, & D. F. Swaab (Vol. Eds.), Handbook of Clinical Neurology:
Vol. 129, (pp. 149–160). Elsevier.https://doi.org/10.1016/B978-0-444-62630-1.00008-1.
Honing, H. (2013). 9– Structure and interpretation of rhythm in music. In D. Deutsch (Ed.). The psychology of music (pp. 369–404). (3rd ed.). Academic Press.
Huettel, S. A., Song, A. W., & McCarthy, G. (2014). Functional magnetic resonance imaging (3rd ed.). Oxford, New York: Oxford University Press.
Ivry, R. B., Spencer, R. M. C., Zelaznik, H. N., & Diedrichsen, J. (2002). The cerebellum and event timing. Annals of the New York Academy of Sciences, 978, 302–317.
https://doi.org/10.1111/j.1749-6632.2002.tb07576.x.
James, C. E., Britz, J., Vuilleumier, P., Hauert, C.-A., & Michel, C. M. (2008). Early neuronal responses in right limbic structures mediate harmony incongruity
processing in musical experts. NeuroImage, 42(4), 1597–1608.https://doi.org/10.1016/j.neuroimage.2008.06.025.
James, C. E., Michel, C. M., Britz, J., Vuilleumier, P., & Hauert, C.-A. (2012). Rhythm evokes action: Early processing of metric deviances in expressive music by experts
and laymen revealed by ERP source imaging. Human Brain Mapping, 33(12), 2751–2767.https://doi.org/10.1002/hbm.21397.
James, C. E., Oechslin, M. S., Michel, C. M., & De Pretto, M. (2017). Electrical neuroimaging of music processing reveals mid-latency changes with level of musical
expertise. Frontiers in Neuroscience, 11.https://doi.org/10.3389/fnins.2017.00613.
James, C. E., Oechslin, M. S., Ville, D. V. D., Hauert, C.-A., Descloux, C., & Lazeyras, F. (2014). Musical training intensity yields opposite effects on grey matter density
in cognitive versus sensorimotor networks. Brain Structure and Function, 219(1), 353–366.https://doi.org/10.1007/s00429-013-0504-z.
Jantzen, K. J., Oullier, O., Marshall, M., Steinberg, F. L., & Kelso, J. A. S. (2007). A parametric fMRI investigation of context effects in sensorimotor timing and
coordination. Neuropsychologia, 45(4), 673–684.https://doi.org/10.1016/j.neuropsychologia.2006.07.020.
Jantzen, K. J., Steinberg, F. L., & Kelso, J. A. S. (2004). Brain networks underlying human timing behavior are influenced by prior context. Proceedings of the National
Academy of Sciences of the United States of America, 101(17), 6815–6820.https://doi.org/10.1073/pnas.0401300101.
Jongsma, M. L. A., Meeuwissen, E., Vos, P. G., & Maes, R. (2007). Rhythm perception: Speeding up or slowing down affects different subcomponents of the ERP P3
complex. Biological Psychology, 75(3), 219–228.https://doi.org/10.1016/j.biopsycho.2007.02.003.
Kawashima, R., Inoue, K., Sugiura, M., Okada, K., Ogawa, A., & Fukuda, H. (1999). A positron emission tomography study of self-pacedfinger movements at different
frequencies. Neuroscience, 92(1), 107–112.https://doi.org/10.1016/S0306-4522(98)00744-1.
Kim, Y.-J., Grabowecky, M., Paller, K. A., & Suzuki, S. (2010). Differential roles of frequency-following and frequency-doubling visual responses revealed by evoked
neural harmonics. Journal of Cognitive Neuroscience, 23(8), 1875–1886.https://doi.org/10.1162/jocn.2010.21536.
Koenig, T., Kottlow, M., Stein, M., & Melie-Garcia, L. (2011). Ragu: A free tool for the analysis of EEG and MEG event-related scalpfield data using global
rando-mization statistics. Computational Intelligence and Neuroscience, 2011, e938925.https://doi.org/10.1155/2011/938925.
Konoike, N., Kotozaki, Y., Miyachi, S., Miyauchi, C. M., Yomogida, Y., Akimoto, Y., ... Nakamura, K. (2012). Rhythm information represented in the
fronto-parieto-cerebellar motor system. NeuroImage, 63(1), 328–338.https://doi.org/10.1016/j.neuroimage.2012.07.002.
Kumar, S., Joseph, S., Gander, P. E., Barascud, N., Halpern, A. R., & Griffiths, T. D. (2016). A brain system for auditory working memory. Journal of Neuroscience,
36(16), 4492–4505.https://doi.org/10.1523/JNEUROSCI.4341-14.2016.