Ueli Studler Martin Kretzschmar Michael Christ Tobias Breidthardt Markus Noveanu Andreas Schoetzau André P. Perruchoud Wolfgang Steinbrich Christian Mueller Received: 30 October 2007 Revised: 12 January 2008 Accepted: 25 January 2008 Published online: 28 March 2008 # European Society of Radiology 2008
Accuracy of chest radiographs
in the emergency diagnosis of heart failure
Abstract The purpose of this study was to determine the diagnostic accu-racy of chest radiographic findings of heart failure (HF) in current patients presenting with dyspnea in the emer-gency department. In a secondary analysis of the BASEL study, initial chest radiographs of 277 patients with acute dyspnea were evaluated by two radiologists blinded to the adjudicated diagnosis (56% had the final diagnosis of HF). Predefined radiographic cri-teria of HF were used. Statistical analysis included receiver-operating
characteristic (ROC) analysis and calculation of a logistic regression model including B-type natriuretic peptide (BNP) levels. The reader’s overall impression showed the highest area under the ROC curve for the diagnosis of HF in both supine and erect patient positions (0.855 and 0.857). Among individual radio-graphic findings, peribronchial cuff-ing in the supine position (0.829) showed the highest accuracies. The lowest accuracy was found for the vascular pedicle width in the supine position (0.461). Logistic regression analysis showed no significant differ-ences between the reader’s overall impression, the radiographic model, and BNP testing. In our study, the combination of radiographic features provided valuable information and was of comparable accuracy as BNP-testing for the diagnosis of HF.
Keywords Thoracic radiography . Heart failure . Dyspnea .
Cardiomegaly
Introduction
The evaluation and management of patients presenting to the emergency department (ED) with acute dyspnea is challenging. Among more than 30 diagnoses that may be responsible for acute dyspnea, heart failure (HF) is very common and clinically important [1]. Unfortunately, the rapid and accurate differentiation of HF from other causes of acute dyspnea often remains elusive. This symptom is not specific, as most patients describe dyspnea due to HF
very similarly as patients describe dyspnea due to pulmo-nary disease [2].
All major guidelines recommend that chest radiographs should be part of the initial diagnostic workup in patients with dyspnea [1,3]. The chest radiograph has proven useful for direct visualization of pulmonary congestion and helpful in distinguishing cardiogenic pulmonary edema from other pulmonary causes of dyspnea [4–7]. Unfortunately, previous studies dealing with radiographic features of HF have major limitations. First, most previous studies were conducted
This study was supported by research grants from the Swiss National Science Foundation and the Swiss Heart Foundation. Neither the authors nor the funding organizations have a conflict of interest.
U. Studler . M. Kretzschmar . W. Steinbrich
Department of Radiology, University Hospital Basel, Petersgraben 4, 4031 Basel, Switzerland e-mail: [email protected] e-mail: [email protected] M. Christ . T. Breidthardt . M. Noveanu . A. P. Perruchoud . C. Mueller
Department of Internal Medicine, University Hospital Basel, Petersgraben 4, 4031 Basel, Switzerland e-mail: [email protected] e-mail: [email protected] e-mail: [email protected] e-mail: [email protected] e-mail: [email protected] A. Schoetzau Institute of Biostatistics, Malzgasse 9, 4052 Basel, Switzerland e-mail: [email protected] U. Studler (*) Petersgraben 4, 4056 Basel, Switzerland e-mail: [email protected] Tel.: +41-61-3286576 Fax: +41-61-2655471
some 20 years ago, when HF was predominantly due to valvular heart disease (e.g., mitral stenosis) [8]. Nowadays, valvular heart disease accounts for less than 10% of HF cases, whereas coronary artery disease (CAD) is implicated as the cause in 50–70% in Western countries [8]. Second, previous studies using invasive pulmonary artery catheter-ization measurements as the gold standard definition for HF included younger highly selected patients [5, 7, 9]. In clinical practice, patients presenting with acute dyspnea are elderly patients with extensive comorbidity. Third, those studies that in fact enrolled contemporary patients evaluated exclusively the official reading obtained by at times less experienced radiologists during clinical routine working in the ED using non-standardized clinical radiological report forms as the source data [10, 11]. This approach is appropriate to evaluate the performance of radiological reports in clinical routine; however, it does not accurately describe the diagnostic potential of the method itself.
The purpose of the present study was to retrospectively determine the diagnostic accuracy of chest radiographic findings of heart failure in current patients presenting with dyspnea in the emergency department.
Materials and methods
Patient selection and diagnoses
Patients had been previously enrolled in a prospective study having institutional review board approval that also included approval for future retrospective research with use of the study data. Institutional review board approval and informed consent were not required for this retrospective review of chest radiographs.
The design, methods, and primary results of B-type natriuretic peptide (BNP) for Acute Shortness of Breath Evaluation (BASEL) study have been previously reported [12]. In brief, 452 patients presenting with acute dyspnea to the ED of the University Hospital in Basel between May 2001 and April 2002 were enrolled in this prospective randomized controlled single-blind trial. The patients were randomly assigned to either a group that used the measurement of B-type natriuretic peptide (BNP) levels (n=225) in the diagnostic workup or a control group that was evaluated with the use of the conventional diagnostic strategy (n=227). The primary goal of the study was to determine whether the measurement of BNP at admission was useful to reduce the time to discharge and the cost of treatment in patients with acute dyspnea.
Adjudicated HF diagnosis
All patients presenting with dyspnea were routinely assessed by at least two physicians at presentation. The final discharge diagnosis of HF was adjudicated by an
internal medicine specialist applying current guideline for the HF diagnosis [1] on the basis of all available medical records pertaining to the individual patient, including the response to therapy, transthoracic echocardiography, BNP levels (measured in a blinded fashion in the control group), and autopsy data in those patients dying in-hospital. Hence, the final diagnosis was based on clinical assessment without using invasive pressure measurements. The final diagnosis at hospital discharge was used as the reference standard for the present study.
Chest radiographs and image analysis
Initial chest radiographs of 277 patients (61% of 452 patients) were available for the present study. Thirty-five patients were excluded because chest radiographs were taken while patients were seated. The chest radiographs of the remaining 140 patients were no longer available to the hospital, because our hospital did not have a digital picture archiving system at the time of patient enrollment. Of the 277 patients, 165 (60%) posteroanterior and lateral radio-graphs were obtained in the erect position by using a conventional film-screen technique. A total of 112 (40%) anteroposterior chest films was taken while the patients were supine.
Prior to the current evaluation, the two readers reviewed ten chest radiographs of patients not in the study population and assigned scores in consensus to ensure consistency of readings (Fig. 1). Then, all 277 hard copies were independently evaluated on a view box by two radiologists (U.S., M.K.). The readers were blinded to any clinical data. Images were not excluded because of suboptimal radio-logical technique; instead, in cases with reduced image quality, only the affected items were excluded from evaluation (= missing values). In a next step, both readers together reviewed those studies in which the individual readings differed to reach a consensus. All applied radiographic signs have been previously reported to be associated with pulmonary edema [5, 6, 9]. The reading protocols used in those studies have been adopted and partially modified to retain as much objectivity as possible for the current evaluation. In general, a standardized three-point scale was used: 0, absent; 1, probably present or definitely present to a degree as described below; 2 or more, definitively present as described below. In addition to the standardized scoring system, the following listing provides a detailed description of each radiographic feature:
Rotation Relevant patient rotation was considered as present if the medial end of the clavicle overlaid the corresponding vertebral pedicle. In these cases, the evaluation of quantitative features was not performed (cardiothoracic ratio, vascular pedicle and azygos vein width).
Pleural effusions See Fig. 2.
Distribution of blood flow This sign was only evaluated for upright films. Balanced or upward redistribution was rated as abnormal.
Interstitial signs Peribronchial cuffing was graded as 1 when the bronchial wall was definitely detectable, the thickening of the wall was minimal, and the margins were
Fig. 2 Diagram illustrates the measurement technique for obtaining the vascular pedicle width (VPW), the azygos vein width (AW), and the cardiothoracic ratio (CTR), as well as the scoring system for pleural effusions. The VPW was measured by dropping a perpendicular line from the point at which the left subclavian artery exits the aortic arch and measuring across to the point at which the superior vena cava crosses the right mainstem bronchus (1). AW was measured across its maximum transverse diameter (2). CTR was calculated by dividing the maximum transverse diameter of the heart by the maximum thoracic width above the insertion of the diaphragm (3a, 3b/3c). Pleural effusions were scored as 1 when costophrenic angle blunting was present or homogenous opacity did not pass beyond the most cranial point of the dome of the diaphragm (4a). Effusions exceeding the cranial margin of the diaphragm were scored as 2 (4b)
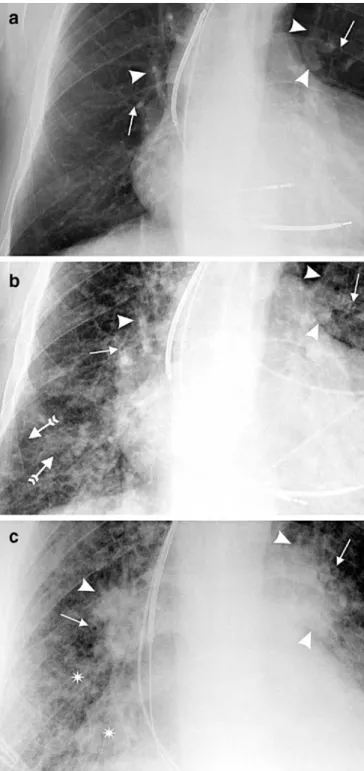
3Fig. 1 An 82-year-old man with recurrent heart failure showing different radiographic degrees of heart failure. The image was used for initial training session to define the scoring of findings. a Close-up view of a posteroanterior radiograph reveals clearly visible bronchial walls (arrows) without blurring of the margins (peribron-chial cuffing=1). Hilar vessels (arrowheads) are sharply outlined (hilar changes=0). Redistribution of flow is present. The overall impression is graded as 1. b Close-up view of a posteroanterior radiograph from the same patient with increasing signs of congestive heart failure. Prominent thickening of bronchial walls (plain arrows) with partially indistinct outlines are present (peri-bronchial cuffing=2), as well as hilar enlargement together with blurred vascular margins (arrowheads, hilar changes=2). Septal lines (tailed arrows) appear between indistinct vessels in the basal region. The overall impression is graded as 2. c Close-up view of an anteroposterior radiograph obtained in the supine position. There is now a complete loss of the bronchial interface (arrows, peribron-chial cuffing=3). The density and size of the hila have further increased (arrowheads), and the margins of hilar vessels are indeterminable (hilar changes=3). Alveolar edema is present (asterisks). The overall impression is graded as 3
sharp (Fig. 1). A more prominent bronchial wall accompanied by a loss of the sharp outline was considered as a score of 2, whereas a score of 3 indicated a complete loss of the bronchial interface. Septal lines were semiquantitatively graded as present in one thoracic zone (score=1), in two zones (score=2) or at least in three thoracic zones (score=3). Right and left lungs on the radiographs were therefore divided into three zones such that each lung contained three parts of equal height (upper, middle and lower zone). The six zones were not weighted; that is, for example, findings in the middle zone of the right lung and findings in the lower zone of the left lung in the absence of lower zone findings in the right lung were scored as 2. Increased density and enlargement of the hilum associated with minimal blurring of the margins were graded as 1. Increasing loss of definition of hilar borders and vascular margins was graded as 2, whereas a complete loss of the outlines indicated a score of 3.
Opacities This sign was considered present when the radiography showed bilateral increase of lung density with a tendency to coalesce. When there was a predominantly unilateral opacity it was left to the reader’s judgment as to whether the opacity is considered to represent pneumonia (score=0) or congestive heart disease.
Reader’s overall ompression For this item, reviewers were to include all radiographic signs in their interpretation to come to a conclusion comparable to that of a radiologist’s report. To retain objectivity we used the following scoring system: (1) supine: a score of 1 for interstitial signs with a maximum score of 1± pleural effusions (mild decompen-sation); a score of 2 for interstitial signs with a maximum score of 2± pleural effusions (moderate decompensation); a score of 3 for opacities and any interstitial sign ± pleural effusions (severe decompensation); (2) erect: the same scoring system as described for “supine;” in addition, abnormal distribution of blood flow was also scored as 1.
Cardiothoracic ratio (CTR), vascular edicle width (VPW), azygos vein width (AW) These features were measured according to previous reports [13,14], see Fig.2.
Statistical analysis
All analyses were performed in SPSS for Windows (Release 10.1.3, SPSS Inc., Chicago, IL) except weighted κ and the logistic regression model, which were calculated using R (R: a language and environment for statistical computing, Development Core Team, version 2.3.0, release 2006, available at www.r-project.org; accessed 18 August 2007). P values less than 0.05 were considered to indicate a statistically significant difference.
Differences in baseline characteristics between the patients examined in the supine and those in the erect position were
tested for statistical significance using two-tailed Mann-Whitney U test or Fisher’s exact test, when appropriate.
Data obtained from the consensus reading were used to calculate the radiographic sensitivity, specificity, and diagnostic accuracy, as represented by the area under the receiver-operating characteristic curve (Az), by comparing the reading results to the reference standard. Recom-mended cutoff points were used to calculate the sensitivity and specificity of continuous variables: CTR 0.58 (supine) and 0.51 (erect) [15]; VPW 64 mm (supine) and 53 mm (erect) [14]; AW 15 mm (supine) and 8 mm (erect) [14].
Interobserver agreement was quantified by theκ statistic for dichotomous data, the weighted κ statistic for ranked ordinal data and interclass correlation coefficients for continuous data [16,17].
Logistic regression model
A logistic regression model with dependent variable HF (yes/ no) and independent variables, interstitial signs, pleural effusions, opacities, and CTR was performed (subsequently termed radiographic model). To define the variables inter-stitial signs and pleural effusions, composite predictors were built. This procedure was selected since the variables within both features (pleural effusions: right with left side; intersti-tial signs: peribronchial cuffing with septal lines and hilar changes, respectively) were highly correlated with each other. Additional logistic regression models were performed with dependent variable HF and independent variables overall impression and BNP, respectively. For BNP, a cubic spline function was applied, since there is a nonlinear correlation between the log odds of HF and BNP. All models were summarized by means of odds ratio (OR) after adjustment for all of the other predictors and corresponding 95% confidence intervals (CI) of the predictors. In the case of categorical predictors, reference category was the zero score. In the case of the continuous predictor CTR, OR from the 75th to the 25th quantile was calculated. VPW and AW were excluded from the regression model because of the large portion of missing data [18]. The areas under the three ROC curves from the regression model for each position were compared by using the method of Hanley et al. [19].
Results
Baseline characteristics of the study population
A total of 154/277 (56%) patients had a final adjudicated diagnosis of HF (Table1). Patients examined in the supine position were older (P<0.001) and had higher BNP levels (P=0.013) than in the erect group, although the number of patients with HF did not significantly differ between the supine and erect position (P=0.11). The final diagnosis of acute exacerbation of chronic obstructive pulmonary
disease (ACOPD) was more common in the erect group (P=0.025). The mean age (69±16 years), the BNP level (mean 415±466 pg/ml) and the proportion of cases with HF (n=71; 41%) were similar in the 175 patients excluded from the current study (results not shown).
Image analysis and diagnostic accuracy
Table2lists the sensitivity, specificity, and area under the ROC curve (Az) value of each radiographic feature in the supine and erect position, respectively. The reader’s overall impression showed the highest area under the ROC curve (Az) value in both groups (0.855 and 8.857), followed by the Az value for peribronchial cuffing in the supine group (0.829). CTR (0.822) was comparable to peribronchial cuffing (0.799) in the erect group. The Az value of the vascular pedicle width (VPW) was low (0.461) in the supine group, as was the sensitivity (57%) and specificity (46%) for a cut-off point of 64 mm. Opacities showed low sensitivity in both groups (range 14-31%); however, when opacities were present, the feature was highly specific for HF (98-99%). Interstitial signs demonstrated a moderate to good range of Az values (0.726–0.829) in the supine position, whereas the specificity of subtle interstitial signs (score of 1) was low (range of specificity 48-71%) in this group.
Results of the logistic regression model
Results from the logistic regression model are reported in Table 3. Significant predictors of HF included interstitial signs with a score of 2 or more, CTR, the reader’s overall impression, and BNP levels greater than 100 pg/ml. The presence of opacities or pleural effusions was not significantly predictive for HF. In the supine group, all comparisons of Az values clearly fell short of statistical significance (Fig.3a). When Azvalues obtained from ROC analysis were compared in the erect group, BNP (0.908) tended to be higher than values of the overall impression and the radiographic model (0.850 and 0.868) (Fig. 3b), respectively. However, the differences were not statistically significant (P=0.128 and 0.180, respectively).
Interobserver agreement
The range of κ values varied from 0.63 (distribution of blood flow) to 0.89 (overall impression), indicating high agreement between readers. CTR showed the highest level of agreement as expressed by interclass correlation coefficients of 0.95 in the supine and 0.94 in the erect group, respectively. Agreements regarding the other con-tinuous radiographic features were excellent (0.80–0.88).
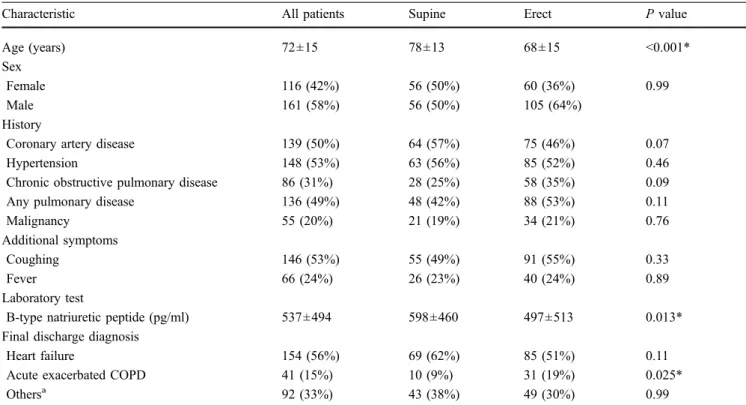
Table 1 Characteristics of all patients and patients imaged in the supine and in the erect position
Characteristic All patients Supine Erect P value
Age (years) 72±15 78±13 68±15 <0.001*
Sex
Female 116 (42%) 56 (50%) 60 (36%) 0.99
Male 161 (58%) 56 (50%) 105 (64%)
History
Coronary artery disease 139 (50%) 64 (57%) 75 (46%) 0.07
Hypertension 148 (53%) 63 (56%) 85 (52%) 0.46
Chronic obstructive pulmonary disease 86 (31%) 28 (25%) 58 (35%) 0.09
Any pulmonary disease 136 (49%) 48 (42%) 88 (53%) 0.11
Malignancy 55 (20%) 21 (19%) 34 (21%) 0.76
Additional symptoms
Coughing 146 (53%) 55 (49%) 91 (55%) 0.33
Fever 66 (24%) 26 (23%) 40 (24%) 0.89
Laboratory test
B-type natriuretic peptide (pg/ml) 537±494 598±460 497±513 0.013*
Final discharge diagnosis
Heart failure 154 (56%) 69 (62%) 85 (51%) 0.11
Acute exacerbated COPD 41 (15%) 10 (9%) 31 (19%) 0.025*
Othersa 92 (33%) 43 (38%) 49 (30%) 0.99
The values above reflect the number of patients (%) unless noted otherwise. Plus-minus is the mean ± SD. COPD = chronic obstructive pulmonary disease
a
Other final diagnosis including pulmonary embolism, pneumonia, anxiety disorder, and dyspnea of unknown origin *P<0.05 for supine vs. erect
Table 3 Results of logistic regression analysis for radiographic predictors and BNP levels
Predictor Supine position Erect position
ORa P Value Azb ORa P Value Azb
Radiographic model 0.860 (0.756, 0.927) 0.868 (0.803, 0.912)
Interstitial signs, score 1 1.63 (0.29, 9.31) 0.58 2.05 (0.70, 5.98) 0.19
Interstitial signs, score≥2 12.23 (2.77, 54.11) 0.001 6.23 (1.78, 21.77) 0.004
Pleural effusions, score 1 3.90 (0.80, 18.93) 0.09 0.81 (0.28, 2.36) 0.70
Pleural effusions, score 2 1.59 (0.36, 7.02) 0.54 1.88 (0.58, 6.10) 0.29
Opacities 3.51 (0.31, 39.36) 0.31 3.22 (0.35, 30.07) 0.30
CTR 2.24 (1.06, 4.72) 0.04 3.39 (1.61, 7.15) 0.001
Overall impression 0.829 (0.746, 0.894) 0.850 (0.780, 0.901)
Score 1 4.67 (1.43, 15.20) 0.011 5.79 (2.29, 14.62) 0.001
Score≥2 32.67 (9.52, 112.03) <0.001 47.83 (16.17, 141.45) 0.001
B-type natriuretic peptide 0.846 (0.762, 0.910) 0.908 (0.851, 0.948)
≥100 pg/ml 15.56 (3.30, 73.26) <0.001 31.20 (11.21, 86.81) <0.001
≥500 pg/ml 10.02 (4.21, 28.31) <0.001 40.14 (13.21, 122.07) <0.001
CTR = cardiothoracic ratio. OR = adjusted odds ratio a
Number in parentheses are the 95% confidence intervals b
Value represents the area under the ROC curve of each group of predictors. Numbers in parentheses are the 95% confidence interval Table 2 Specificity, sensitivity, and area under the ROC curve (Az) of radiographic features
Feature Scorea Supine position Erect position
Sensitivityc Specificityc Azd Sensitivityc Specificityc Azd
Pleural effusion, right 1 63 (41/65) 63 (26/41) 0.626 (0.515, 0.736) 66 (55/84) 71 (55/78) 0.685 (0.602, 0.767)
2 5 (3/65) 95 (39/41) 6 (5/84) 99 (77/78)
Pleural effusion, left 1 61 (38/62) 61 (26/43) 0.604 (0.493, 0.715) 71 (60/85) 72 (56/78) 0.711 (0.630, 0.792)
2 5 (3/62) 95 (41/43) 2 (2/85) 99 (77/78)
Redistribution N.a. N.a. N.a. 77 (65/84) 72 (57/79) 0.748 (0.670, 0.825)
Peribronchial cuffing 1 93 (63/68) 53 (23/43) 0.829 (0.752, 0.907) 79 (67/85) 73 (58/80) 0.799 (0.730, 0.867) 2 68 (46/68) 84 (36/43) 44 (37/85) 95 (76/80) Septal lines 1 69 (42/61) 71 (29/41) 0.726 (0.627, 0.824) 72 (61/85) 79 (63/80) 0.767 (0.694, 0.840) 2 34 (21/61) 93 (38/41) 45 (38/85) 89 (71/80) Hilar changes 1 88 (61/69) 48 (20/42) 0.775 (0.689, 0.861) 72 (61/85) 73 (58/80) 0.758 (0.684, 0.832) 2 65 (45/69) 74 (31/42) 48 (41/85) 90 (72/80) Opacities 31 (21/68) 98 (42/43) 0.643 (0.542, 0.744) 14 (12/85) 99 (79/80) 0.564 (0.477, 0.652) Overall impression 1 91 (63/69) 57 (24/42) 0.855 (0.786, 0.924) 84 (71/85) 78 (62/80) 0.857 (0.798, 0.916) 2 71 (49/69) 86 (36/42) 64 (54/85) 94 (75/80) CTRb0.58/0.51 56 (31/55) 63 (19/30) 0.667 (0.547, 0.787) 79 (61/77) 69 (52/75) 0.822 (0.755, 0.889) VPWb64/53 mm 57 (31/54) 46 (16/35) 0.461 (0.338, 0.585) 69 (51/74) 64 (46/72) 0.731 (0.651, 0.812) AWb15/8 mm 35 (17/48) 74 (20/27) 0.615 (0.478, 0.751) 68 (38/56) 66 (40/61) 0.764 (0.677, 0.850)
CTR = cardiothoracic ratio. VPW = vascular pedicle width. AW = azygos vein width. N.a. = not applicable a
Distribution of flow and opacities were graded 0–1 (no/yes). Pleural effusions were graded 0–2. Interstitial signs and the overall impression were graded 0–3
b
Sensitivity and specificity of CTR, VPW, and AW are shown for following cut-off points: CTR 0.58 (supine), CTR 0.51 (erect), VPW at 64 mm (supine), VPW at 53 mm (erect), AW at 15 mm (supine), AW at 8 mm (erect)
c
Values are expressed in %, numbers in parentheses were used to calculate percentages and reflect the number of patients d
Discussion
To our knowledge, this is the first study that assessed the diagnostic accuracy of chest radiographic HF findings in contemporary patients presenting with dyspnea using a dedicated reading protocol and predefined radiological scoring system applied by two independent experienced radiologists. We report four major findings. First, most radiographic signs had only moderate diagnostic accuracy and particularly limited sensitivity. Second, interstitial signs, particularly peribronchial cuffing, seemed to provide the highest accuracy among individual signs. Third, the overall radiological impression outperformed the indivi-dual signs and achieved similar accuracy as BNP testing. Fourth, the diagnostic accuracies of radiographic signs obtained from supine radiographs were comparable to those from the upright position with the exception of the measured variables CTR, VWP, and azygos vein width (AW). Given the high prevalence of dyspnea and HF, and both the high morbidity and high cost associated with the disease, our findings may be of clinical relevance as they may help make better use of an established, simple, easily available, non-invasive, and inexpensive method.
Our findings corroborate and extend previous studies evaluating chest radiographs. Baumstark et al. [5] reported that radiographic signs of pulmonary blood flow redistribu-tion, perihilar vascular blurring, and alveolar edema were closely related to pulmonary capillary wedge pressure (PCWP) (r=0.675) in a series of 50 patients. Similar observations were made by Balbarini et al. [9] where a strong correlation between signs of interstitial edema and PCWP (r=0.80) was obtained in 77 patients. However, it is important to note that both of these studies [5,9] reported a significantly better radiographic predictability of PCWP for patients with valvular heart disease than for those with CAD (r=0.89 vs. 0.66, r=0.87 vs. 0.70). This point is of special relevance in view of the shift in the etiology of HF away from
valvular heart disease towards CAD in the last decades [8]. Therefore, these invasive data support our finding of only moderate diagnostic accuracy of most radiographic signs in contemporary patients with a high prevalence of CAD. Moreover, our findings are supported by studies evaluating data derived from the official radiographic reading [10,11,
20]. In the largest of these, Collins et al. [20] reported that approximately one of every five patients admitted from the ED with acute HF had no signs of congestion on chest radiography. In summary, these data alert the clinician not to rule out HF in patients with no radiographic signs of congestion. In comparison to our study, Knudsen et al. [10] reported somewhat higher specificities for cardiomegaly (80%), cephalization (96%), interstitial edema (98%), and pleural effusion (92%) in an analysis of a subgroup of from the Breathing Not Properly Multinational Study. In contrast, the sensitivity of cephalization, interstitial edema, alveolar edema, and pleural effusion was higher in the present study. Although data on individual signs were reported only in few contemporary studies that used the official radiographic reading as the source data, interstitial signs and CTR seemed to stand out in those studies [10,11]. Knudsen et al. found that beyond BNP levels >100 pg/ml (odds ratio 12.3), cardiomegaly (odds ratio 2.3), cephalization (odds ratio 6.4), and interstitial signs (odds ratio 7.0) added significant predictive information above historical and clinical pre-dictors of HF. Logistic regression analysis for radiographic predictors in our study convincingly confirmed these findings by showing remarkably similar results. Sensitivity and accuracy of interstitial signs including peribronchial cuffing were considerably lower when using the clinical report rather than the expert reading as in this study [10,11]. This highlights the potential for specific improvements in the teaching and training of both radiologists and clinicians who interpret chest radiograms.
The overall radiological impression outperformed the individual signs and achieved similar accuracy as BNP Fig. 3 The ROC curves for
BNP (solid line), the radio-graphic model (dashed line) and the overall impression (dotted line) in the prediction of heart failure are shown for the supine (a) and the erect (b) group. a In the supine position, the Az
values of the three predictors showed no statistically signifi-cant difference. The radio-graphic model achieved a high accuracy (Az=0.860). b In the
erect position, BNP (Az=0.908)
tended to perform better than the reader’s overall impression (Az=0.850; P=0.128) and the
testing. This may be of importance as with the availability of BNP testing some have questioned the necessity of chest radiography in urgent-care settings [21]. Within the last decade, several large observational studies have consistently demonstrated that the BNP level is the single most accurate test in the diagnosis of patients with dyspnea [21–24]. How-ever, both from a clinical and a scientific point of view, it has become clear that chest radiography and BNP levels do pro-vide complimentary information [10]. This is even more so as chest radiography is not only helpful in the diagnosis of HF, but also of major importance in the diagnosis of other entities underlying dyspnea, including pneumonia and pneumothorax. The diagnostic accuracies of radiographic signs obtained from supine radiographs were comparable to those from the upright position with the exception of the measured variables CTR, VWP, and AW. Both the difference of patient characteristics and technical as well as physiological con-siderations required the separate evaluation of the supine and erect group in the present study. This lack of clear difference was unexpected, since supine radiographs tend to be of variable quality [25]. A conceivable explanation for this outcome is that patients in the supine group were older and tended to be more often and more severely decompensated than patients in the erect group. Thus, the patient’s condition considerably affected the radiographic examination technique and, consequently, a case selection bias must be assumed for supine radiographs. This is radiographically reflected by the larger proportion of patients with alveolar edema (19% vs. 7%) and the highest overall impression scores (23% vs. 10%) in the supine position as compared to the erect group. It was noticeable that supine positioning had a more pronounced negative effect on subtle interstitial signs. In the supine group, the specificity of hilar changes and peribronchial cuffing was
as low as about 50% for a threshold score of 1. Furthermore, we found a considerable difference in the diagnostic accuracies of measured radiographic features between the two patient positions. Although we attempted to minimize measurement bias by excluding images taken from rotated patients, technique and patient factors such as poor inspiration and greater magnification probably resulted in low accuracies of CTR (0.667) and AW (0.615) in the supine position. It is necessary to consider all radiographic findings for an overall impression because of the lack of specificity of each sign. It is possible that findings of HF may be confounded by concurrent lung disease (e.g., COPD), which is often present in elderly patients. As a consequence, the overall impression showed the highest radiographic accuracy and the strongest predictor of HF in both groups.
Our study has several limitations. First, this is a secondary analysis from a randomized controlled trial including con-secutive patients. Only 61% of the original trial cohort was available for the present study. Although we have no evidence that these patients differed significantly from those who were evaluated, some selection bias may be possible. Second, there is clearly a subjective element to the used chest radiograph scoring system despite attempts to minimize it. However, all levels of interobserver agreement regarding the specific elements of the scoring system could be described as very high. In conclusion, in contemporary patients presenting with acute dyspnea, most radiographic signs have only moderate diagnostic accuracy. However, the radiographic model and the overall impression achieve excellent diagnostic accu-racy that is comparable to BNP testing. Focusing on the overall radiological impression and interstitial signs such as peribronchial cuffing should increase the diagnostic yield of this easily available and inexpensive method.
References
1. Hunt SA, Abraham WT, Chin MH, Feldman AM, Francis GS, Ganiats TG, Jessup M, Konstam MA, Mancini DM, Michl K, Oates JA, Rahko PS, Silver MA, Stevenson LW, Yancy CW, Antman EM, Smith SC Jr., Adams CD, Anderson JL, Faxon DP, Fuster V, Halperin JL, Hiratzka LF, Jacobs AK, Nishimura R, Ornato JP, Page RL, Riegel B (2005) ACC/AHA 2005 Guideline Update for the Diagnosis and Management of Chronic Heart Failure in the Adult: a report of the American College of Cardi-ology/American Heart Association Task Force on Practice Guidelines (Writing Committee to Update the 2001 Guidelines for the Evaluation and Management of Heart Failure): developed in collaboration with the American College of Chest Physicians and the International Society for Heart and Lung Transplantation: endorsed by the Heart Rhythm Society. Circulation 112:e154–e235
2. Le Jemtel TH, Padeletti M, Jelic S (2007) Diagnostic and therapeutic challenges in patients with coexistent chronic obstructive pulmonary disease and chronic heart failure. J Am Coll Cardiol 49:171–180
3. Nieminen MS, Bohm M, Cowie MR, Drexler H, Filippatos GS, Jondeau G, Hasin Y, Lopez-Sendon J, Mebazaa A, Metra M, Rhodes A, Swedberg K, Priori SG, Garcia MA, Blanc JJ, Budaj A, Dean V, Deckers J, Burgos EF, Lekakis J, Lindahl B, Mazzotta G, Morais J, Oto A, Smiseth OA, Dickstein K, Albuquerque A, Conthe P, Crespo-Leiro M, Ferrari R, Follath F, Gavazzi A, Janssens U, Komajda M, Moreno R, Singer M, Singh S, Tendera M, Thygesen K (2005) Executive summary of the guidelines on the diagnosis and treatment of acute heart failure: the Task Force on Acute Heart Failure of the European Society of Cardiology. Eur Heart J 26:384–416
4. Aberle DR, Wiener-Kronish JP, Webb WR, Matthay MA (1988) Hydrostatic versus increased permeability pulmo-nary edema: diagnosis based on radio-graphic criteria in critically ill patients. Radiology 168:73–79
5. Baumstark A, Swensson RG, Hessel SJ, Levin DC, Grossman W, Mann JT 3rd, Abrams HL (1984) Evaluating the radio-graphic assessment of pulmonary venous hypertension in chronic heart disease. AJR Am J Roentgenol 142:877–884
6. Milne EN, Pistolesi M, Miniati M, Giuntini C (1985) The radiologic dis-tinction of cardiogenic and noncardio-genic edema. AJR Am J Roentgenol 144:879–894
7. Miniati M, Pistolesi M, Paoletti P, Giuntini C, Lebowitz MD, Taylor AE, Milne EN (1988) Objective radio-graphic criteria to differentiate cardiac, renal, and injury lung edema. Invest Radiol 23:433–440
8. Gheorghiade M, Bonow RO (1998) Chronic heart failure in the United States: a manifestation of coronary artery disease. Circulation 97:282–289 9. Balbarini A, Limbruno U, Bertoli D,
Tartarini G, Baglini R, Mariotti R, Pistolesi M, Mariani M (1991) Evaluation of pulmonary vascular pressures in cardiac patients: the role of the chest roentgenogram. J Thorac Imaging 6:62–68
10. Knudsen CW, Omland T, Clopton P, Westheim A, Abraham WT, Storrow AB, McCord J, Nowak RM, Aumont MC, Duc P, Hollander JE, Wu AH, McCullough PA, Maisel AS (2004) Diagnostic value of B-Type natriuretic peptide and chest radiographic findings in patients with acute dyspnea. Am J Med 116:363–368
11. Mueller-Lenke N, Rudez J, Staub D, Laule-Kilian K, Klima T, Perruchoud AP, Mueller C (2006) Use of chest radiography in the emergency diagnosis of acute congestive heart failure. Heart 92:695–696
12. Mueller C, Scholer A, Laule-Kilian K, Martina B, Schindler C, Buser P, Pfisterer M, Perruchoud AP (2004) Use of B-type natriuretic peptide in the evaluation and management of acute dyspnea. N Engl J Med 350:647–654
13. Danzer CS (1919) The cardiothoracic ratio: an index of cardiac enlargement. Am J Med Sci 157:513–521
14. Milne EN, Pistolesi M, Miniati M, Giuntini C (1984) The vascular pedicle of the heart and the vena azygos. Part I: The normal subject. Radiology 152:1–8 15. Milne EN, Pistolesi M (1993) Intensive
care unit radiology. In:Reading the chest radiograph: a physiologic ap-proach. St. Louis: Mosby-Year Book, Inc. 317–318
16. Cohen J (1968) Weighted kappa: nom-inal scale agreement with provision for scaled disagreement or partial credit. Psychol Bull 70:213–220
17. Shrout PE, Fleiss JL (1979) Interclass correlation: uses in assessing rater reli-ability. Psychol Bull 86:420–428 18. Harrell FEJ (2001) Binary logistic
regression. In:Regression modeling strategies. Springer, New York, pp 215–265
19. Hanley JA, McNeil BJ (1983) A method of comparing the areas under receiver operating characteristics curves derived from the same cases. Radiology 148:839–843
20. Collins SP, Lindsell CJ, Storrow AB, Abraham WT (2006) Prevalence of negative chest radiography results in the emergency department patient with decompensated heart failure. Ann Emerg Med 47:13–18
21. Dao Q, Krishnaswamy P, Kazanegra R, Harrison A, Amirnovin R, Lenert L, Clopton P, Alberto J, Hlavin P, Maisel AS (2001) Utility of B-type natriuretic peptide in the diagnosis of congestive heart failure in an urgent-care setting. J Am Coll Cardiol 37:379–385
22. Logeart D, Saudubray C, Beyne P, Thabut G, Ennezat PV, Chavelas C, Zanker C, Bouvier E, Solal AC (2002) Comparative value of Doppler echo-cardiography and B-type natriuretic peptide assay in the etiologic diagnosis of acute dyspnea. J Am Coll Cardiol 40:1794–1800
23. Januzzi JL Jr., Camargo CA,
Anwaruddin S, Baggish AL, Chen AA, Krauser DG, Tung R, Cameron R, Nagurney JT, Chae CU, Lloyd-Jones DM, Brown DF, Foran-Melanson S, Sluss PM, Lee-Lewandrowski E, Lewandrowski KB (2005) The N-terminal Pro-BNP investi-gation of dyspnea in the emergency department (PRIDE) study. Am J Cardiol 95:948–954
24. Maisel AS, Krishnaswamy P, Nowak RM, McCord J, Hollander JE, Duc P, Omland T, Storrow AB, Abraham WT, Wu AH, Clopton P, Steg PG, Westheim A, Knudsen CW, Perez A, Kazanegra R, Herrmann HC, McCullough PA (2002) Rapid measurement of B-type natriuretic peptide in the emergency diagnosis of heart failure. N Engl J Med 347:161–167 25. Wandtke JC (1994) Bedside chest