DOI 10.1007/s11135-010-9336-6
The framing of risks and the communication of subjective
probabilities for victimizations
Ivar Krumpal · Heiko Rauhut · Dorothea Böhr · Elias Naumann
Published online: 23 June 2010
© Springer Science+Business Media B.V. 2010
Abstract What does ‘likely’ mean, when respondents estimate the risk to become a victim of crime? Victimization risks can either be interpreted as gains (“being spared of offences”) or as losses (“becoming a victim of crime”). Because losses are perceived as more severe, respon-dents will state lower subjective victimization probabilities in the loss-frame, compared to the gain-frame. We demonstrate such a framing-effect with data from an experimental survey. Furthermore, we show that the meaning of vague quantifiers varies with the frequency and the severity of the event. Respondents assign to the same vague quantifiers (e.g. ‘unlikely’) higher likelihoods in terms of percentages for frequent and for less severe events than for infrequent and for severe events. In conclusion, respondents do not use vague quantifiers consistently so that it is problematic to compare subjective risks for different victimizations. Keywords Response effects· Framing · Vague quantifiers · Survey methodology · Conversational norms
1 Introduction
“I thought you’d never come here again,“ I said.
“Every time I see you, you say the same thing,” she said, laughing. As always, she sat down next to me at the bar and rested both hands on the counter. “But I did write you a note saying I wouldn’t be back for a while, didn’t I?”
“For a while is a phrase whose length can’t be measured. At least by the person who’s waiting,” I said.
I. Krumpal (
B
)· D. Böhr · E. NaumannDepartment of Sociology, University of Leipzig, Beethovenstr. 15, 04107 Leipzig, Germany e-mail: [email protected]
H. Rauhut (
B
)Chair of Sociology, in particular of Modeling and Simulation, CLU E6, Clausiusstrasse 50, 8092 Zurich, Switzerland
“But there must be times when the word’s necessary. Situations when that’s the only possible word you can use,” she said.
“And probably is a word whose weight is incalculable.”
Murakami(2000, italics inserted by the authors)
The popular Japanese writer Haruki Murakami is pointing to a problem which is not only raised in literature, but in science as well. When you walk through a scientific library, you come across entire book shelves dealing with the issue. Nevertheless, scientists are not sat-isfied with statements that the values of phrases like “for a while” or “probably” are simply immeasurable. Several attempts have been made to quantify such vague quantifiers. Simp-son’s (1944) essay was one of the first which dealt with expressions of frequency and their related meaning. In the meanwhile, it has been uncovered that the relation between verbal expressions and quantitative measures bears high uncertainty. We can distinguish between intra-individual and inter-individual differences (Budescu and Wallsten 1995, p. 289 f.).
Hakel(1969, p. 533) states the problem of inter-individual differences quite clearly with his often quoted remark, “one man’s ‘rarely’ is another man’s ‘hardly ever”’.Bradburn and Miles
(1979, p. 94) described with a compelling example intra-individual differences: “The mean response for ‘sometimes’ in the shooting in Hollywood westerns context is higher than the mean response for ‘very often’ in the context of earthquakes.” For survey methodology, the meaning of vague quantifiers is of particular interest, as we infer from frequency statements in questionnaires the validity of theories.1
The goal of our study is to improve our understanding of respondents’ interpretation of probability expressions. Such interpretations have two aspects; first the perception and second the communication of probabilities. We conducted two analyses with a focus on subjective probabilities to become a victim of crime. In our first analysis, we demonstrate the sensitivity of subjective perceptions of victimization probabilities. We show that subjective victimization probabilities are prone to framing-effects. Our second analysis focuses on the communication of victimization probabilities. Here, we show that the framing of victimiza-tion scenarios has an impact on the meaning of vague quantifiers. In particular, we show that the frame of reference determines the mapping of probabilities. This effect can mainly be explained by the different frequency of the particular event: ‘To become a victim’ is rarer than ‘not to become a victim’. We argue withBradburn and Miles(1979, p. 94) that for rare incidents, often refers to lower frequencies than for common incidents.
We analyze two aspects of survey responses: First, we analyze wording effects for dif-ferent frames of victimization scenarios in terms of gains versus losses. Second, we analyze the meaning of probability statements via mapping the vague quantifiers to numeric expres-sions. Our findings can be applied to various fields of interest, for instance to medicine. It is known (Edwards et al. 2001;Welkenhuysen et al. 2001;Peters et al. 2006) that the chosen frame of communicating health risks (e.g. the probability of suffering from side effects or the probability of cancer) influences patients’ decisions for or against preventive medical checkups.2
1One example for the usage of vague quantifiers can be found in the British Crime Survey: “First, how likely
do you think your home is to be burgled in the next year? (…) And how likely do you think you are mugged or robbed in the next year?” Possible answer categories are: Very likely, fairly likely, fairly unlikely and very
unlikely (British Crime Survey 2004/2005).
2Depending on whether losses in terms of side effects or gains in terms of being spared of cancer are stressed,
2 Literature review
2.1 Communication of probabilities
Like in every-day language, vague quantifiers are also used in scientific studies. For instance, people are asked to specify the frequency of certain behaviour with often, frequently, seldom and never, as “how often have you been happy in the past week?” However, the usage of
vague quantifiers often implies biased comparability of item responses (Schnell and Kreuter 2000;Kreuter 2002, pp. 226–229). Nevertheless, they are still applied despite the availability of alternatives such as measurement via numerical frequency scales. So why is it that we still use vague quantifiers instead of asking for the precise value?
First of all it can be said that vague quantifiers are the natural answer to many questions (Wallsten et al. 1993). The question about the rate of happiness in the past week is difficult to answer with precise frequency measures. Thus, interviewees prefer to answer such ques-tions verbally and not numerically (Moxey and Sanford 2000). In contrast, it is preferred to receive information numerically (Budescu and Wallsten 1995, p. 298). If interviewees are nevertheless asked to quantify their answers, most answer the question after some time of reflection. Only very few refuse an answer (Bradburn and Miles 1979, p. 95). However, precise quantitative evaluations are difficult and require high cognitive efforts (Peters et al. 2006, p. 46). Thus, much time and concentration is needed for the interview. In addition, it occurs that in fact there is no precise answer but the respondent makes up the quantitative information randomly (Conrad et al. 1998, p. 363). Furthermore, answers to retrospective questions are influenced by the respondents’ strategy to derive an exact answer (Conrad et al. 1998). Depending on the nature and the frequency of the incident, the respondent counts his experiences, makes an extrapolation or generates a number from the data known to him from other sources. However, it is not apparent to the interviewer, which strategy was chosen for which question. As a consequence, the precision of the information remains uncertain.
As numeric answers often suggest an artificial degree of precision, which is not reflected by respondents’ characteristics, it seems more adequate to use vague quantifiers—if we only knew what they meant. If it was known which vague quantifier is related to which numeric value, it would be possible to use the more comprehensible method of vague quantifiers in surveys and to translate their meaning afterwards into quantitative information. The mapping method serves this purpose in allocating numeric values to vague quantifiers (Wright et al. 1994, p. 481).
The theoretical foundation of the mapping method is the concept of membership
functions (Hammerton 1976). In particular, it is assumed that verbal probability expres-sions are imprecise concepts, which can be represented by numeric probabilities between 0 and 1. The membership function for a specific verbal expression assigns a number to each value between 0 and 1. This number defines the degree of consis-tency between the verbal expression and the numeric probability: “Probability phrases are vague concepts and (…) different numerical probabilities in the [0, 1] range are repre-sented to various degrees in these concepts. (…) The membership function of any given phrase assigns a number to each value on the probability line [0, 1] that represents its degree of membership in the concept defined by the phrase.” (Karelitz and Budescu 2004, p. 27).
Early studies assumed for each verbal expression only one membership function (Hammerton 1976). But soon, it was realized that membership functions and mapping tech-niques can be largely influenced by various factors. Psychological studies often emphasize the importance of the context.Goocher(1965) argues that mapping depends on respondents’
affection for the object. The more respondents like an event or an object, the smaller the frequency expressions used.Pepper and Prytulak(1974) andMoxey and Sanford(1993);
Moxey and Sanford(2000) demonstrate the effect of base rate expectations: “In particular, if an event has a high base-rate expectation, such as people enjoying parties, then the val-ues assigned to (say) many in many people enjoyed the party is higher than it is for a low baserate expectation (as in many of the doctors in the hospital were female).” (Moxey and Sanford 2000, p. 241). Furthermore,Schwarz et al.(1985) stress the impact of scaling. If the lower part of the scale is subdivided into many subtle categories, respondents state lower TV consumption compared to if the upper part of the scale is strongly subdivided.3Finally,
Hörmann(1983) andNewstead and Coventry(2000) show that the size of the particular object in the question matters: “[A] few people in front of a building meant more than a few
people standing in front of a hut” (Newstead and Coventry 2000, p. 244).
So far, we dealt with cases for which the interpretation of vague quantifiers affects all respondents similarly. However, cases are even more problematic in which the interpretation of vague quantifiers affects particular groups differently. It is possible that regression esti-mates of group differences for particular opinions or attitudes are not due to actual group differences in these opinions but to group differences in interpreting the scales.Schaeffer
(1991) could demonstrate such an effect. She asked black and white respondents to specify their frequency of being bored. When using numeric values, she found no differences. How-ever, when asked with vague quantifiers, black respondents answered to be more frequently bored than white respondents. Furthermore,Nakao and Axelrod(1983) show such group differences between doctors and patients in interpreting verbal frequency expressions like “infrequent” or “not frequently”. Finally,King et al.(2004) demonstrate cultural differences in using response scales.
Wänke(2002) highlighted the importance of reference groups. Students who compare themselves with the entire population, estimate the frequency of going to the cinema higher than those comparing themselves to other students. Likewise, the field of reference matters. “For example, when judging how often one goes to the movies, the response may depend on whether one compares this behaviour to the frequency one attends poetry readings or watches TV.” (Wänke 2002, p. 302).
Wright et al.(1994) categorize the various factors of differential mapping effects into two classes. On the one hand, mapping depends on information from own experiences. When asked to assign numeric values to the undefined adjectives very young, young, old, very old, respondents’ own age influences their answers. This assumption is called the
self-informa-tion-hypothesis. On the other hand, mapping is influenced by characteristics of the social
group, i.e. behaviour or language.Wright et al.(1994) illustrate this point with a vivid exam-ple. Consider two isolated villages, where the inhabitants are asked for their height by using vague quantifiers. Let us assume that the height of the people in the first village is 1.80 m, and in the other village, all people are 1.90 m tall. Naturally, every respondent who is requested to estimate her height compares herself to the known others in her village and concludes that she has an average height. Conclusively, everybody categorizes herself in the middle of the scale. Thus, the usage of vague quantifiers leads to the result that inhabitants of both villages are estimated to have the same height—which is not the case. The idea, that membership in
3Comparable effects as those for asking about the frequency of television consumption were observed for
other behavioural patterns such as sexual behaviour or consumer behaviour (Schwarz and Scheuring 1988; Menon et al. 1995). In addition, similar effects occurred when patients reported their rate of suffering from physical symptoms (Schwarz and Scheuring 1992).
social groups affects mapping is known as the group-norm-hypothesis.Wright et al.(1994) confirm both hypotheses in their study on TV consumption.4
2.2 Perception of probabilities
We know that the subjective perceptions of probabilities are prone to presentational effects.
Tversky and Kahneman(1981) describe in their classic study on framing two alternative scenarios for fighting an epidemic; a safe and a risky one. In one case, the result is described in terms of saved lives, in the other in terms of lives lost. Although both scenarios have the same statistical expectation value and are formally equivalent, respondents choose the risky option when confronted with the loss-frame (number of lives lost), and the safe option when confronted with the gain-frame (number of lives saved).
Prospect theory (Kahneman and Tversky 1979) suggests that a different point of reference is induced if a decision problem is presented in terms of gains compared to losses. Thus, the reference point differs between decisions which focus on gains and decisions which focus on losses. The first assumption in prospect theory states that the value function is concave for gains and convex for losses. The second assumption is that the value function is steeper for losses than for gains. It can be inferred from these properties that an event with the same probability of occurrence is psychologically more relevant in the loss-frame compared to the gain-frame. In other words: To suffer from a particular loss with a likelihood of 5% is more relevant than the chance of being spared from the same loss with a likelihood of 95%.
McNeil et al.(1982) could demonstrate this effect in clinical settings. Patients had to decide whether they preferred a safe radio therapy or rather a risky surgery. In one condition, the likelihoods were presented in terms of death rates and in the other condition in terms of survival chances. If risks were presented in terms of death rates, fewer patients chose the risky surgery, compared to when risks were presented in terms of survival chances. For an overview of such framing effects in medical research seeMarteau(1989),Banks et al.(1995) andEdwards et al.(2001).
Moxey and Sanford(2000) show similar effects for consumption decisions. The respon-dents were given two logically equivalent options to choose from—for instance 95% fat free yoghurt and yoghurt containing 5% fat. Most favour the 95% fat free yoghurt. It is argued that the wording causes this effect—in one case, the focus is on the positive aspect (fat free), in the other case, the attention is drawn to the negative aspect. The result that logically equivalent expressions are evaluated differently was already confirmed byReyna(1981). She investi-gated the effect of negations of modal adjectives (e.g. probably or possibly). It could be shown that formal negations do not automatically imply complementary numerical estimations.5
3 Subjective perceptions of victimization probabilities 3.1 Hypotheses
We can derive the following hypotheses by applying the former reasoning to subjective probability estimates of victimizations: Respondents prefer to face a situation with a 95%
4When respondents are first asked about the frequency of television consumption of the “typical other person”
and afterwards about their own consumption behaviour, they state higher frequencies compared to the reversed order of questions.
5Note that for the construction of scales, the negations by means of an affix (improbable) are stronger than
probability of not becoming a victim of crime compared to a situation with a 5% probability to become a victim of crime. We argue that the optimism in the gain frame is due to a relatively lower subjective victimization probability, compared to the loss frame. As a consequence it is expected that the probability of being spared of victimization (gain frame) is downgraded such that it corresponds subjectively with the probability to become a victim of crime (loss frame). For example, the feeling of security for facing a ‘90% likelihood of being spared’ might be psychologically equivalent to a ‘5% likelihood to become victim of crime’. We summarize our reasoning in our first hypothesis:
Hypothesis 1 The subjective victimization probability will be higher in the gain frame (being spared of a crime) compared to the loss frame (become a victim of crime).
3.2 Method
We conducted an experimental survey in the German city Leipzig in August 2006. We asked 95 taxi drivers and 96 waiters (N=191) for an estimate of their probability to become a victim of crime. We presented short scenarios for five different sorts of crime, in particular for being involved in a car accident, bill-dodging, theft, robbery and murder. We chose taxi drivers and waiters because both groups do their job in public and thus both are exposed to a higher risk of victimization. The respondents were selected by a two-stage sample, with taxi stands and restaurants as the first stage and respondents as the second stage. We drew a random sample of the list of all taxi stands from the taxi cooperation in Leipzig. At each of the taxi stands, we approached the second taxi in the row, and repeated this process for every second taxi in the row. To select the waiters, we took a random sample from the list of the IHK Leipzig (industry and trade organization Leipzig), containing all registered restaurants. We used the last birthday method to select the waiters in a restaurant. The two versions of the questionnaire were randomized.
Four interviewers conducted oral face-to-face interviews with two versions of the stan-dardized questionnaire, which differed in the frames of presenting the probabilities. We asked half of the respondents to estimate their probability to become a victim of crime (loss-frame), while the other half was asked to estimate the probability of being spared of a crime (gain frame). Furthermore, the questionnaire contained a control question for the victimization ‘robbery’. The control group had to respond the question twice in the loss frame and the experimental group had to respond the question once in the loss-frame and once in the gain-frame (intra-individual variation of the gain-frame). In addition, respondents had first to evaluate their probabilities on a verbal scale using vague quantifiers and then on numerical scales (see Table1). With the combination of vague quantifiers and numerical answers, we can apply the mapping methodology and estimate response functions. Response functions relate the verbal expressions on the x-axis with the numerical expressions on the y-axis. We asked for responses for both the vague quantifiers and the numerical values in the questionnaire twice. About 5 min elapsed between the two blocks of questions.
3.3 Results
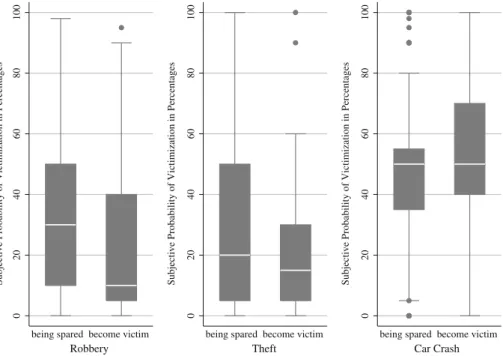
First, we demonstrate framing-effects on numerical scales for subjective probabilities of victimization. We compare the distribution of numerical victimization probabilities in the gain-frame with the respective distribution in the loss-frame. We analyze the offences theft, robbery and car accident (question 9) (Fig.1).
The data confirm hypothesis1for the offences robbery and theft: Respondents estimate higher victimization probabilities in the gain-frame, compared to the loss frame. For further
Table 1 Items of the questionnaire
Question 1 First I would like to talk with you about your personal exposure to danger. I will present you different situations and would like to ask you to estimate your likelihood that you get involved in such a situation within the next 12 months. You find the scenarios on the following cards.
How likely do you think is it that within the next 12 months … a customer disappears without having paid?
… someone threatens you with violence in order to get your money or your valuables? … someone kills you?
Question 9
Version 1 How likely do you think is it that you are spared of the following situation (...) within the next twelve months? (...) How likely do you think is it that you do not get involved into the following situation?
Version 2 How likely do you think is it that you come across the following situation (...) within the next twelve months? How likely do you think is it that you get involved into the following situation?
… a customer steals your purse and disappears.
… someone threatens you with violence in order to get your money or your valuables. … another road user ignores your right of way and causes a crash.
Answer 1—By no means, 2—very unlikely, 3—unlikely, 4—partly unlikely, partly likely, 5—likely, 6—very likely
Please also indicate the likelihood in terms of percentages.
The items and answer scales were originally posed in German. Here, we show the English translation
0 20 40 60 80 100 S u bjective P robability of Victimization in P ercenta g es
being spared become victim
Robbery 0 20 40 60 80 100 S u bjective P robability of Victimization in P ercenta g es
being spared become victim
Theft 0 20 40 60 80 100 S u bjective P robability of Victimization in P ercenta g es
being spared become victim
Car Crash
Fig. 1 Boxplots show the distribution of numerical probability estimates for both frames (being spared versus
become victim) for each offence. In the gain-frame, reversed probabilities (100- p) are shown to allow for direct comparisons. Analyses refer to question 9
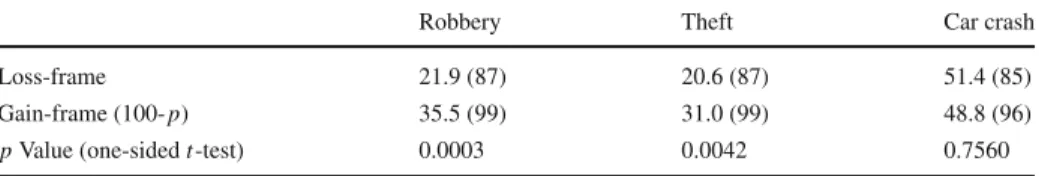
Table 2 Arithmetic mean of subjective probability estimates for different victimizations (N in brackets)
Robbery Theft Car crash
Loss-frame 21.9 (87) 20.6 (87) 51.4 (85)
Gain-frame (100- p) 35.5 (99) 31.0 (99) 48.8 (96)
p Value (one-sided t-test) 0.0003 0.0042 0.7560
comparisons and for significance tests, we compare arithmetic means (see Table2). For the offences robbery and theft, probability estimates in the gain frame differ from those in the loss-frame in the expected direction. For instance, the mean chance of being robbed is 35.5 % in the gain frame compared to 21.9 % in the loss-frame ( p< 0.01). For theft, hypothesis1can be confirmed as well ( p< 0.01). However, for the offence car accident, hypothesis1cannot be confirmed. The values are very close to each other (51.4 % in the loss frame versus 48.8 % in the gain frame). This might be due to the fact that car accidents are very frequent events. In summary, we can confirm hypothesis1for the offences robbery and theft. Respondents perceive higher victimization probabilities if asked for being spared of crimes compared to become a victim of crime.
4 Communication of victimization probabilities 4.1 Hypotheses
Our first study demonstrated that the frame of reference affects the perception of victim-ization probabilities. Now, we elaborate our findings in a second study. We show that the frame of reference affects the communication of victimization probabilities. Thus, we argue that the framing of risks affects both the perception and the communication of probabilities. Differences in the communication of risks can be represented such that the verbal expressions “likely” or “unlikely” have different meanings in different situations. Therefore, we study variation in the assignment of numerical values to vague quantifiers. We argue that respon-dents assign lower numerical values for rarer incirespon-dents than for more frequent incirespon-dents.
Bradburn and Miles(1979, p. 94) already speculated that “in short ‘often’ for an improbable event is less than ‘often’ for a highly probable event.” In our case, we make use of our dif-ferent versions of the questionnaires for gains and for losses. These two versions represent a randomization of different frequencies of events. The event to become a victim of a
partic-ular crime is rarer than the event to be spared of the same crime. Consequently, we analyze
whether respondents assign different numerical values to the same vague quantifiers (e.g. likely) in the gain-frame compared to the loss-frame. Respondents are expected to assign to the event ‘become a victim of robbery’ lower numerical values compared to the event ‘being spared of robbery’.6We formulate hypothesis2as follows:
6The frequency effect can be derived from Grice’ logic of conversation (Grice 1993). Here, it is assumed
that the respondent answers in accordance with the principle of relevance and with reference to the cate-gory of relation. When the respondent is asked to estimate the probability to become a victim of robbery in terms of absolute probabilities, the expected answer will be around “very unlikely”. As other respondents will give a similar answer, this information would not be relevant. Following Grice’ reasoning, the respondent rather assumes that her probability estimate in relation to all other respondents’ estimates will be of interest. Therefore, the respondent will anchor the answer scale at her assumed average probability and adjust her own subjective probability accordingly. For a more detailed description of the “anchoring and adjustment heuristic”
Hypothesis 2 In the gain-frame (e.g. being spared of robbery), a particular verbal answer category (e.g. likely) corresponds with higher numerical probabilities than in the loss-frame (e.g. become a victim of robbery).
In a consecutive step, we analyze whether the response functions decrease with the severity of the offence. In other words, we argue that for more severe offences, a “likely” victimization refers to lower probabilities than for less severe offences.
Hypothesis 3 With increasing severity of the offence, the slope of the response functions between vague quantifiers and numerical values decreases.
For example, we expect that respondents mean with “likely” lower likelihoods, when they refer to becoming a victim of murder compared to becoming a victim of bill-dodging.7 4.2 Frequency of victimizations and communication patterns
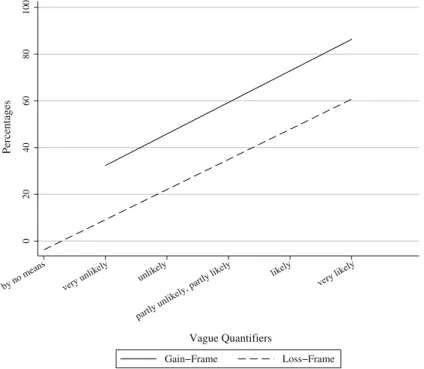
We estimate six linear bivariate OLS-regressions. We map the verbal probability statements on the numeric percentage scales for the victimizations robbery, theft and car crash (question 9). We estimate the regressions separately for the gain- and for the loss-frame. We plot the resulting response functions graphically for each victimization (Wright et al. 1994, p. 481).8 The x-axis represents the verbal answer scales and the y-axis the values of the percentage scales.
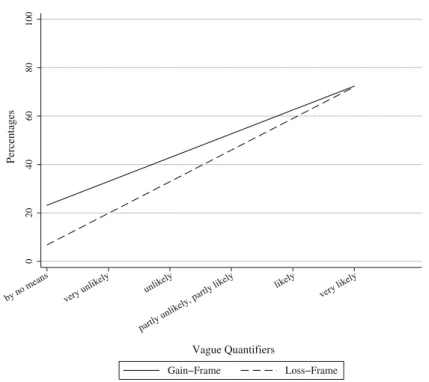
We can confirm hypothesis 2for all victimizations. In the gain-frame (thus the more frequent event), vague quantifiers correspond to higher likelihoods than in the loss-frame, as shown in Figs.2,3, and4. For theft and robbery, we observe considerable differences between 20 and 25% for the two respective response functions. We refer to Tables3,4,5,6,
7, and8for exact values of the regression estimates (see Appendix).
So far, we investigated inter-personal effects. However, the intra-personal test reveals even greater magnitude. Here, the same respondent estimates twice her likelihood to become a victim of robbery; once for gains and once for losses. We randomly allocated two groups to two different conditions. The experimental group had to estimate the likelihood to become a victim of robbery first (question 1, loss-frame). After some questions, they were asked to evaluate their likelihood of being spared to become a victim of robbery (question 9, Footnote 6 continued
seePeters et al.(2006). Note that this answering process is independent of the frequency of the event and can be applied to numerical as well as to verbal answer scales. However, when using a verbal scale, the focus is on qualitative considerations (Zimmer 1983;Budescu and Wallsten 1995, p. 303). If the own probability is evaluated in relation to the expected average probability of the others and this average probability is anchored to the midpoint of the answer scale, a relevant and relational answer is possible for both, the frequent event (‘being spared of robbery’) and the rare event (‘become victim of robbery’). In case of the numerical scale, quantitative considerations are primarily of interest. Therefore, the anchor for frequent events (‘being spared of robbery’) is set higher than for rare events (‘become victim of robbery’). This explains the frequency effect in the mapping-analysis.
7The two dimensions ‘frequency’ and ‘severity’ of an offence could not be manipulated independently of
each other. In order to exclude a possible confounding of the two effects, applications that enable to separate both manipulations could be developed in future studies. A conceivable possibility in medicine would be to analyze different types of cancer in order to manipulate ‘frequency’ (disease risk) and ‘severity’ (mortality risk) independently of each other. For a more detailed discussion of this subject in the medical context see Weber and Hilton(1990);Merz et al.(1991);Sutherland et al.(1991), andBudescu and Wallsten(1995, p. 294).
8In their study on mapping of vague quantifiers,Wright et al.(1994) also compute OLS regressions and
0 20 40 60 80 100 P ercenta g es
by no means very unlikely unlikely
partly unlikely, partly likel y likely very likely Vague Quantifiers Gain−Frame Loss−Frame
Fig. 2 Inter-personal framing for robbery (question 9). The solid regression line represents the response
function for the gain frame (being spared of robbery) and the dashed line for the loss frame (become victim of robbery) 0 20 40 60 80 100 P ercenta g es by no means very unlikely unlikely partly unlikely, partly likely likely very likely Vague Quantifiers Gain−Frame Loss−Frame
Fig. 3 Inter-personal framing for theft (question 9). The solid regression line represents the response function
0 20 40 60 80 100 P ercenta g es by no means very unlikely unlikely partly
unlikely, partly likely
likely
very likely
Vague Quantifiers
Gain−Frame Loss−Frame
Fig. 4 Inter-personal framing for car accident (question 9). The solid regression line represents the response
function for the gain frame (being spared of a car accident) and the dashed line for the loss frame (become victim of a car accident)
0 20 40 60 80 100 P ercenta g es by no means very unlikely unlikely partly
unlikely, partly likely
likely
very likely
Vague Quantifiers
Loss−Frame Gain−Frame
Fig. 5 Intra-personal framing for robbery in the experimental condition. The solid regression line represents
the response function for the gain frame (being spared of a robbery) in question 9 and the dashed line represents the response function for the loss frame (become victim of robbery) in question 1
0 20 40 60 80 100 P ercenta g es by no means very unlikely unlikely partly
unlikely, partly likel
y
likely
very likely
Vague Quantifiers
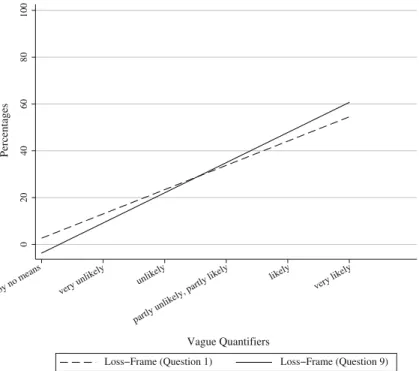
Loss−Frame (Question 1) Loss−Frame (Question 9)
Fig. 6 Intra-personal framing for robbery in the control condition. The solid regression line represents the
response function for the loss frame (become victim of robbery) in question 9 and the dashed line represents the response function for the loss frame (become victim of robbery) in question 1
0 20 40 60 80 100 P ercenta g es by no means very unlikely unlikely partly
unlikely, partly likely
likely very likely Vague Quantifiers Bill−dodging Robbery Murder
gain-frame). The control group answered twice the question to become victim of crime (question 1 and 9 twice in the loss-frame). We report differences in response functions in Figs.5and6.
The same respondent assigns higher percentages to equivalent verbal probability expres-sions in the gain-frame compared to the loss-frame. In contrast, persons who answered the same question twice in the loss-frame gave consistent answers. Thus, results for hypothesis2
can be confirmed with intra-personal tests as well. We conclude that respondents commu-nicate with identical vague quantifiers higher subjective probabilities in cases of frequent incidents compared to rare events. With increasing frequency of the events, the intercepts of the response functions shift upwards.
4.3 Severity of victimizations and communication patterns
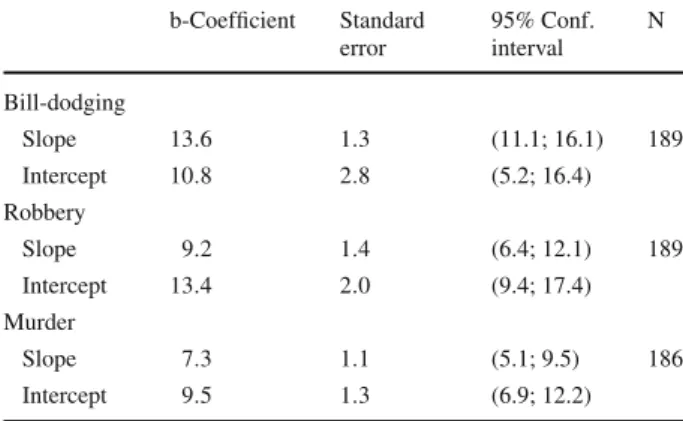
In hypothesis3we argue that with increasing severity of the offence, the slope of the response function between vague quantifiers and numerical values decreases. We confirm hypothesis3
with our analysis visualized in Fig.7: With increasing severity, measured by the particular kind of victimization, (ascending: bill-dodging, robbery, murder), identical verbal likelihood expressions correspond to lower numerical probabilities. The slopes for the response func-tions are as follows: Bill-dodging: b=13.6; robbery: b=9.2; murder: b=7.3. For more details, see Tables3,4,5,6,7, and8in the Appendix.
Comparisons between different offences reveal that respondents mean different likeli-hoods by similar verbal probability expressions. For example, “very likely” to become a victim of murder states a lower likelihood than “very likely” to become a victim of bill-dodg-ing. In particular, the verbal label “very likely” for murder refers to a likelihood lower than 40% compared to the verbal label “very likely” for bill-dodging, which refers to a likelihood higher than 60%.
5 Discussion
The frame of reference has great impact on the perception and communication of probability statements. We demonstrate a wording effect on subjective probability estimates. Respon-dents give different estimates for personal victimizations if survey questions are worded differently. The subjective probability estimates differ depending on whether respondents are asked for the risk to become a victim of a particular crime or for the risk of being spared of a particular crime. Furthermore, we show that the same verbal probability expressions have different meanings in different situations. On the one hand, “likely” refers to lower probabilities in cases of rarer events (‘become victim’) compared to more frequent events (‘being spared’). On the other hand, a “likely” victimization refers to lower probabilities in cases of more severe victimizations compared to less severe victimizations.9
In conclusion, direct comparisons between proportions of different victimizations on cat-egorical answer scales can be regarded as problematic, because interpretations of answer categories depend on the wording, the frequency and the severity of the offence. Thus,
9In the pretest of our instrument, investigations of respondents’ answering strategies on the basis of
qual-itative interviews (N= 12) showed that victimization probabilities for frequent offences (e.g. bill-dodging) in the preceding year were derived from the rate of personal victimizations in the past year. However, in the case of rare offences, respondents rather oriented themselves at victimizations of other people. For example, in the case of murder, newspaper articles were used for comparisons. Future studies could investigate these answering strategies in more detail.
survey answers are prone to biases in perception and communication of probabilities. For example, respondents mean lower probabilities when they communicate their risk to become a victim of murder as “very likely” compared to communicating their risk to become a victim of robbery as “very likely”. However, for direct comparisons between different subjective victimization risks, respondents have to use verbal answer categories consistently: A “very likely” robbery should refer to similar probabilities as a “very likely” murder. This assumption is not empirically met and thus individual and group differences for different risk evaluations are not detectable if differences are only estimated by verbal answer categories.
A promising alternative to verbal answer scales are frequency formats in order to capture subjective victimization risks. Frequency formats are based on findings of cognitive psychol-ogy, according to which the presentation and communication of statistical information in form of frequencies is more intuitive and understandable than alternative forms of presentation such as probabilities and percentages: “Natural frequencies facilitate inferences because they carry implicit information about base rates (…). They also correspond to the way in which humans have experienced statistical information over most of their history.” (Hoffrage et al. 2000, p. 2261). A known problem is the subjective overestimation of risks associated with rare events (fictitious example: “How likely is it that a randomly selected person from your neighborhood will become a victim of a robbery during the next 12 months?”). Formulating items to measure subjective risks in terms of frequencies encourages distributional thinking and results in more realistic estimates of the base rate (fictitious example: “Imagine 1000 people from your neighborhood. How many of these people will become a victim of a rob-bery during the next 12 months?”). AsTeigen(1974) andBeuer-Krüssel and Krumpal(2009) show, subjective overestimation of small probabilities decreases when respondents estimate risks in frequencies rather than probabilities.Coutts(2002) points out that frequency for-mats (“distributional perspective”) lead to more realistic, lower estimates of offence-specific victimization risks than other formats (“singular perspective”).
Further research could investigate differences in framing-effects for verbal and numerical scales. It can be argued that context effects should be even stronger for verbal scales (Moxey and Sanford 2000, p. 238;Welkenhuysen et al. 2001). However, results are contradictory.
Jasper et al.(2001) reported only significant framing effects for numerical scales. It would be interesting to investigate this interaction effect in more depth to improve our understanding of survey responses in general. Such better understanding would enhance better informed and substantiated choices of verbal versus numerical response scales. In medicine, for example, the usage of verbal answer categories is widely rejected (Nakao and Axelrod 1983). As a consequence, most articles in this area deal with advantages and disadvantages of different numerical scales.Ghosh and Ghosh(2005) reviewed results from 52 studies. 17 studies dealt with the question whether students of medicine and doctors could correctly interpret and communicate probabilities: “Physicians demonstrate widely varying understanding of prob-ability terms and NNT [number needed to treat].” (Ghosh and Ghosh 2005, p. 178) Even greater problems were documented for patients in the remaining 35 studies. In contrast, in some studies, verbal scales yield better results than numerical scales.Woloshin et al.(1999) reported that women estimate their risk of breast cancer more realistically with verbal com-pared to numerical scales. Women drastically overestimated their risk of breast cancer with numerical scales. Finally,Windschitl and Wells(1996, p. 343) conclude that both, verbal and numerical scales bear several advantages: “Results suggest that numeric measures tend to elicit deliberate and rule-based reasoning from respondents, whereas verbal measures allow for more associative and intuitive thinking”.
Appendix
Bivariate linear OLS-regressions were estimated. For each victimization, the verbal answer category scale is regressed on the numeric percentage scale.
Table 3 Response functions of
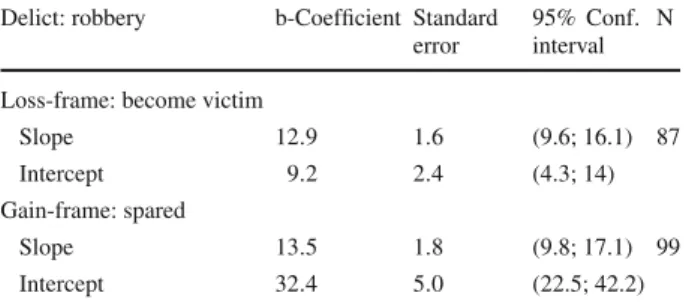
inter-personal framing, robbery (see Fig.2)
Delict: robbery b-Coefficient Standard error
95% Conf. interval
N
Loss-frame: become victim
Slope 12.9 1.6 (9.6; 16.1) 87
Intercept 9.2 2.4 (4.3; 14)
Gain-frame: spared
Slope 13.5 1.8 (9.8; 17.1) 99
Intercept 32.4 5.0 (22.5; 42.2)
Table 4 Response functions of
inter-personal framing, theft (see Fig.3)
Delict: theft b-Coefficient Standard error
95% Conf. interval
N
Loss-frame: become victim
Slope 9.7 1.5 (6.7; 12.8) 87
Intercept 12.8 2.2 (8.3; 17.2)
Gain-frame: spared
Slope 14.2 1.7 (10.9; 17.5) 99
Intercept 32.7 4.8 (23.1; 42.3)
Table 5 Response functions of
inter-personal framing, car accident (see Fig.4)
Delict: car accident b-Coefficient Standard error
95% Conf. interval
N
Loss-frame: become victim
Slope 13.1 1.6 (9.8; 16.3) 85
Intercept 19.9 4.4 (11.1; 28.6)
Gain-frame: spared
Slope 9.8 1.6 (6.7; 13) 96
Intercept 33 3.6 (25.9; 40.2)
Table 6 Response functions
of intra-personal framing, experimental-condition (see Fig.5)
Delict: robbery b-Coefficient Standard error
95% Conf. interval
N
Loss-frame: become victim
Slope 8.0 2.0 (4; 11.9) 100
Intercept 13.7 2.6 (8.4; 18.9)
Gain-frame: spared
Slope 13.5 1.8 (9.8; 17.1) 99
Table 7 Response functions
of intra-personal framing, control-condition (see Fig.6)
Delict: robbery b-Coefficient Standard error
95% Conf. interval
N
Loss-frame: become victim
Slope 10.4 2.1 (6.2; 14.5) 89
Intercept 13.0 3.2 (6.7; 19.3)
Loss-frame: become victim
Slope 12.9 1.6 (9.6; 16.1) 87
Intercept 9.2 2.4 (4.3; 14)
Table 8 Response functions of
offence specific mapping, loss-frame (see Fig.7)
b-Coefficient Standard error 95% Conf. interval N Bill-dodging Slope 13.6 1.3 (11.1; 16.1) 189 Intercept 10.8 2.8 (5.2; 16.4) Robbery Slope 9.2 1.4 (6.4; 12.1) 189 Intercept 13.4 2.0 (9.4; 17.4) Murder Slope 7.3 1.1 (5.1; 9.5) 186 Intercept 9.5 1.3 (6.9; 12.2) References
Banks, S.M., Salovey, P., Greener, S., Rothman, A.J., Moyer, A., Beauvais, J., Epel, E.: The effects of message framing on mammography utilization. Health Psychol. 14, 178–184 (1995)
Beuer-Krüssel, M., Krumpal, I.: Der Einfluss von Häufigkeitsformaten auf die Messung von subjektiven Wahrscheinlichkeiten. Methoden, Daten Und Analysen: Zeitschrift für empirische Sozialforschung 3, 31– 57 (2009)
Bradburn, N., Miles, C.: Vague quantifiers. Public Opin. Quart. 43, 92–101 (1979)
Budescu, D., Wallsten, T.S.: Processing linguistic probabilities: general principles and empirical evidence. In: Busemeyer, J., Medin, D.L., Hastie, R. (eds.) Decision Making from a Cognitive Perspective, pp. 275– 318. Academic Press, San Diego (1995)
Conrad, F.G., Brown, N., Cashman, E.: Strategies for estimating behavioural frequency in survey inter-views. Memory 6, 339–366 (1998)
Coutts, E.: Context effects in the measurement of subjective probabilities in surveys. Master Thesis, Depart-ment of Psychology, University of Konstanz (2002)
Edwards, A., Elwyn, G., Covey, J., Matthews, E., Pill, R.: Presenting risk information—a review of the effects of “framing” and other manipulations on patient outcomes. J. Health Commun. 6, 61–82 (2001) Ghosh, A.K., Ghosh, K.: Translating evidence-based information into effective risk communication: current
challenges and opportunities. J. Lab. Clin. Med. 145, 171–180 (2005). doi:10.1016/j.lab.2005.02.006 Goocher, B.E.: Effects of attitude and experience on the selection of frequency adverbs. J. Verbal Learn. Verbal
Behav. 4, 193–195 (1965)
Grice, H.P.: Logik und Konversation. In: Meggle, G. (ed.) Handlung, Kommunikation, Bedeutung, pp. 243–265. Suhrkamp-Verlag, Frankfurt am Main (1993)
Hakel, M.D.: How often is often?. Am. Psychol. 25, 533–534 (1969) Hammerton, M.: How much is a large part?. Appl. Ergonom. 7, 10–12 (1976)
Hoffrage, U., Lindsey, S., Hertwig, R., Gigerenzer, G.: Communicating statistical information. Science
Hörmann, H.: The calculating listener, or how many are einige, mehrere und ein paar. In: Bauerle, R., Schwarze, C., von Stechow, A. (eds.) Meaning, Use and Interpretation of Language, pp. 221–234. De Gruyter, Berlin (1983)
Jasper, J., Goel, R., Einarson, A., Gallo, M., Koren, G.: Effects of framing on teratogenic risk perception in pregnant women. Lancet 358, 1237–1238 (2001)
Kahneman, D., Tversky, A.: Prospect theory: an analysis of decision under risk. Econometrica 47, 263–291 (1979)
Karelitz, T.M., Budescu, D.: You say “probable” and I say “likely”: improving interpersonal communication with verbal probability phrases. J. Exp. Psychol. Appl. 10, 25–41 (2004). doi:10.1037/1076-898X.10.1. 25
King, G., Murray, C.J.L., Salomon, J.A., Tandon, A.: Enhancing the validity and cross-cultural comparability of measurement in survey research. Am. Polit. Sci. Rev. 98, 191–207 (2004)
Kreuter, F.: Kriminalitätsfurcht: Messung und methodische Probleme. Leske & Budrich, Opladen (2002) Marteau, T.M.: Framing of information: its influence upon decisions of doctors and patients. Br. J. Soc.
Psychol. 28, 89–94 (1989)
McNeil, B.J., Pauker, S.G., Sox, H.C., Tversky, A.: On the elucidation of preferences for alternative thera-pies. New Engl. J. Med. 306, 1259–1262 (1982)
Menon, G., Raghubir, P., Schwarz, N.: Behavioral frequency judgments: an accessibility-diagnosticity frame-work. J. Consumer Res. 22, 212–228 (1995)
Merz, J.F., Druzdzel, M.J., Mazur, D.J.: Verbal expressions of probability in informed consent litigation. Med. Decis. Mak. 11, 273–281 (1991)
Moxey, L.M., Sanford, A.J.: Prior expectation and the interpretation of natural language quantifiers. Eur. J. Cogn. Psychol. 5, 73–91 (1993)
Moxey, L.M., Sanford, A.J.: Communicating quantities: a review of psycholinguistic evidence of how expres-sions determine perspective. Appl. Cogn. Psychol. 14, 237–255 (2000)
Murakami, H.: South of the Border, West of the Sun. Vintage, New York (2000)
Nakao, M.A., Axelrod, S.: Numbers are better than words—verbal specifications of frequency have no place in medicine. Am. J. Med. 74, 1061–1065 (1983)
Newstead, S.E., Coventry, K.R.: The role of context and functionality in the interpretation of quantifiers. Eur. J. Cogn. Psychol. 12, 243–259 (2000)
Pepper, S., Prytulak, L.S.: Sometimes frequently means seldom: context effects in the interpretation of quan-titative expressions. J. Res. Pers. 8, 95–101 (1974)
Peters, E., McCaul, K., Stefanek, M., Nelson, W.: A heuristic approach to understanding cancer risk perception: contributions from judgement and decision-making research. Ann. Behav. Med. 31, 45–52 (2006) Reyna, V.: The language of possibility and probability: effects of negation on meaning. Mem. Cogn. 9, 642–
650 (1981)
Schaeffer, N.C.: Hardly ever or constantly? Group comparisons using vague quantifiers. Public Opin. Quart. 55, 395–423 (1991)
Schnell, R., Kreuter, F.: Das DEFECT-Projekt: sampling-errors und nonsampling-errors in komplexen Bevölkerungsstichproben. ZUMA-Nachrichten 47, 89–101 (2000)
Schwarz, N., Hippler, H.J., Deutsch, B., Strack, F.: Response categories: effects on behavioural reports and comparative judgments. Public Opin. Quart. 49, 388–395 (1985)
Schwarz, N., Scheuring, B.: Judgments of relationship satisfaction: inter- and intraindividual comparison strategies as a function of questionnaire structure. Eur. J. Soc. Psychol. 18, 485–496 (1988)
Schwarz, N., Scheuring, B.: Selbstberichtete Verhaltens- und Symptomhäufigkeiten: Was Befragte aus Antwortvorgaben des Fragebogens lernen. Zeitschrift für Klinische Psychologie 22, 197–208 (1992) Simpson, R.H.: The specific meanings of certain terms indicating differing degrees of frequency. Quart. J.
Speech 30, 328–330 (1944)
Sutherland, H.J., Lockwood, G.A., Trichtler, D.L., Sem, F., Brooks, L., Till, J.E.: Communicating probabilistic information to cancer patients—is there “noise” on the line?. Soc. Sci. Med. 32, 725–731 (1991) Teigen, K.H.: Overestimation of subjective probabilities. Scand. J. Psychol. 15, 56–62 (1974)
Tversky, K.A., Kahneman, D.: The framing of decisions and the psychology of choice. Science 211, 453– 458 (1981)
Wänke, M.: Conversational norms and the interpretation of vague quantifiers. Appl. Cogn. Psychol. 16, 301– 307 (2002). doi:10.1002/acp.787
Wallsten, T.S., Budescu, D., Zwick, R., Kemp, S.M.: Preferences and reasons for communicating probabilistic information in numerical or verbal terms. Bull. Psychon. Soc. 31, 135–138 (1993)
Weber, E.U., Hilton, D.J.: Contextual effects in the interpretation of probability words—perceived base rate and severity of events. J. Exp. Psychol. Hum. Percept. Perform. 16, 781–789 (1990)
Welkenhuysen, M., Evers-Kiebooms, G., D’Ydewalle, G.: The language of uncertainty in genetic risk com-munication: framing and verbal versus numerical information. Patient Educ. Couns. 43, 179–187 (2001) Windschitl, P.D., Wells, G.L.: Measuring psychological uncertainty: verbal versus numeric methods. J. Exp.
Psychol. Appl. 2, 343–364 (1996)
Woloshin, S., Schwartz, L.M., Black, W.C., Welch, H.G.: Women’s perceptions of breast cancer risk: How you ask matters. Med. Decis. Mak. 19, 221–229 (1999). doi:10.1177/0272989X9901900301
Wright, D., Gaskell, G., O’Muircheartaigh, C.: How much is “Quite a bit”? Mapping between numerical values and vague quantifiers. Appl. Cogn. Psychol. 8, 479–496 (1994)
Zimmer, A.C.: Verbal versus numerical processing of subjective probabilities. In: Scholz, R.W. (ed.) Decision Making Under Uncertainty, pp. 159–182. Elsevier, Amsterdam (1983)