HAL Id: in2p3-00086857
http://hal.in2p3.fr/in2p3-00086857
Submitted on 20 Jul 2006
HAL is a multi-disciplinary open access
archive for the deposit and dissemination of
sci-entific research documents, whether they are
pub-lished or not. The documents may come from
teaching and research institutions in France or
abroad, or from public or private research centers.
L’archive ouverte pluridisciplinaire HAL, est
destinée au dépôt et à la diffusion de documents
scientifiques de niveau recherche, publiés ou non,
émanant des établissements d’enseignement et de
recherche français ou étrangers, des laboratoires
publics ou privés.
6-D beam dynamics studies in EMMA FFAG
F. Méot
To cite this version:
F. Méot. 6-D beam dynamics studies in EMMA FFAG. European Particle Accelerator Conference
(EPAC’06), Jun 2006, Edinburgh, United Kingdom. Joint Accelerator Conferences Website, EPAC
2006, pp.2080-2082, 2006. �in2p3-00086857�
6-D BEAM DYNAMICS STUDIES IN EMMA FFAG
EPAC06 Conference - Poster
F. M´eot, DAPNIA & LPSC, Grenoble
Abstract
We report on beam dynamics studies concerning the EMMA electron model of a muon non-scaling FFAG for the Neutrino Factory.
INTRODUCTION
EMMA (Electron Model of a Muon Accelerator) [1] is a design of a 10 to 20 MeV electron model of the lin-ear “fixed field alternating gradient” accelerators (FFAG in the following) proposed for the acceleration to 20 GeV of muons in the neutrino factory (NuFact) [2].
EMMA is supposed to accelerate an electron bunch with large transverse size (several 100π mm.mrad range, norm.) and large longitudinal emittance, based on a strongly non-linear out of bucket dynamics method (details are given in the following), with non-negligible coupling to transverse motion at large amplitude. From the point of vue of de-sign studies and optimization, this raises the question of correct beam dynamics simulations in presence of the non-linearities that affect particle motion : fringe fields, mul-tipolar defects in the lattice combined function (dipole + quadrupole) magnets, large amplitude motion.
For these reasons, we resort to stepwise ray-tracing. The goals of the present work are, to show the outcomes one can expect from ray-tracing means, to give preliminary results concerning large bunch dynamics in EMMA, and to estab-lish basis data and procedures for possible further studies concerning field and alignment defects. In that, the present study is not very different from earlier ones based on ma-trix or other drift-kick methods [1, 2], with the advantage that it is based on realistic magnetic field models, as well as on accurate large amplitude tracking, yielding reliable knowledge of dynamic apertures.
FIELDS AND CELL PARAMETERS
EMMA lattice is based on a unique type of cell, a quadrupole doublet with two straight sections, one short and one long for, in particular, allowing space for RF cavi-ties (Fig. 1). This lattice has been subject to extensive stud-ies and publications [1, 3]. The set of parameters consid-ered are summarized in Tab. 1.
The focusing (F) and defocusing (D) quadrupoles in the doublet cell are positioned radially so to ensure the bend-ing - and orbit closure - at all energy, they act as combined function dipoles, with alternating bend sign over most of the energy span. The longitudinal phase slip is minimized, a key criterion for efficient use of fixed frequency RF. This correlates to optimization of the dispersion function, with
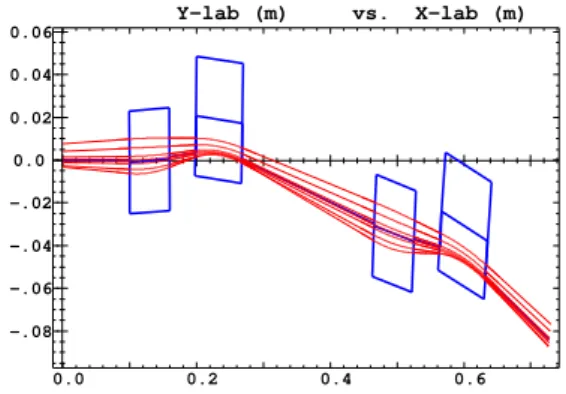
0.0 0.2 0.4 0.6 -.08 -.06 -.04 -.02 0.0 0.02 0.04 0.06 Y-lab (m) vs. X-lab (m)
Figure 1: Closed orbits from 10 to 20 MeV (inner to outer tra-jectories) in a pair of FD cells. RF cavities are located in the long straight.
Table 1:Cell parameters. Bends are treated as straight multipoles with dipole component and gradient, radially displaced.
Optical Length Dipole Gradient element component (m) (T) (T/m) BF 0.06 -0.050721 7.4286 BD 0.07 0.074852 -4.6195 short drift 0.04 long drift 0.2
the beneficial effect of reduced overall transverse excursion during acceleration (which determines the horizontal op-tical aperture). Fig. 2 shows the corresponding evolution of magnetic field shape across the cell depending on en-ergy. Closed orbit dependence on energy, a specific prop-erty of FFAGs, shows a general behavior of outward spiral-ing from injection to top energy (Fig. 1).
The focusing strength decreases with energy (natural chromaticity - sextupoles are avoided so to preserve large dynamic aperture), with behavior as shown in Fig. 3. the largest cell tunes, corresponding to lowest energy, are taken below the half integer, whereas the high energy tunes are kept reasonably high.
The cell geometry also ensures, in the present optics, the working hypothesis of identical time of flight (TOF) at both injection and extraction energies ; on the other hand it results from the longitudinal dynamic that the over-all TOF behavior is almost quadratic in momentum differ-ence δ ≡ δp/p (and but weak higher order dependdiffer-ence in δ), see Fig. 3, which also compares the linear parame-ters in presence of, or without fringe fields. The change in vertical tune due to non-zero fringe field extent, is weak, and however can be recovered from matrix methods by
us-0.0 0.1 0.2 0.3 -.05 0.0 0.05 0.1 0.15 Bz (T) vs. s (m) 20 20 MeV 10 10 MeV 0.0 0.1 0.2 0.3 -.1 -.05 0.0 0.05 0.1 0.15 Bz (T) vs. s (m) 20 20 MeV 10 10 MeV
Figure 2: Field on closed orbits along the cell, at various ener-gies, in the sharp-edge (left) or fringe field (right) magnet model.
10 12 14 16 18 20
0.1 0.2 0.3 0.4
0.5 Nu_x, Nu_z vs. E (MeV)
no FF FF set Nu_x no FF FF set Nu_z 10 12 14 16 18 20 0.0 0.0005 0.001 0.0015 0.002(T - T_ref)/T_ref vs. E (MeV) FF set no FF
Figure 3:Left : Cell tunes as a function of energy. Right : (T − TRef)/TRefas a function of energy.
ing appropriate extent parameter (f) in the focusing term
(z0/z) = − tan(w)/ρ + f/(6ρ2
cos(w))(w = wedge
an-gle, ρ = curvature radius).
STABILITY LIMITS
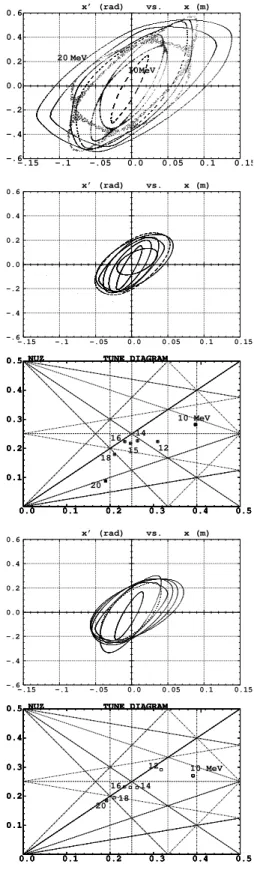
Fig. 4 shows the limit horizontal phase space trajecto-ries at various energies, in case of pure horizontal motion, or including quasi-zero z motion, with or without fringe fields. The presence of arbitrarily small z motion substan-tially decreases the DA. The presence of fringe fields with 4-D motion tends to increase the DA, in case of coupled motion ; examination of tunes vs. amplitude shows that this effect could be correlated to a different behavior of the amplitude detuning.
The fact that the invariants shown in Fig. 4 are very thin gives confidence in the symplectic behavior of the integra-tion. In particular, an increase of initial particle position by about a % in the vicinity of the invariants shown, results in the particle being kicked off (lost), without showing any fuzzy behavior.
LONGITUDINAL MOTION
Serpentine
Fig. 5-(top, left) shows acceleration of an initially ellipti-cal ring, for zero transverse emittance. The ellipse contour is positioned in phase at start (close to π) so as to accel-erate from 10 to 20 MeV. Fig. 5-(top, left) shows the final shape of the bunch contour, depending on the initial value of the ellipse orientation parameter, α, a possible variable in attempts to optimize the transmission.
-.15 -.1 -.05 0.0 0.05 0.1 0.15 -.6 -.4 -.2 0.0 0.2 0.4 0.6 20 MeV 10 MeV x’ (rad) vs. x (m) -.15 -.1 -.05 0.0 0.05 0.1 0.15 -.6 -.4 -.2 0.0 0.2 0.4 0.6 x’ (rad) vs. x (m) 0.0 0.1 0.2 0.3 0.4 0.5 0.1 0.2 0.3 0.4
0.5 NUZ TUNE DIAGRAM
NUX 0.0 0.1 0.2 0.3 0.4 0.5 0.1 0.2 0.3 0.4
0.5 NUZ TUNE DIAGRAM
NUX 0.0 0.1 0.2 0.3 0.4 0.5 0.1 0.2 0.3 0.4
0.5 NUZ TUNE DIAGRAM
NUX TUNE DIAGRAM NUZ NUX 0.0 0.1 0.2 0.3 0.4 0.5 0.1 0.2 0.3 0.4 0.5 10 MeV 12 14 15 16 18 20 -.15 -.1 -.05 0.0 0.05 0.1 0.15 -.6 -.4 -.2 0.0 0.2 0.4 0.6 x’ (rad) vs. x (m) 0.0 0.1 0.2 0.3 0.4 0.5 0.1 0.2 0.3 0.4
0.5 NUZ TUNE DIAGRAM
NUX 0.0 0.1 0.2 0.3 0.4 0.5 0.1 0.2 0.3 0.4
0.5 NUZ TUNE DIAGRAM
NUX 0.0 0.1 0.2 0.3 0.4 0.5 0.1 0.2 0.3 0.4
0.5 NUZ TUNE DIAGRAM
NUX TUNE DIAGRAM NUZ NUX 0.0 0.1 0.2 0.3 0.4 0.5 0.1 0.2 0.3 0.4 0.5 10 MeV 12 14 16 18 20
Figure 4:2-D motion (x, x0), stability limits for 2000 cell passes,
with about 5% precision in x, at 10, 12, 14, 15, 16, 18 and 20 MeV (from inner to outer invariant on left graph), and corresponding cell tunes at stability limits (resonance lines up to 5th order are represented). From top to bottom : (i) pure horizontal motion, no fringe fields, (ii) in presence of very small z motion, no fringe fields, (iii) corresponding tunes, (iv) in presence of very small z motion, fringe fields set, (v) corresponding tunes.
0.0 0.5 1. 1.5 2. 2.5 3. 10 12 14 16 18 20
KinEnr (MeV) vs. Phase (rad)
2. 2.4 2.8 3.2 19.4 19.6 19.8 20. 20.2 20.4 2. 2.4 2.8 3.2 19.4 19.6 19.8 20. 20.2
20.4KinEnr (MeV) vs. Phase (rad)
-6 -5 -4 -3 -6 -3 0.0 0.5 1. 1.5 2. 2.5 3. 0.01 0.02 0.03 0.04 0.05 0.06 0.07 0.08 V (MV) vs. (2 pi f_RF) t * * Y-Min, max plotted : 2.6726E-02 7.1167E-02 X-Min, max plotted : 0.7096 2.760 4201 points plotted Figure 5: Acceleration of elliptical rings (zero transverse
emit-tances) from 10 to 20 MeV in 125 cavity passes. Ellipses are represented each 25 cavity passage. Three particular trajectories show the separatrix and the bunch cog. Voltage : 70 kV peak, RF freq. : 1.3552 GHz. The right plot shows possibilities of op-timization of the final longitudinal bunch shape, for instance here by varying the initial ellipse tilt, −6 ≤ αl≤ −3. Bottom plot :
projection of the bunch on the RF wave, at 4 distinct instants - the crest is crossed 3 times.
6-D transmission
The working hypothesis for this 6-D tracking are :
one cavity every 3 other cell, 80 kV per cavity, fRF =
1.356GHz. The top energy is attained in about 220 pass in
the cavities.
5000 particles are tracked, initial 6-D phase space
conditions are : about parabolic distribution in
²x,z ≈ 70 10−6πm.rad, and ²l ≈ 0.25 10−4πeV.s
(±0.125 ns, ±0.2 MeV).
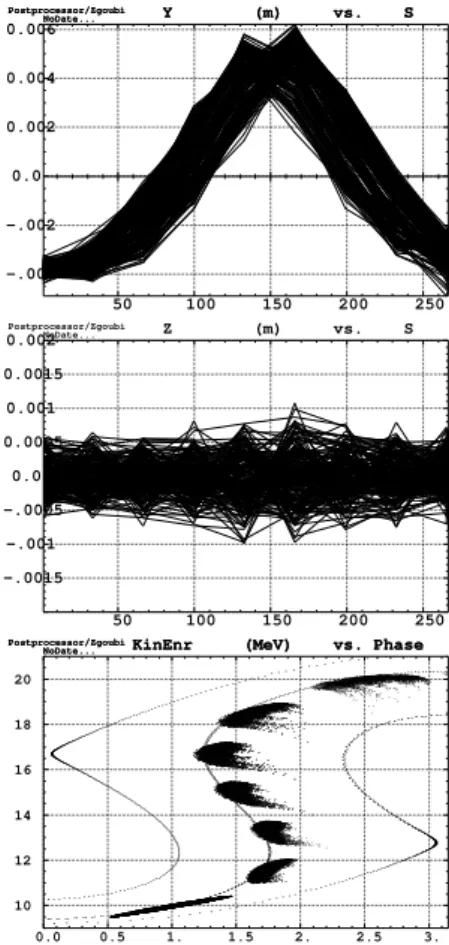
Transverse behavior is shown in Fig. 7. Longitudinal behavior is similar to Fig. 6-right.
REFERENCES
[1] http://hepunx.rl.ac.uk/uknf/wp1/emodel/. [2] http://www.cap.bnl.gov/mumu/project/ISS/.
[3] http://slap.web.cern.ch/slap/NuFact/NuFact/NFNotes.html. [4] E-model with RF systems at 1.3 GHz, E. Keil, CERN
NuF-cat Note 146 (2005).
[5] O CAMELOT ! A Memoir Of The MURA Years (Section 7.1), F.T.Cole, Proc. Cycl. Conf, April 11, 1994 ; FFAG particle accelerators, K.R. Symon et als., Phys.Rev. Vol.103-6, 1837-1859, 1956.
[6] Zgoubi users’ guide, F. M´eot and S. Valero, FERMILAB-TM-2010 (1997). See also, NIM A 427 (1999) 353-356.
0.0 0.5 1. 1.5 2. 2.5 3. 10 12 14 16 18 20
KinEnr (MeV) vs. Phase (rad)
0.0 0.5 1. 1.5 2. 2.5 3. 10 12 14 16 18 20
KinEnr (MeV) vs. Phase (rad)
Figure 6: The sensible effect of launching a bunch with non-zero transverse size. Left : βγ²x/π ≈ 1.4mm, right : βγ²x/π ≈
2.8mm. ²z= 0in both cases. 50 100 150 200 250 -.004 -.002 0.0 0.002 0.004 0.006 Postprocessor/Zgoubi NoDate...
* Test Scott’s Fixed Length Lattice * Y (m) vs. S (m)
Min-max. Hor.: 1.073 266.5 ; Ver.: -4.8941E-03 6.2023E-03 Part# 1- 200 (*) ; Lmnt# * all; pass# 1- 241; 2000 points
Postprocessor/Zgoubi NoDate...
* Test Scott’s Fixed Length Lattice * Y (m) vs. S (m)
Min-max. Hor.: 1.073 266.5 ; Ver.: -4.8941E-03 6.2023E-03 Part# 1- 200 (*) ; Lmnt# * all; pass# 1- 241; 2000 points
50 100 150 200 250 -.0015 -.001 -.0005 0.0 0.0005 0.001 0.0015 0.002Postprocessor/Zgoubi NoDate...
* Test Scott’s Fixed Length Lattice * Z (m) vs. S (m)
Min-max. Hor.: 1.073 266.5 ; Ver.: -2.0000E-03 2.0000E-03 Part# 1- 200 (*) ; Lmnt# * all; pass# 1- 241; 1998 points
0.0 0.5 1. 1.5 2. 2.5 3. 10 12 14 16 18 20 Postprocessor/Zgoubi NoDate...
* Test Scott’s Fixed Length Lattice 0 3.15 9 * KinEnr (MeV) vs. Phase (rad)
Min-max. Hor.: 0.000 3.150 ; Ver.: 9.000 21.00 Part# 1-10000 (*) ; Lmnt# * all; pass# 1- 171; 35010 points
Postprocessor/Zgoubi NoDate...
* Test Scott’s Fixed Length Lattice * KinEnr (MeV) vs. Phase (rad)
Min-max. Hor.: 0.000 3.150 ; Ver.: 9.000 21.00 Part# 1-10000 (*) ; Lmnt# * all; pass# 1- 751; 1110 points
Figure 7: From top to bottom : (i) x-s and (ii) z-s during ac-celeration/deceleration (i.e., a full longitudinal period), observed along the ring at the location of the 14 cavities, (iii) longitudinal motion ; the plot also shows 2 trajectories close to the separatrix, and a third, central one.