HAL Id: hal-02417737
https://hal.archives-ouvertes.fr/hal-02417737
Submitted on 18 Dec 2019
HAL is a multi-disciplinary open access
archive for the deposit and dissemination of
sci-entific research documents, whether they are
pub-lished or not. The documents may come from
teaching and research institutions in France or
abroad, or from public or private research centers.
L’archive ouverte pluridisciplinaire HAL, est
destinée au dépôt et à la diffusion de documents
scientifiques de niveau recherche, publiés ou non,
émanant des établissements d’enseignement et de
recherche français ou étrangers, des laboratoires
publics ou privés.
B. Geslot, A. Gruel, S. Breaud, P. Leconte, P. Blaise
To cite this version:
B. Geslot, A. Gruel, S. Breaud, P. Leconte, P. Blaise. Innovative hybrid pile oscillator technique in
the Minerve reactor open loop vs. closed loop. ANIMMA, Jun 2017, Liege, Belgium. �hal-02417737�
Abstract—Pile oscillator techniques are powerful methods to measure small reactivity worth of isotopes of interest for nuclear data improvement. This kind of experiments has long been implemented in the Mineve experimental reactor, operated by CEA Cadarache. A hybrid technique, mixing reactivity worth estimation and measurement of small changes around test samples is presented here. It was made possible after the development of high sensitivity miniature fission chambers introduced next to the irradiation channel. A test campaign, called MAESTRO-SL, took place in 2015. Its objective was to assess the feasibility of the hybrid method and investigate the possibility to separate mixed neutron effects, such as fission/capture or scattering/capture. Experimental results are presented and discussed in this paper, which focus on comparing two measurements setups, one using a power control system (closed loop) and another one where the power is free to drift (open loop). First, it is demonstrated that open loop is equivalent to closed loop. Uncertainty management and methods reproducibility are discussed. Second, results show that measuring the flux depression around oscillated samples provides valuable information regarding partial neutron cross sections. The technique is found to be very sensitive to the capture cross section at the expense of scattering, making it very useful to measure small capture effects of highly scattering samples.
Index Terms—Neutron cross section measurement; hybrid pile oscillator; minerve experimental reactor.
I. INTRODUCTION
ILE oscillator techniques are powerful methods to measure small reactivity worth of isotopes of interest for nuclear data improvement [1][2][3]. The principle is to create, in a well-known neutron flux, a weak and localized perturbation, the characteristics of which (amplitude, phase, energy spectrum) can be connected to some physical parameters (i.e. cross sections). Pile oscillator techniques are called “open loop” if the reactor power is free to drift during the measurement. On the contrary, it is called closed loop when a power control system is activated. Such pile oscillator experiments have long been held in the Minerve facility, operated by CEA at Cadarache. A closed loop reactivity
B. Geslot is with CEA DEN/Cad/DER/SPEx/LPE, Cadarache, Bat.238, F-13108, Saint Paul Lez Durance (e-mail: benoit.geslot@cea.fr).
A. Gruel and P. Blaise are with CEA DEN/Cad/DER/SPEx/LPE, Cadarache, Bat.238, F-13108, Saint Paul Lez Durance.
S. Bréaud is with CEA DEN/Cad/DER/SPEx/LDCI, Cadarache, Bat.238, F-13108, Saint Paul Lez Durance.
P. Leconte is with CEA DEN/Cad/DER/SPRC/LEPh, Cadarache, Bat.238, F-13108, Saint Paul Lez Durance.
oscillator method is implemented based on measuring the global reactivity perturbation associated to samples motion in the core center.
The technique was recently extended by introducing CEA-made high sensitivity miniature fission chambers (MFCs) close to the irradiation channel in order to measure local perturbations of the neutron flux. New detectors and associated acquisition systems were developed by CEA for that purpose [4].
A measurement campaign, called MAESTRO-SL (SL stands for local signal), took place in 2015 in the Minerve reactor, in a core configuration close to the one used for the MAESTRO oscillation campaign [5][6]. Its objective was to assess the feasibility of measuring local perturbation and, then, to investigate on unfolding capture and scattering cross sections. Closed loop experiments were first performed to provide reference results. Then, open loop measurements were done on a subset of samples.
Results from closed loop oscillations (CLO) are presented and discussed in this paper. Theoretical considerations and more details about open loop oscillations (OLO) can be found in [4].
II. EXPERIMENTAL SETUP
A. Reactor configuration
Minerve is a pool type reactor operated at low power (100 W maximum). Its core is divided into two parts:
a water moderated driver zone (DZ) with highly enriched MTR type uranium/aluminum plate assemblies and surrounded by graphite reflector blocks ;
an test zone (TZ) in which 3 % enriched PWR type UO2 fuel pins are loaded in a square lattice with a pitch of 1.26 cm. The fissile zone is about 40 cm in diameter and 60 cm in height.
At the center of the test zone, an irradiation channel is used to introduce various test samples in the core. Samples are held in an oscillator device used to perform pile oscillator experiments. Their reactivity worth (in the range of a few pcm) are obtained and compared against reference materials (e.g. gold, boron, lithium).
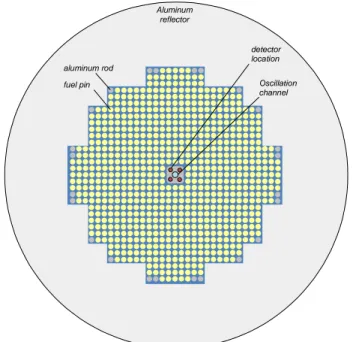
In the MAESTRO-SL configuration, shown on Fig. 1, four detector locations (8.5 mm in diameter) were accommodated close to the oscillation channel (13.4 mm in diameter) in a guiding device made of aluminum alloy. Four MFCs loaded with enriched uranium deposits were used to monitor the
Innovative hybrid pile oscillator technique in the
Minerve reactor: open loop vs. closed loop
Benoit Geslot, Adrien Gruel, Stéphane Bréaud, Pierre Leconte, and Patrick Blaise
monitor the reactor power during experiments and provide a signal proportional to the global perturbation introduced by oscillated samples. This detector was located in the core reflector, far enough from the core center so that its signal is proportional to the reactor global fission rate.
The power control system (PCS) is based on a rotary cadmium control rod (the so-called “pilot rod”) located in the reflector, next to the driver zone. Reactivity is ajusted by changing the angle between rotor and stator, which varies the active cadmium surface. A retroaction loop fed by the boron chamber signal is used to stabilize reactor power.
B. Detector calibration
Detectors were calibrated against a reference fission chamber in PHA mode, using a standard gamma spectroscopy chain (preamplifier Canberra 2006, amplifier Canberra 2024, digitizer Canberra MPII, Canberra Genie2000 acquisition software). The reference detector was previously calibrated in the BR1 reactor (SCK•CEN, Mol, Belgium) in well characterized neutron flux [8]. Measurements were performed in Minerve central channel at low power (0.2 W and 0.5 W) in order to keep acquisition dead time below 10 %.
Detectors sensitivity, called effective mass, is expressed in mg of U-235 (see Table 1). They were found to be in good
electroplating of fissile material. Overall uncertainty (at 1 ) is 2.4 %, 1 % coming from statistical uncertainty.
A second calibration coefficient was introduced to take into account differences in efficiency due to measurement chains, and also to take into account an electronics scaling factor between the PHA mode (calibration reference) and the counting rate vs. time (MCS mode).
Since recorded counting rates can be as high as 2 106 c/s, it is necessary to correct signals for acquisition dead time. Non-extendable models were used and dead time constants range from 90 ns to 140 ns. This corresponds to dead time of 15 % at the most.
TABLE 1
MINIATURE FISSION CHAMBERS CHARACTERISTICS
Detector Mass Scaling factor DT constant
FC 2295 6.28 mg 1.485 90 ns
FC 2296 9.54 mg 1.160 136 ns
FC 2297 9.47 mg 0.975 137 ns
FC 2298 9.61 mg 0.970 92 ns
The four MFCs were used to produce an overall quantity that is supposed to be proportional to the average thermal flux change around the sample. This quantity, referred to as local signal and noted SL in the rest of the text, is calculated as
follows: 4 1 L i i i S a CR
, (1)where ai are the scaling factors. SL should be robust against
small geometry changes that occur during oscillations due to mechanical tolerances.
III. DESCRIPTION OF EXPERIMENTS
A. Objectives
Experiments aimed at demonstrating the feasibility of measuring the local perturbation component in Minerve. Samples of known composition were used for that purpose. They were previously oscillated in the MAESTRO experiment [5][6]. They are mostly made of scattering and capturing materials in liquid or solid form, except for two samples made of UO2 pellets with two
235
U enrichments.
Because it was our reference technique, closed loop oscillations (i.e. PCS on) were first used to provide reference results. The experiment phase consisted in oscillating each sample several times (at least five), so as to estimate the signals dispersion. Then, a subset of samples was measured using the open loop technique (i.e. PCS off).
B. Samples
Samples were made of a column of material of interest (MOI), sometimes diluted into a matrix such as water, and enclosed in a cladding sheath (aluminum, Zircaloy-4 or both).
Fig. 2. Drawing of the CF8R-lg fission chamber (dimensions are in mm).
Fig. 1. Sketch-up of the MAESTRO-SL experimental zone. Size of the core is about 70 cm. Aluminum reflector aluminum rod fuel pin detector location Oscillation channel
Most samples had an overall height of 120 mm (MOI 100 mm long), except carbon and aluminum samples which were 320 mm long (MOI 300 mm long).
Samples are listed in Table 2 along with their masses (cladding mass not included) and diameters. Most samples were measured using both CLO and OLO techniques, but a few were only measured by CLO.
TABLE 2 LIST OF SAMPLES
Material Mass (g) Diam. (mm) Exp.
nat Au 1.51 1 Both nat Au 3.85 1.6 Both D2O 7.75 10.4 Both UO2 (3%w 235U) 51.1 8.36 Both UO2 (0.25%w 235U) 50.6 8.36 CL H2O+ 6Li (820 ppm) 5.32 8.36 Both H2O+ 6Li (3280 ppm) 5.35 8.36 CL H2O+ 10B (690 ppm) 5.07 8.36 CL H2O+ 10B (1040 ppm) 5.09 8.36 CL H2O 5.35 8.36 Both H2O+ natGd 5.21 8.36 Both Be 7.08 7.0 Both Polyethylene 3.26 6.7 Both Carbon (30 cm) 40.66 10 CL Aluminum (30 cm) 65.88 10.16 CL
Dummy (liquid) - 8.36 Both
Dummy (10 cm) - 10 Both
Dummy (30 cm) - 10 Both
C. Data processing (CLO)
In closed loop experiments, global signal, denoted as SG(t),
was issued by the angular sensor that monitored the pilot rod motion. Local signal SL(t) came from the 4 MFCs, as detailed
in II.B.
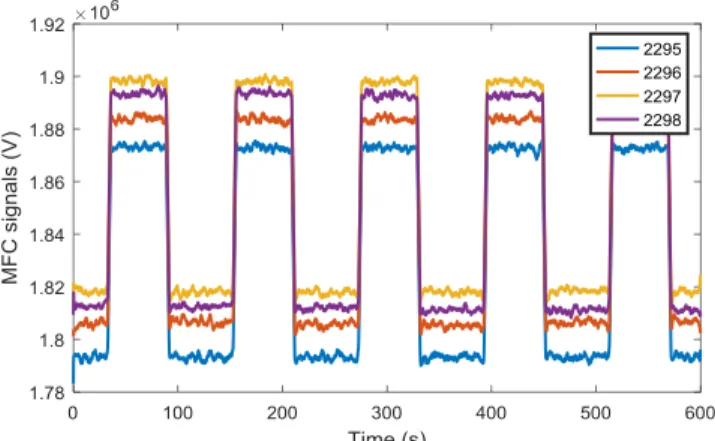
Thanks to the reactivity retro-action loop, all detectors recorded pseudo-square waveforms very similar in shape to the one of the sample motion in and out of the core (trapezoidal). Signals coming from MFCs are illustrated in Fig. 3. As it can be seen, differences among signals after rescaling are very low (less than 1 %). This proves that the scaling procedure was able to correct properly for detection efficiency.
Both local and global signals were first rescaled by dividing by their average. Their amplitudes are respectively denoted ΔL and ΔG.
As a measurement is composed of five cycles of oscillation, each signal is processed to give a set of five values (a 5-tuple) corresponding to cycles amplitude. This is done for the global and local signals respectively. Final results of a measurement are given by the averages and standard deviations of the two 5-tuples.
A statistical procedure is then applied to estimate results uncertainties by calculating intra-class and extra-class variances over the whole campaign (details are in given [7]).
D. Data processing (OLO)
In open loop experiments, reactor power is free to evolve along with the oscillator motion. Global signal SG was taken
from the boron chamber located in the core reflector. During
an oscillation, SG exhibited increasing and decreasing
transients driven by delayed neutron precursors.
As for CLO experiments, local signal SL was obtained from
local MFCs counting rate. In this case, SL is a mix of a global
component driven by the reactor power and a local component proportional to thermal flux changes (in amplitude and spectrum) around the sample.
Oscillation parameters for OLO experiments were determined from tests carried out on D2O and gold samples. A
good compromise between global and local signals was found with oscillations of 60 s period (20 cycles). Oscillations amplitude was set to maximum (70 cm), as in the CLO case, in order to maximize the global signal.
OLO data processing required first to correct for slow power drifts during experiments. Then, signals were normalized to their average. This way, it is straightforward to derive the local perturbation by subtracting the global component to the local signal, as follows:
L
G
L G S t S t L t S S , (2)As illustrated on Fig. 4, L(t) is a square signal, that can be compared to CLO signal. Amplitude of L(t) is denoted ΔL.
Analysis of SG(t) can be done by Fourier Series analysis.
Because it is a non-square signal, information is contained in the phase as well as in the amplitude of the signal harmonics. Let TF[SG](f ) be the Fourier transform of signal S(t), f0 be the
oscillation frequency and T the oscillation duration. The modulus |SG|n of the nth harmonics is expressed as:
Fig. 4. Local and global signals recorded during the OLO of D2O sample.
T
In the following, we use the first harmonic modulus, denoted as |SG|. From the point kinetics assumption, it can be
shown that it is proportional to reactivity perturbation. The proportionality factor depends on the oscillation frequency and also on the effective delayed neutron fraction. It was estimated by analyzing SG(t) using an inverse kinetics technique [9] that
gave estimates of samples reactivity worth in cents (ȼ = βeff
/100). Samples reactivity worth range from -9 ȼ to 0.5 ȼ, and proportional coefficient is found to be 0.23 ȼ-1.
IV. RESULTS AND DISCUSSION
A. Comparison between open loop and closed loop results
In order to compare CL and OL results, it was found necessary to rescale OLO results. As expected, global signals had different units because they came from different detectors. A linear fit was applied then to obtain a 2.65 coefficient between angular captor and boron chamber signals (R² coefficient was 0.99995).
Unexpectedly, a systematic sensitivity shift between OLO and CLO was observed on inlocal signals. This was a slight difference (2.5 %), that probably came from a bias introduced by the normalization step, due to the fact that signals are not exactly symmetrical. Signals symmetry depends on the oscillation period, which was shorter for OLO (60 s against 120 s for CLO). A correction was made by applying linear fit to correct OLO data (R² = 0.99989).
After rescaling, OLO and CLO data were found to be in very good agreement, as it is illustrated for D2O sample on Fig. 6. The overall average difference (RMSE) is equal to 2.1 10-4 for local signals and 1.9 10-3 for global signals, which corresponds respectively to 0.4 % and 0.2 % of the measurement range.
Experiments presented here demonstrate that open loop and closed loop techniques, although producing very different signals, can give very similar results after data processing.
Results quality in terms of uncertainty is difficult to assess, because it depends a lot on the measurement setup, such as detectors sensitivity, reactor operations and oscillation parameters. As for experiments in Minerve, it was found that CLO signals are more robust and reproducible that OLO signals, as they required no power drift corrections.
In specific cases, where one would like to emphasize the local signal and decrease as much as possible the global signal, then OLO technique would be more adapted. That is
global component, but leaves the local signal nearly unchanged.
B. Disentangling neutron cross sections (CLO experiments)
In the past, local oscillation experiments were performed to separate effects from different cross sections. With adequate calibration procedure, it was possible to measure at the same time fission and radiative capture cross sections in fissile materials [10]. Another interesting experiment was the measurement of very small capture cross sections in strongly scattering materials [11].
Here, independent measurements of both local and global perturbations is achieved. Such hybrid experiment should provide additional information on sample cross sections. This is only the case if local and global effects exhibit different sensitivities to neutron cross sections. Mathematically, one can say that neutron effects must not be collinear in the plane ΔG vs. ΔL.
On Fig. 7, results from the whole CLO campaign are plotted in a 2D space using ΔL and ΔG as horizontal and vertical coordinates. 121 oscillation results are represented as dots whereas circles feature averaged results per sample. Notice that a correction was required for the 30 cm samples (aluminum and carbon) in order to rescale their global signal to the one of 10 cm samples. An empirical 0.35 factor was applied to ΔG to account for sample length.
Since data points are not all on the same line on Fig. 7, it is obvious that ΔG is not collinear with ΔL. More interesting, a linear behavior can clearly be seen for samples of the same type. Straight lines drawn on the graph indicate directions corresponding to neutron effects such as radiative capture in gold (green line), scattering (blue line) and neutron production (red line). Those lines have been constructed by fitting data points from similar samples, including dummy samples for scattering and capture in gold (R² coefficients are always above 0.999).
Samples coordinates on the graph are related to the macroscopic cross sections of their components (cladding, matrix and MOI). Let a vector DT be defined by a dummy sample D and a test sample T. Its norm ||DT|| is a physical quantity that is proportional to the test sample MOI macroscopic cross sections. The proportionality coefficient is complex as it is strongly dependent on the neutron flux shape and spectrum in the sample’s vicinity.
It is still possible to decompose vector DT into components inside a coordinate space given by two directed lines. Those lines can be graded using reference samples of known composition. Samples components could then be expressed in physical units (mass of reference material or cross sections in barns).
In this frame, the plane (ΔG,ΔL) can be divided into separate areas corresponding to mixed neutron effects, such as production/capture area (for fissile sample) or capture/scattering area (for water based samples). Notice that capture and neutron production lines are nearly perpendicular, which is in favor of an optimum separation of the two effects. Separation is less favorable for capture and scattering.
Discussion on neutron absorbing samples
Gold samples have a strong negative effect both on local and global signals. It is interesting to notice that gold samples are perfectly aligned, without any distortion due to self-shielding effect. That is because self-self-shielding has the same impact on local and global signals. Self-shielding can still be observed from the fact that the two samples are not located on the line with respect to their mass. On the contrary the distance ratio (equal to 2.14) is lowered because of self-shielding.
Uranium samples are absorbing locally thermal neutrons, that is why the ΔL is negative, even though they increase the total flux. Uranium samples have a mixed global effect thanks to the fission of U-235 which increases the core reactivity. The uranium line can be graded in U-235 enrichment. The origin of the line (red diamond on Fig. 7) is located very close to the gold capture line, the little gap being probably due to geometric effects.
Discussion on scattering and water-based samples
The scattering line is drawn based on two samples: graphite and heavy water. They are supposedly pure scattering materials since capture cross sections of carbon, deuterium and oxygen are all below 5 mb at thermal point.
Notice that the water sample is not located on the scattering line, because the capture cross section of hydrogen is not negligible (around 335 mb at thermal point).
As explained above, scattering has a different effect on local signal in water-based as in D2O samples. That is because neutron spectrum is different around samples. This comes also from a geometrical bias due to differences in samples diameter. It is possible to introduce a first order correction by rescaling the ΔL values to a reference diameter. If water-based diameter is chosen as reference, D2O local signal is multiplied by 8.36/10.4. Fig. 7 shows a close-up view of scattering and water-based samples after correction. A new scattering line can be drawn which corresponds to 8.36 mm diameter. Uncorrected D2O is also plotted on the graph, as well as the scattering line for the Ø10 mm geometry. It is noticeable that beryllium is now perfectly located on the scattering line.
As it can be seen, the capture in water line is intersecting the scattering line at some point, the coordinates of which are
linked to the hydrogen scattering cross section. By comparing the lines intersection point with the D2O point, it is possible to measure the ratio of hydrogen and deuterium scattering cross sections.
V. CONCLUSION AND OUTLOOKS
Pile oscillator techniques are powerful methods to measure small reactivity worth of isotopes of interest for nuclear data improvement. Recently, hybrid pile oscillation experiments (i.e. mixing local and global signals) were carried out in the Minerve facility using newly designed CEA-made high sensitivity miniature fission chambers.
The coupled analysis of samples reactivity effect (global signal) and thermal flux depression surrounding the samples (local signal) allows separating effects into components: fission and capture for fissile samples, scattering and capture for other samples.
Experiments demonstrated the feasibility of measuring in Minerve thermal flux changes as low as 0.1 %. Because local flux variations are small and rapidly fading away off samples, a major drawback of the technique is to be rather sensitive to small geometry differences among samples. Adapted sample design and careful experimental setup should mitigate the impact on results quality.
Experimental results show clearly that separating fissile and capture effects is optimum in Minerve setup. A fair separation
Fig. 7. CLO results in (G,L) plane. Dots are measurements and circles are averaged results per sample.
UO2 (3%) H2O Gold 3.8g Dummy Gold 1.5g D2O Be CH2 H2O + Gd H2O + Li UO2 (0.25%) H2O + B H2O + B H2O + Li C Al Neutron production Capture in gold Capture in water Scattering -0.8 -0.7 -0.6 -0.5 -0.4 -0.3 -0.2 -0.1 0 0.1 0.2 0.3 0.4 0.5 0.6 0.7 -0.06 -0.05 -0.04 -0.03 -0.02 -0.01 0 0.01 0.02 0.03 0.04 0.05 0.06 G L Production / Capture Capture / Scattering Scattering / Production
Fig. 6. Water-based samples and scattering samples corrected for diameter.
H2O D2O Be H2O + Li C Scattering (Ø10) D2O (before correction) Capture in water Scattering (Ø8.36) 0 0.1 0.2 0.3 0.4 0.5 0.6 0.7 0.8 0.9 1 0 0.01 0.02 0.03 0.04 0.05 0.06 0.07 0.08 G L
Future developments (both in terms of theory and instrumentation) are planned to implement this promising technique into the upcoming ZEPHYR facility, which is under investigation by CEA.
A complete analysis of the results using newly developed capabilities in the TRIPOLI-4 Monte Carlo code should start soon.
ACKNOWLEGEMENTS
This work was conducted by CEA/Cadarache in the framework of the I3P collaboration regrouping CEA, EdF and AREVA.
REFERENCES
[1] W. K. Foell, “Small-sample reactivity measure-ments in nuclear reactors”. American Nuclear Society, Hinsdale, IL, USA, 1972. [2] J. I. Hoover et al., “Measurement of Neutron Absorption Cross
Sections with a Pile Oscillator,” Phys. Rev., vol. 74, no. 8, pp. 864–870, Oct. 1948, 10.1103/PhysRev.74.864
[3] A. L. Dekker and H. R. Kleijn, “The local pile oscillator as a device for measuring epithermal neutron absorption,” Nucl. Instr.
Meth., vol. 55, pp. 87–92, Jan. 1967.
[4] B. Geslot, et al., “A hybrid pile oscillator experiment in the Minerve reactor”. Annals of Nuclear Energy, 108, pp. 268–276, 2017.
[5] P. Leconte, et al., “MAESTRO: An ambitious experimental programme for the improvement of nuclear data of structural, detection, moderating and absorbing materials - First results for
natV, 55Mn, 59Co and 103Rh,” in ANIMMA 2013 Int. Conf.,
Marseille, France, 2013.
[6] P. Leconte, et al., “Thermal neutron activation experiments on Ag, In, Cs, Eu, V, Mo, Zn, Sn and Zr in the MINERVE facility,” in WONDER 2015, Aix-en-Provence, 2015, vol. 111.
[7] M. Antony, et al., “Oscillation experiments techniques in CEA MINERVE experimental reactor,” 1st ANIMMA Int. Conference, Marseille, June, 2009.
[8] V. Lamirand, et al., “Miniature Fission Chambers Calibration in Pulse Mode: Interlaboratory Comparison at the BR1 and CEA CALIBAN Reactors,” IEEE Trans. Nucl. Sci., vol. 61, no. 4, pp. 2306–2311, Aug. 2014.
[9] S. Tamura, “Signal Fluctuation and Neutron Source in Inverse Kinetics Method for Reactivity Measurement in the Sub-critical Domain,” J. Nucl. Sci. Tech., vol. 40, no. 3, pp. 153–157, Mar. 2003.
[10] B. Laponche, M. Brunet, and Y. Bouedo, “Oscillation of Fissile Materials in Thermal-Neutron Critical Assemblies: The Equivalent Sample Method,” Nucl. Sci. Eng., vol 48, no. 3, Jan. 1972. [11] A. Ertaud, V. Raievski, and D. Breton, “Méthode d’oscillation
dans la pile, appliquée à la comparaison d’échantillons de graphite,” J. Phys. Radium, vol. 12, no. 8, pp. 784–788, 1951. [12] A. Gruel, et al., “Interpretation of Fission Product Oscillations in
the MINERVE Reactor, from Thermal to Epithermal Spectra”.
Nucl. Sci. Eng., vol. 169. no. 3, pp. 229–244.
[13] B. Geslot, et al., “Americium-241 integral radiative capture cross section in over-moderated neutron spectrum from pile oscillator measurements in the Minerve reactor”, Int. Conf. on Nuclear Data,, Brugges, Belgium, 2016