Comparative Epigenomic Analysis
of Murine and Human Adipogenesis
The MIT Faculty has made this article openly available.
Please share
how this access benefits you. Your story matters.
Citation
Mikkelsen, Tarjei S., Zhao Xu, Xiaolan Zhang, Li Wang, Jeffrey
M. Gimble, Eric S. Lander, and Evan D. Rosen. “Comparative
Epigenomic Analysis of Murine and Human Adipogenesis.” Cell 143,
no. 1 (October 2010): 156–169.
As Published
http://dx.doi.org/10.1016/j.cell.2010.09.006
Publisher
Elsevier
Version
Author's final manuscript
Citable link
http://hdl.handle.net/1721.1/116755
Terms of Use
Creative Commons Attribution-NonCommercial-NoDerivs License
Comparative epigenomic analysis of murine and human
adipogenesis
Tarjei S. Mikkelsen1,4, Zhao Xu1,2,4, Xiaolan Zhang1, Li Wang1, Jeffrey M. Gimble3, Eric S. Lander1, and Evan D. Rosen1,2
1 Broad Institute, 7 Cambridge Center, Cambridge, MA
2 Division of Endocrinology and Metabolism, Beth Israel Deaconess Medical Center, 330 Brookline
Ave., Boston, MA 02215
3 Stem Cell Biology Laboratory, Pennington Biomedical Research Center, Louisiana University
System, 6400 Perkins Rd, Baton Rouge, LA 70808
SUMMARY
We report the generation and comparative analysis of genome-wide chromatin state maps, PPARγ and CTCF localization maps and gene expression profiles from murine and human models of adipogenesis. The data provide high-resolution views of chromatin remodeling during cellular differentiation, and allow identification of thousands of putative pre- and adipocyte-specific cis-regulatory elements based on dynamic chromatin signatures. We find that the adipocyte-specific locations of most such elements differ between the two models, including at orthologous loci with similar expression patterns. Based on sequence analysis and reporter assays, we show that these differences are determined in part by evolutionary turnover of transcription factor motifs in the genome sequences, and that this turnover may be facilitated by the presence of multiple distal regulatory elements at adipogenesis-dependent loci. We also utilize the close relationship between open chromatin marks and transcription factor motifs to identify and validate PLZF and SRF as regulators of adipogenesis.
INTRODUCTION
Describing the gene regulatory networks (GRNs) that control development, differentiation and physiological processes is a major goal of mammalian genome biology. A GRN consists of
trans-regulatory factors and cis-regulatory elements whose interactions with each other and
the environment govern the expression of genes in the network, and ultimately manifest as a complex phenotype such as gastrulation, adipogenesis or glucose homeostasis (Arnone and Davidson, 1997). The core trans-regulatory factors in a variety of GRNs have been identified by expression profiling and genetic analysis, but the large size and complex architecture of mammalian genomes have prevented systematic identification of cis-regulatory elements.
© 2010 Elsevier Inc. All rights reserved.
Corresponding Author: Evan D. Rosen Division of Endocrinology and Metabolism Beth Israel Deaconess Medical Center 330 Brookline Ave Boston, MA 02215 Phone: (617) 735-3221 Fax: (617) 735-3323 erosen@bidmc.harvard.edu.
4These authors contributed equally to this work
Publisher's Disclaimer: This is a PDF file of an unedited manuscript that has been accepted for publication. As a service to our customers
we are providing this early version of the manuscript. The manuscript will undergo copyediting, typesetting, and review of the resulting
NIH Public Access
Author Manuscript
Cell. Author manuscript; available in PMC 2011 October 1. Published in final edited form as:
Cell. 2010 October 1; 143(1): 156–169. doi:10.1016/j.cell.2010.09.006.
NIH-PA Author Manuscript
NIH-PA Author Manuscript
Recent advances in high-throughput DNA sequencing have led to the development of new experimental tools that greatly enhance our ability to study genome function. In particular, chromatin immunoprecipitation and sequencing (ChIP-Seq) allows efficient genome-wide profiling of transcription factor (TF) localization (Johnson et al., 2007; Robertson et al., 2007) and chromatin state (Barski et al., 2007; Mikkelsen et al., 2007a). Because different classes of cis-regulatory elements display characteristic chromatin signatures when they are active (Hon et al., 2009), ChIP-Seq has emerged as a powerful tool for comprehensive discovery of these elements.
Identifying the components of a GRN that govern a specific phenotype of interest from ChIP-Seq maps of a given cell type, however, remains challenging for several reasons. First, these maps typically identify tens of thousands of putative regulatory elements, only some of which are likely to be directly relevant to the phenotype. Second, while these maps appear to be highly sensitive, their specificity towards biologically relevant elements is less clear (Birney et al., 2007). For example, TF localization analyses frequently reveal many binding sites that have no discernable effect on the expression levels of nearby genes (Johnson et al., 2007; Robertson et al., 2007; Zhang et al., 2005). Third, practical considerations often necessitate the use of in
vitro cell culture models that might be subject to aberrant genetic or epigenetic changes. This
raises the possibility that some chromatin state components observed in an in vitro model may not be representative of the analogous cell type in vivo (Noer et al., 2009).
We reasoned that comparative profiling of multiple cell culture models that display similar, inducible phenotypes might help shed light on these issues. Profiling closely related cell types before and after induction should help identify regulatory elements that are directly related to the phenotype. Classification of these elements as either model-specific or shared should then provide a foundation for understanding their relative importance and therefore help prioritize in-depth functional studies.
To explore this approach, we focused on adipogenesis. Adipocytes play a central role in systemic metabolism, coordinating lipid and glucose homeostasis (Rosen and Spiegelman, 2006). The burgeoning human and financial costs of obesity, type 2 diabetes, and other metabolic disorders have therefore thrust adipocyte biology into the forefront of biomedical research priorities (Camp et al., 2002). Adipogenesis is also one of the most intensively studied examples of cellular differentiation, and several cell culture models that appear to closely approximate events that occur during adipogenesis in vivo are available (Rosen and MacDougald, 2006).
Here, we report the generation and analysis of genome-wide chromatin state maps, TF localization maps and gene expression profiles from multiple stages of differentiation in two established models of adipogenesis, murine 3T3-L1 cells (L1s) and human adipose stromal cells (hASCs). 3T3-L1 is a cell line originally subcloned from embryonic fibroblasts (Green and Meuth, 1974), while hASCs are primary cells derived from adult subcutaneous
lipoaspirates (Aust et al., 2004). Undifferentiated L1s and hASCs (‘pre-adipocytes’) have similar fibroblast-like morphologies. When induced to undergo terminal differentiation in adipogenic media, both change into round cells that exhibit properties typical of adipocytes in
vivo, such as insulin-stimulated glucose uptake, lipogenesis, catecholamine-stimulated
lipolysis and adipokine secretion. These two models therefore provide the opportunity to study GRNs that govern similar adipogenic phenotypes against a background of phylogenetic, ontogenic and technical differences.
NIH-PA Author Manuscript
NIH-PA Author Manuscript
RESULTS
Comparative epigenomic profiling of adipogenesis
To facilitate comprehensive epigenomic profiling of cells undergoing adipogenesis, we expanded L1 and hASC pre-adipocytes and induced differentiation in adipogenic media. We selected four matched time points that represented similar stages of differentiation, as judged by morphology and lipid droplet accumulation. These time points corresponded to proliferating (day -2) and confluent (day 0) pre-adipocytes, immature adipocytes (day 2 for L1s, day 3 for hASCs), and mature adipocytes (day 7 for L1s, day 9 for hASCs).
We generated genome-wide chromatin state maps using ChIP-Seq, profiling six histone modifications (H3K4me3/me2/me1, H3K27me3/ac and H3K36me3) and the CCCTC-binding factor (CTCF) at all four time points. We also profiled the adipogenic TF peroxisome proliferators-activated receptor γ (PPARγ) at the last time point. The resulting data consists of 60 ChIP-Seq experiments and two negative controls. We also measured mRNA and miRNA expression levels in both models using microarrays. All data have been deposited in public databases.
To visualize the data, we generated histograms of normalized densities of ChIP fragments across the genomes. Figure 1 shows these densities near the murine Pparg gene, which is strongly up-regulated during adipogenesis (Figure S1 shows the human PPARG locus). The profiled histone modifications and TFs showed spatial and temporal density distributions that are qualitatively consistent with their known functions (Hon et al., 2009). For example, H3K4me3, which is associated with transcriptional initiation, was primarily found near known promoters. A case in point is the gain of H3K4me3 observed near the adipocyte-specific alternative promoter of Pparg (P2, Figure 1). H3K4me2/me1 and H3K27ac, which are associated with ‘open’ chromatin and cis-regulatory activity, showed dynamic distributions in promoter, intronic and intergenic regions. H3K36me3, which is associated with transcriptional elongation, was distributed across active gene bodies, and increased markedly across Pparg as it was up-regulated. H3K27me3, which is associated with Polycomb-mediated repression, was distributed broadly across the inactive flanking regions. The PPARγ and CTCF densities showed sharp peaks, consistent with individual TF binding sites.
To support quantitative analyses, we identified significant clusters of ChIP fragments using a sliding-window approach for histone modifications, and QuEST (Valouev et al., 2008) for TF binding sites. Each such region or binding site was assigned an ‘enrichment score’, which represents the ratio of observed over expected fragments. Their genome-wide distributions are consistent with the qualitative patterns described above (Table S1). mRNA and miRNA expression analyses revealed correlated expression dynamics that are consistent with efficient adipogenic differentiation (Figure S2, Table S2, Supplementary Experimental Procedures). To compare data from the two models, we first attempted to map each enriched region in the mouse genome to corresponding regions of orthologous sequence in the human genome, and
vice versa, using previously computed whole-genome alignments. About 80-90% of these
regions could be mapped to the other genome. We then asked whether these orthologous regions overlapped the same chromatin marks or TF binding sites in the other model
(conservatively requiring an overlap of ≥1bp). We will refer to such overlaps as ‘shared’ marks or binding sites, and the remainder as ‘model-specific’.
We conclude that the data provide a rich resource for studies of chromatin remodeling and gene regulation in two key models of adipogenesis. In the following sections, we focus on detection and functional analysis of cis-regulatory elements in the adipogenic GRN and the sequence-specific TFs that interact with them.
NIH-PA Author Manuscript
NIH-PA Author Manuscript
Histone modifications associated with distal enhancers
We began our analysis by characterizing open chromatin marks in regions distal to (>2 kb from) known promoters. H3K4me2/me1 and H3K27ac were distributed in highly correlated patterns at each time point, and changed dynamically in thousands of genomic regions in each cell culture model (Table S1). These ‘dynamic’ regions were often clustered near genes with adipogenesis-dependent expression patterns, suggesting that they represent cooperative or redundant distal enhancers. Orthologous genes with similar expression in L1s and hASCs frequently showed similar chromatin marks, but the specific location of these marks was often model-specific; this suggests that expression pattern of genes is better conserved between the models than the specific elements controlling the expression.
To identify putative distal enhancers, we focused on H3K27ac, because recruitment of histone acetyltransferases (HATs) is the most specific signature known for these elements (Ghisletti et al. 2010; Heintzman et al. 2009; Wang et al. 2008). We detected 29,092 distal H3K27ac regions in L1 adipocytes (day 7), with enrichment scores spanning an order of magnitude (Table S3). Of these, 6,096 (~21%) showed a ≥5-fold increase in enrichment scores relative to pre-adipocytes (days -2 and 0), suggesting that they harbor regulatory elements that recruit HATs during adipogenesis. Conversely, we identified 5,159 H3K27ac regions in L1 pre-adipocytes (day -2) whose enrichment scores decreased at least 5-fold. We observed similar dynamics in hASCs (Table S3).
Dynamic changes in open chromatin marks were significantly correlated with changes in the expression levels of linked genes. For simplicity, we assumed that each H3K27ac region was associated with the closest known gene (although there are counterexamples, as described below). Roughly 15% of all genes on our microarrays showed a ≥2-fold change in expression between L1 adipocytes and pre-adipocytes. We found that the more the expression level of a gene increased or decreased, the more likely it was to be associated with adipocyte- or pre-adipocyte-specific H3K27ac, respectively (Figure 2A). Conversely, the likelihood that the expression level of a gene changed ≥2-fold was positively correlated with both the enrichment scores (Figure 2B) and the total number (Figure 2C) of dynamic H3K27ac regions associated with it. By contrast, association with invariant H3K27ac (enriched in both adipocytes and pre-adipocytes) had little predictive value with respect to changes in expression. We observed similar patterns in hASCs (Figure 2D-F). Distal regions that show changes in open chromatin marks during adipogenesis are therefore likely to be enriched for cell type-specific enhancers. Moreover, genes with dynamic expression patterns appear to frequently be located near multiple such enhancers (see below and Figure S3).
Comparing open chromatin marks between L1s and hASCs, we found that ~15-30% of marks identified in one model were shared with the other model (that is, orthologous sequences contained the same chromatin marks). Given that regions enriched for each open chromatin mark only covered ~2-4% of each genome, this represents a highly significant degree of overlap. Regions with the same size distributions randomly placed across the two genomes would have an expected overlap of less than 0.5%. Nevertheless, the majority (70-85%) of distal open chromatin marks were model-specific.
Orthologs that were only associated with dynamic open chromatin marks in one of the models often showed discordant expression patterns. For example, orthologs whose expression increased more in L1s than in hASCs were also more likely to be associated with adipocyte-specific H3K27ac only in L1s, and vice versa (Figure 2G). This suggests that model-adipocyte-specific open chromatin marks correlate with model-specific enhancers. Interestingly, orthologous genes with similar expression patterns often had similar chromatin marks nearby, but the specific locations of these marks were typically model-specific. For example, at orthologous loci induced ≥2-fold in both models, the majority (84%) of adipocyte-specific H3K27ac regions
NIH-PA Author Manuscript
NIH-PA Author Manuscript
in L1s were not shared with hASCs and vice versa. Their expression patterns therefore appear to be better conserved than the specific enhancers that regulate them (below, we verify this observation through functional analyses).
PPARγ localization
We next analyzed the distribution of binding sites for PPARγ in mature L1 and hASC adipocytes (day 7/9). PPARγ is a nuclear receptor that is recruited to PPAR response elements (PPREs) during adipogenesis as a heterodimer with retinoid X receptors (RXRs; Ijpenberg et al., 1997), and primarily functions as a transcriptional activator (Lefterova et al., 2008; Nielsen et al. 2008). We found that PPARγ was largely localized to distal regions enriched for open chromatin marks. The vast majority of PPARγ binding sites were not shared between L1s and hASCs and this could be explained in part by turnover of its motif in the genome sequences. Loci with PPARγ binding sites in both L1s and hASCs were, however, highly enriched for genes with functions relevant to known adipocyte biology.
We detected 7,142 and 39,986 PPARγ binding sites in L1s and hASCs, respectively (1% FDR; Table S4), with enrichment scores spanning two orders of magnitude. The excess number of human sites primarily reflects the identification of more weak binding sites (Supplementary Experimental Procedures). Performing ChIP-Seq with a different PPARγ antibody yielded similar results, and the L1 sites reported here showed good concordance with 5,299 sites previously detected in this model using ChIP-chip (Lefterova et al., 2008; Figure S4). The PPARγ binding sites followed qualitatively similar patterns in L1s and hASCs, with the vast majority (85-95%) overlapping open chromatin marks (Figure 3A). Ab initio motif discovery recovered motifs that were similar to the canonical PPARγ/RXR DR1 motif (Figure 3B). There are, however, ~1.5 million instances of these motifs in each genome; this implies that we detected PPARγ binding at only ~1 in 200 motifs in the mouse genome. Other factors must therefore contribute to binding site selectivity. Notably, a motif instance was ~15 times more likely be bound by PPARγ in L1 adipocytes if it overlapped a region enriched for open chromatin marks in pre-adipocytes (pFisher < 10-60). In fact, ~77% of all PPARγ binding sites detected in L1s were located in such regions. This suggests that PPARγ recruitment during adipogenesis is strongly influenced by the pre-adipocyte chromatin state.
The majority (79%) of sites bound by PPARγ in L1s were not shared with hASCs, despite the larger number of sites detected in the latter model. Notably, 34% of L1 PPARγ binding sites that could not be mapped to the human genome resided within rodent-specific transposable element insertions, which implies that they evolved after the mouse and human lineages diverged. If an L1 binding site could be mapped to an orthologous human sequence, the presence of PPARγ binding in hASCs correlated with the presence a conserved motif and open chromatin marks (Figure 3C). Evolutionary turnover of DR1-like motifs is therefore likely to contribute to the differential recruitment of PPARγ and open chromatin marks between the two models.
To explore the correlation between PPARγ recruitment and gene expression, we again assumed that each binding site was associated with the closest known protein-coding gene. We found that genes associated with PPARγ in L1s were ~3 times more likely than non-associated genes to be up-regulated ≥2-fold (pFisher < 10-60). The majority (84%) of genes associated with PPARγ binding sites were not up-regulated, but the likelihood that a gene was up-regulated increased when an associated PPARγ binding site had a higher ChIP enrichment score; was shared with hASCs; or overlapped adipocyte-specific H3K27ac (Figure 3D). The correlation between up-regulation and gain of H3K27ac is notable. It suggests that while PPARγ binding is biased towards regions that were already acetylated in pre-adipocytes, PPARγ binding sites that recruit HATs to new locations are more likely to be functionally relevant.
NIH-PA Author Manuscript
NIH-PA Author Manuscript
Concentrating on genes with ‘dynamic’ PPARγ binding sites that gain H3K27ac in L1s, we found that those for which the orthologous human gene was not associated with H3K27ac in hASCs were significantly more likely to show greater up-regulation in L1s than in hASCs, and
vice versa (pFisher < 10-4; Figure 3E). Model-specific PPREs are therefore likely to contribute to differential gene regulation in the two models. Annotation enrichment analysis (Dennis et al., 2003) revealed, however, that genes that were associated with PPARγ binding sites and up-regulated in both models were strongly enriched for components of the classic PPARγ signaling pathway, as well as essential adipocyte functions related to lipid metabolism and cellular respiration (Figure 3F). Notably, only ~57% of these concordantly up-regulated genes actually shared orthologous PPARγ binding sites. Thus, PPARγ targeting of adipocyte genes appears to be better conserved than the specific PPREs that mediate PPARγ recruitment to these genes.
CTCF localization
We next analyzed the distribution of binding sites for CTCF, a DNA binding protein that plays a key role in higher order organization of chromatin and is associated with insulator and enhancer-blocking activities (Phillips and Corces, 2009). We found that CTCF recruitment was relatively invariant during differentiation in each model, but that the specific binding sites differed significantly between the two models. These differences appear to be largely caused by evolutionary turnover of CTCF motifs.
We detected ~43,000 CTCF binding sites at each time point in each model (1% FDR). The sites followed largely intergenic distributions similar to that described in other cell types (Barski et al., 2007; Kim et al., 2007; Xi et al., 2007; Figure 3G). Ab initio motif discovery recovered the known CTCF motif (Figure 3H) and most (~84%) binding sites overlapped a good match to this motif. Less than half overlapped H3K27ac or H3K4 methylation, suggesting that these open chromatin marks are not directly linked to CTCF localization. Most CTCF binding sites detected at one time point were also detected at other time points. For example, ~84% of CTCF binding sites in mature L1 adipocytes were also bound in L1 pre-adipocytes. In contrast, among the ~70% of binding sites in L1s that could be mapped to orthologous regions in the human genome, only about half (~53%) were also bound in hASCs. Shared CTCF binding in hASCs was strongly correlated with the presence of a conserved CTCF motif in the human genome (Figure 3I). As was the case for PPARγ, among the remaining ~30% of CTCF binding sites in L1s that could not be mapped, ~65%, including thousands of the most strongly enriched sites, were located within rodent-specific transposon insertions.
Functional and comparative analysis of the Cd36/CD36 locus
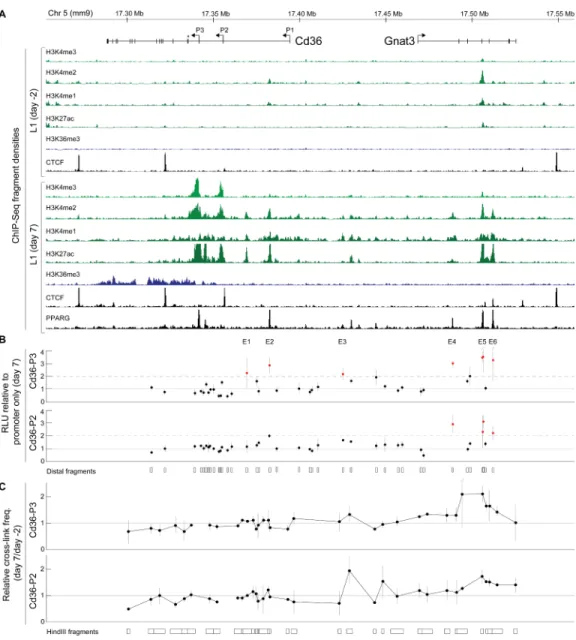
In the previous sections, we largely relied on genome-wide statistical analysis. To explore the relationships between open chromatin marks, TF localization and cis-regulatory elements in more depth, we focused on the Cd36/CD36 locus. This PPARγ-responsive gene encodes a long-chain fatty acid receptor expressed in adipocytes and other cell types (Yu et al., 2003), and was one of the most strongly induced genes in both L1s and hASCs. We confirmed the activity of multiple adipocyte-specific promoters and enhancers predicted by the L1 chromatin state maps using functional assays. Consistent with our genome-wide results, comparative analysis revealed that while the Cd36/CD36 expression pattern is similar between L1s and hASCs, several cis-regulatory elements active in L1s are not conserved in the human genome. We first analyzed the murine Cd36 locus, which contains three promoters (P1-P3, Figure 4A) and encodes five transcripts with identical coding sequences. In pre-adipocytes, we detected three CTCF binding sites flanking the locus, but little enrichment for any of the histone modifications. In adipocytes, we detected H3K4me3 at P2 and P3, suggesting that these are
NIH-PA Author Manuscript
NIH-PA Author Manuscript
the major promoters used in L1s. To confirm this, we quantified each Cd36 isoform using RT-qPCR. As expected, the vast majority (~99%) of transcripts originated from P2 and P3 (Figure S5A). We detected six adipocyte-specific H3K27ac regions across a ~150 kb region upstream of the two active promoters, five of which also contained PPARγ binding sites. We also detected broad adipocyte-specific enrichment of H3K4me2/me1 across this upstream region.
To test whether the distal open chromatin marks identified adipocyte-specific enhancers, we performed transient reporter assays in L1 pre-adipocytes and adipocytes. We cloned 21 ~1 kb sequences that overlapped the six adipocyte-specific H3K27ac regions as well as most distal H3K4me2/me1 regions, and 17 additional sequences without any ChIP enrichment as negative controls (Table S5). Each cloned sequence was inserted into three different plasmids carrying a luciferase gene downstream of P2, P3 or no promoter (114 distinct plasmids). Plasmids with no promoter showed uniformly low reporter expression, suggesting that the distal regions possess little intrinsic promoter activity (Figure S5B). Plasmids with P2 or P3 showed reporter expression levels that were positively correlated with the ChIP enrichment scores of the distal regions they contained sequences from (Figure S6). In particular, sequences from six distinct regions (E1-E6) enhanced the activity of P3 ≥2-fold in adipocytes (Figure 4B). Notably, these corresponded to five of the six distal adipocyte-specific H3K27ac regions, while the sixth (E3) was primarily enriched for H3K4me1. Sequences from E4-E6 also enhanced the activity of P2 ≥2-fold in adipocytes. By contrast, only one plasmid (E5 upstream of P2) showed comparable enhancer activity in pre-adipocytes. This confirms that dynamic H3K27ac enrichment is a signature of cell type-specific enhancers.
To determine whether E1-E6 physically interact with P2 and P3 in their native chromatin context (Ptashne, 1986), we used chromatin conformation capture (Dekker et al., 2002). We found that the frequency of interactions between the two promoters and E3-E6, which are located 75-150 kb upstream, increased ~2-fold in adipocytes relative to pre-adipocytes (Figure 4C; Table S5). E1 and E2, which are located much closer to the promoters, also showed consistent but less significant (~1.1-fold) changes. We conclude that Cd36 is regulated by multiple distal enhancers, including three that are located within introns of the neighboring gene Gnat3.
We next compared the murine Cd36 locus to human CD36 (Figure 5A). All three murine promoters were conserved in the human genome. In contrast to L1s, however, we only detected H3K4me3 at P3, indicating that this is the major promoter used in hASCs.
Three of the six enhancers identified in L1s (E2, E4 and E6) were shared with hASCs. Of the three L1-specific enhancers, E1 and E3 were located in non-repetitive sequences in the mouse genome, but had no recognizable orthologs in human. Most of the E5 sequence could be mapped, but the chromatin marks across this ~1 kb region in L1s were not shared with hASCs. Upon close inspection, we found that the PPARγ motif in E5 in the mouse genome was located in a small (~100bp) fragment of a rodent-specific LINE/L1 transposon (Figure 5B). Insertion of this element therefore appears to have generated a species-specific PPRE. Conversely, we detected at least two putative enhancers/PPREs in hASCs (based on H3K27ac and PPARγ enrichment) that could not be mapped to the murine genome.
Two of the three distal CTCF binding sites in L1s were also shared with hASCs. The third site, located upstream of E6, could be mapped to an orthologous region that was not bound in hASCs (Figure 5C). CTCF did, however, bind to a site ~5 kb away in hASCs that was not shared with L1s. Inspection revealed that the CTCF motif bound in L1s was not conserved in the human genome, and vice versa (Figure 5D). Thus, the approximate location of this putative insulator element appears to be conserved even though the specific motif instances are not. We conclude
NIH-PA Author Manuscript
NIH-PA Author Manuscript
that while the overall regulatory architecture of the Cd36/CD36 locus is conserved, there has been substantial turnover of specific cis-regulatory elements.
Identification of novel trans-regulatory factors
Finally, we explored whether we could use the chromatin state maps to identify trans-regulatory factors in the adipogenic GRN. L1s and hASCs each express hundreds of sequence-specific TFs, not all of which are likely to be directly involved in adipogenesis. While our data show that many active cis-regulatory elements are not shared, the identities and sequence-specificities of the factors that interact with them are likely to be better conserved (Weirauch and Hughes, 2009). Accordingly, we enumerated instances of all known TF motifs within regions that underwent chromatin remodeling in L1s or hASCs, and then ranked the motifs according to their relative enrichment in adipocyte- or pre-adipocyte-specific regions. Strikingly, many of the most enriched motifs from both models corresponded to known pro-and anti-adipogenic regulatory factors (Table S6).
Figure 6 shows the most enriched motifs in regions that (1) gained or lost H3K27ac during L1 adipogenesis and (2) could be mapped to orthologous regions with the same mark in hASCs. Each of these motifs was enriched in both the mouse and the orthologous human sequence. Among the motifs most enriched within adipocyte-specific H3K27ac regions are those recognized by PPARγ/RXR and C/EBP proteins, which together form the core adipogenic GRN. The list of motifs also contained other known regulators of adipogenesis, such as the IRF, GATA, NF-κB and STAT families. The motifs most enriched within pre-adipocyte-specific H3K27ac regions are recognized by several mediators of growth factor responses and control cell proliferation, such as AP-1 (FOS/JUN), SRF and MEF2A, as well as a variety of developmental factors from the homeodomain and POU families.
The presence of multiple known regulators near the top of the ranked motif lists suggested that other TFs with similar ranks, but no previous evidence of involvement in adipogenesis, are good candidates for follow-up. We selected two of these factors for further analysis: promyelocytic leukemia zinc finger protein (PLZF, encoded by Zbtb16) and serum response factor (SRF, encoded by Srf). Expression of both of these factors was detected in our L1 and hASC microarray data. We also confirmed their expression in mouse adipose tissue and differentiating L1 cells using RT-qPCR (Figure S7). To assess whether these factors regulate adipogenesis, we used gain- and loss-of-function assays. We found that independent over-expression of either factor in L1 cells (Figure S7) was sufficient to repress adipogenesis, as evidenced by reduced lipid accumulation (Figure 7A) and diminished markers of terminal differentiation (Figure 7B, C). Conversely, RNAi-mediated knockdown of PLZF or SRF (Figure S7) enhanced L1 adipogenesis, as assessed by the same parameters (Figure 7D, E, F). Similar effects were obtained with two unique hairpins for each factor. These data indicate that novel trans-regulatory factors in GRNs can be identified by an integrated approach
incorporating epigenomic profiling and motif enrichment analysis.
DISCUSSION
We have generated comparative chromatin state maps, TF localization maps and gene expression profiles from differentiating L1s and hASCs. Our initial analysis of the data demonstrates their utility to studies of chromatin remodeling and gene regulation in adipogenesis and cellular differentiation.
Comparisons between time points revealed a close correlation between changes in gene expression and changes in distal open chromatin marks. While only a minority of regions enriched for H3K27ac changed during adipogenesis, this dynamic subset appeared to be highly enriched for adipocyte and pre-adipocyte-specific enhancers. Thus, profiling chromatin states
NIH-PA Author Manuscript
NIH-PA Author Manuscript
before and after induction of a phenotype of interest can help pinpoint regulatory elements that are directly related to that phenotype. Importantly, gain of histone acetylation might help distinguish functional PPREs from non-productive PPARγ binding sites. Similar observations were recently reported for endotoxin- and androgen-responsive enhancers in macrophages (Ghisletti et al. 2010) and prostate cancer cells (He et al. 2010), respectively. We also found that dynamically expressed genes were often associated with multiple distal elements that showed coordinated changes in chromatin state. Elucidating how these distinct elements interact with each other and their target genes will be important to our understanding of mammalian gene regulation.
Comparisons between the two models revealed significant overlaps of chromatin marks in orthologous regions, which is consistent with a previous study of mouse and human fibroblasts (Bernstein et al., 2005). The majority of open chromatin marks and TF binding sites were, however, not shared. Strikingly, differential recruitment of PPARγ and CTCF was correlated with turnover of their motifs. This suggests that many model-specific TF binding sites and associated chromatin marks reflect genetic divergence between mouse and human, rather than ontogenic or technical differences between L1s and hASCs. Similar turnover have recently been observed in hepatocytes (Odom et al., 2007; Schmidt et al. 2010). Interestingly, many TF binding sites that could not be mapped between the genomes were located within lineage-specific transposon insertions, which is consistent with transposons being a major creative force in the evolution of mammalian gene regulation (Lowe et al., 2007; Mikkelsen et al., 2007b). A key remaining question is to what extent turnover of TF binding sites reflects adaptation, or simply GRN ‘drift’ that may affect expression levels, but has no significant biological impact. Importantly, we found that orthologs targeted by PPARγ in both models were enriched for functions relevant to known adipocyte biology. Moreover, analysis of the orthologous Cd36/CD36 loci revealed multiple species-specific regulatory elements, despite their similar expression patterns. The presence of multiple distal regulatory elements with similar activities near a single gene might facilitate turnover of individual elements by providing redundancy.
Finally, motif enrichment analysis revealed that the close relationship between chromatin state and TF binding sites can be utilized to infer novel trans-regulators. We previously identified roles for interferon regulatory factors (IRFs) and the orphan nuclear receptor COUP-TFII in adipogenesis based on analysis of chromatin at a limited number of loci (Eguchi et al., 2008; Xu et al., 2008). Using our genome-wide data, we discovered two additional factors, PLZF and SRF, with anti-adipogenic activity. PLZF is a member of the BTB/POZ domain family of TFs (Kelly and Daniel, 2006) and appears to function primarily as a repressor by recruiting nuclear receptor co-repressors (N-CoRs) and histone deacetylases (HDACs). SRF is a MADS-box TF originally named for its role in mediating the effects of serum stimulation (Norman et al., 1988). We are currently attempting to understand the specific functions of PLZF and SRF in adipogenesis. In addition, we are using the chromatin state maps to identify other novel factors in the adipogenic GRN. This approach can be expected to become increasingly powerful as the completeness and quality of TF motif databases improve. More generally, we expect that it can be applied to studies of a variety of other gene regulatory networks.
EXPERIMENTAL PROCEDURES
Oligonucleotides and antibodiesAll primers, hybridization probes, hairpin sequences and antibodies used are listed in Table S7 and the Supplementary Experimental Procedures.
NIH-PA Author Manuscript
NIH-PA Author Manuscript
Cell culture
3T3-L1 cells were cultured and differentiated as described in (Eguchi et al., 2008). Human abdominal adipose tissue was obtained with informed consent from a 33-year old Caucasian female (BMI = 32.96 Kg/m2) undergoing lipoaspiration (Pennington Biomedical Research Center Institutional Review Board, Protocol PBRC24030). hASCs were isolated as described in (Dubois et al., 2008) and differentiated using a protocol modified from (Hebert et al., 2009). For additional details, see the Supplementary Experimental Procedures.
ChIP-Seq
L1 cells and hASCs were treated with 1% formaldehyde for 10 min at 37°C and stored at -80 °C. ChIP and Illumina sequencing library construction were performed as described in (Mikkelsen et al., 2007a). The computational analysis is described in the Supplementary Experimental Procedures.
RNA preparation and expression analysis
Total RNA was prepared using TRIzol (Invitrogen). mRNA expression data were generated using GeneChip arrays (Affymetrix). miRNA expression data were generated using BeadChips (Illumina). RT-qPCR were performed using SuperScript III (Invitrogen) or RETROscript kit (Ambion), SYBR Green and the 7900HT Real-Time PCR system (Applied Biosystems). Annotation enrichment analysis was performed using DAVID 6.7 (Dennis et al., 2003).
Reporter assays
Cd36 P2, P3 and 38 distal sequences were PCR amplified from a BAC (RP23-175A11; BACPAC Resource Center) and cloned into pGL4.10 (Promega) using In-Fusion (Clontech). L1 cells were nucleofected with solution SE (Lonza) and the FF-150 and DS-137 programs for pre-adipocytes and adipocytes, respectively. Luciferase activities were measured using Dual-Glow (Promega) and an EnVision 2103 multilabel reader (PerkinElmer).
Chromosome conformation capture (3C)
3C was performed using RT-qPCR with FAM/IBFQ hybridization probes (IDT) and HindIII digestion as described in (Hagege et al., 2007). The normalization library was generated from the RP23-175A11 BAC.
Sequence analysis
All sequence analyses were performed on the hg18 (human) and mm9 (mouse) reference genome sequences and annotations (http://genome.ucsc.edu). Orthologous regions were mapped using liftOver (UCSC), requiring >10% nucleotide overlap. Motif discovery was performed using MEME 4.3 (Bailey and Elkan, 1994). Motif instance matching was performed using FIMO with a p-value threshold of 10-4. The motif enrichment analysis was performed using TRANSFAC 11.3 and UniPROBE (Oct 7, 2009), as described in the Supplementary Experimental Procedures.
PLZF and SRF overexpression and knockdown
ORFs were PCR amplified and cloned into pMSCV (Clontech). shRNAs were synthesized and cloned into pSIREN (Clontech). Retrovirus were generated using Phoenix cells and CellPhect (Amersham Biosciences), and used to transduce L1 pre-adipocyte subclones that typically differentiate at 30-50% efficiency. For additional details, see the Supplementary Experimental Procedures.
NIH-PA Author Manuscript
NIH-PA Author Manuscript
Sequence and microarray data deposition
All microarray expression and sequencing data have been deposited to the NCBI GEO database (http://www.ncbi.nlm.nih.gov/geo/) under accession number GSE20752.
Supplementary Material
Refer to Web version on PubMed Central for supplementary material.
Acknowledgments
The authors would like to thank the staff of the Broad Institute for assistance with data generation, and Gang Yu at the Tissue Culture Core Facility, Pennington Biomedical Research Center, for isolating the hASCs. This project was supported by funds from the Broad Institute, NIH DK63906 (EDR), an American Diabetes Association Career Development Award (EDR), the Pennington Biomedical Research Foundation (JMG), and NORC Center Grant # 1P30 DK072476 (JMG).
REFERENCES
Arnone MI, Davidson EH. The hardwiring of development: organization and function of genomic regulatory systems. Development 1997;124:1851–1864. [PubMed: 9169833]
Aust L, Devlin B, Foster SJ, Halvorsen YD, Hicok K, du Laney T, Sen A, Willingmyre GD, Gimble JM. Yield of human adipose-derived adult stem cells from liposuction aspirates. Cytotherapy 2004;6:7– 14. [PubMed: 14985162]
Bailey TL, Elkan C. Fitting a mixture model by expectation maximization to discover motifs in biopolymers. Proc Int Conf Intell Syst Mol Biol 1994;2:28–36. [PubMed: 7584402]
Barski A, Cuddapah S, Cui K, Roh TY, Schones DE, Wang Z, Wei G, Chepelev I, Zhao K. High-resolution profiling of histone methylations in the human genome. Cell 2007;129:823–837. [PubMed: 17512414] Bernstein BE, Kamal M, Lindblad-Toh K, Bekiranov S, Bailey DK, Huebert DJ, McMahon S, Karlsson
EK, Kulbokas EJ 3rd, Gingeras TR, et al. Genomic maps and comparative analysis of histone modifications in human and mouse. Cell 2005;120:169–181. [PubMed: 15680324]
Birney E, Stamatoyannopoulos JA, Dutta A, Guigo R, Gingeras TR, Margulies EH, Weng Z, Snyder M, Dermitzakis ET, Thurman RE, et al. Identification and analysis of functional elements in 1% of the human genome by the ENCODE pilot project. Nature 2007;447:799–816. [PubMed: 17571346] Dekker J, Rippe K, Dekker M, Kleckner N. Capturing chromosome conformation. Science
2002;295:1306–1311. [PubMed: 11847345]
Dennis G Jr. Sherman BT, Hosack DA, Yang J, Gao W, Lane HC, Lempicki RA. DAVID: Database for Annotation, Visualization, and Integrated Discovery. Genome Biol 2003;4:P3. [PubMed: 12734009] Dubois SG, Floyd EZ, Zvonic S, Kilroy G, Wu X, Carling S, Halvorsen YD, Ravussin E, Gimble JM.
Isolation of human adipose-derived stem cells from biopsies and liposuction specimens. Methods Mol Biol 2008;449:69–79. [PubMed: 18370084]
Eguchi J, Yan QW, Schones DE, Kamal M, Hsu CH, Zhang MQ, Crawford GE, Rosen ED. Interferon regulatory factors are transcriptional regulators of adipogenesis. Cell Metab 2008;7:86–94. [PubMed: 18177728]
Ghisletti S, Barozzi I, Mietton F, Polletti S, De Santa F, Venturini E, Gregory L, Lonie L, Chew A, Wei CL, et al. Identification and Characterization of Enhancers Controlling the Inflammatory Gene Expression Program in Macrophages. Immunity 2010;32:317–328. [PubMed: 20206554]
Green H, Meuth M. An established pre-adipose cell line and its differentiation in culture. Cell 1974;3:127– 133. [PubMed: 4426090]
Hagege H, Klous P, Braem C, Splinter E, Dekker J, Cathala G, de Laat W, Forne T. Quantitative analysis of chromosome conformation capture assays (3C-qPCR). Nat Protoc 2007;2:1722–1733. [PubMed: 17641637]
He HH, Meyer CA, Shin H, Bailey ST, Wei G, Wang Q, Zhang Y, Xu K, Ni M, Lupien M, et al. Nucleosome dynamics define transcriptional enhancers. Nat Genet 2010;42:343–347. [PubMed: 20208536]
NIH-PA Author Manuscript
NIH-PA Author Manuscript
Hebert TL, Wu X, Yu G, Goh BC, Halvorsen YD, Wang Z, Moro C, Gimble JM. Culture effects of epidermal growth factor (EGF) and basic fibroblast growth factor (bFGF) on cryopreserved human adipose-derived stromal/stem cell proliferation and adipogenesis. J Tissue Eng Regen Med 2009;3:553–561. [PubMed: 19670348]
Heintzman ND, Hon GC, Hawkins RD, Kheradpour P, Stark A, Harp LF, Ye Z, Lee LK, Stuart RK, Ching CW, et al. Histone modifications at human enhancers reflect global cell-type-specific gene expression. Nature 2009;459:108–112. [PubMed: 19295514]
Hon GC, Hawkins RD, Ren B. Predictive chromatin signatures in the mammalian genome. Hum Mol Genet 2009;18:R195–201. [PubMed: 19808796]
Ijpenberg A, Jeannin E, Wahli W, Desvergne B. Polarity and specific sequence requirements of peroxisome proliferator-activated receptor (PPAR)/retinoid X receptor heterodimer binding to DNA. A functional analysis of the malic enzyme gene PPAR response element. J Biol Chem
1997;272:20108–20117. [PubMed: 9242684]
Johnson DS, Mortazavi A, Myers RM, Wold B. Genome-wide mapping of in vivo protein-DNA interactions. Science 2007;316:1497–1502. [PubMed: 17540862]
Kelly KF, Daniel JM. POZ for effect--POZ-ZF transcription factors in cancer and development. Trends Cell Biol 2006;16:578–587. [PubMed: 16996269]
Kim TH, Abdullaev ZK, Smith AD, Ching KA, Loukinov DI, Green RD, Zhang MQ, Lobanenkov VV, Ren B. Analysis of the vertebrate insulator protein CTCF-binding sites in the human genome. Cell 2007;128:1231–1245. [PubMed: 17382889]
Lefterova MI, Zhang Y, Steger DJ, Schupp M, Schug J, Cristancho A, Feng D, Zhuo D, Stoeckert CJ Jr. Liu XS, et al. PPARgamma and C/EBP factors orchestrate adipocyte biology via adjacent binding on a genome-wide scale. Genes Dev 2008;22:2941–2952. [PubMed: 18981473]
Lowe CB, Bejerano G, Haussler D. Thousands of human mobile element fragments undergo strong purifying selection near developmental genes. Proc Natl Acad Sci U S A 2007;104:8005–8010. [PubMed: 17463089]
Mikkelsen TS, Ku M, Jaffe DB, Issac B, Lieberman E, Giannoukos G, Alvarez P, Brockman W, Kim TK, Koche RP, et al. Genome-wide maps of chromatin state in pluripotent and lineage-committed cells. Nature 2007a;448:553–560. [PubMed: 17603471]
Mikkelsen TS, Wakefield MJ, Aken B, Amemiya CT, Chang JL, Duke S, Garber M, Gentles AJ, Goodstadt L, Heger A, et al. Genome of the marsupial Monodelphis domestica reveals innovation in non-coding sequences. Nature 2007b;447:167–177. [PubMed: 17495919]
Nielsen R, Pedersen TA, Hagenbeek D, Moulos P, Siersbaek R, Megens E, Denissov S, Børgesen M, Francoijs KJ, Mandrup S, Stunnenberg HG. Genome-wide profiling of PPARgamma:RXR and RNA polymerase II occupancy levels reveals temporal activation of distinct metabolic pathways and changes in RXR dimer composition during adipogenesis. Genes Dev 2008;22:2953–2967. [PubMed: 18981474]
Noer A, Lindeman LC, Collas P. Histone H3 modifications associated with differentiation and long-term culture of mesenchymal adipose stem cells. Stem Cells Dev 2009;18:725–736. [PubMed: 18771397] Norman C, Runswick M, Pollock R, Treisman R. Isolation and properties of cDNA clones encoding SRF,
a transcription factor that binds to the c-fos serum response element. Cell 1988;55:989–1003. [PubMed: 3203386]
Odom DT, Dowell RD, Jacobsen ES, Gordon W, Danford TW, MacIsaac KD, Rolfe PA, Conboy CM, Gifford DK, Fraenkel E. Tissue-specific transcriptional regulation has diverged significantly between human and mouse. Nat Genet 2007;39:730–732. [PubMed: 17529977]
Phillips JE, Corces VG. CTCF: master weaver of the genome. Cell 2009;137:1194–1211. [PubMed: 19563753]
Ptashne M. Gene regulation by proteins acting nearby and at a distance. Nature 1986;322:697–701. [PubMed: 3018583]
Robertson G, Hirst M, Bainbridge M, Bilenky M, Zhao Y, Zeng T, Euskirchen G, Bernier B, Varhol R, Delaney A, et al. Genome-wide profiles of STAT1 DNA association using chromatin
immunoprecipitation and massively parallel sequencing. Nat Methods 2007;4:651–657. [PubMed: 17558387]
NIH-PA Author Manuscript
NIH-PA Author Manuscript
Rosen ED, MacDougald OA. Adipocyte differentiation from the inside out. Nat Rev Mol Cell Biol 2006;7:885–896. [PubMed: 17139329]
Rosen ED, Spiegelman BM. Adipocytes as regulators of energy balance and glucose homeostasis. Nature 2006;444:847–853. [PubMed: 17167472]
Schmidt D, Wilson MD, Ballester B, Schwalie PC, Brown GD, Marshall A, Kutter C, Watt S, Martinez-Jimenez CP, Mackay S, et al. Five-Vertebrate ChIP-seq Reveals the Evolutionary Dynamics of Transcription Factor Binding. Science. 2010
Valouev A, Johnson DS, Sundquist A, Medina C, Anton E, Batzoglou S, Myers RM, Sidow A. Genome-wide analysis of transcription factor binding sites based on ChIP-Seq data. Nat Methods 2008;5:829– 834. [PubMed: 19160518]
Wang Z, Zang C, Rosenfeld JA, Schones DE, Barski A, Cuddapah S, Cui K, Roh TY, Peng W, Zhang MQ, Zhao K. Combinatorial patterns of histone acetylations and methylations in the human genome. Nat Genet 2008;40:897–903. [PubMed: 18552846]
Weirauch MT, Hughes TR. Conserved expression without conserved regulatory sequence: the more things change, the more they stay the same. Trends Genet 2009;26:66–74. [PubMed: 20083321] Xi H, Shulha HP, Lin JM, Vales TR, Fu Y, Bodine DM, McKay RD, Chenoweth JG, Tesar PJ, Furey
TS, et al. Identification and characterization of cell type-specific and ubiquitous chromatin regulatory structures in the human genome. PLoS Genet 2007;3:e136. [PubMed: 17708682]
Xu Z, Yu S, Hsu CH, Eguchi J, Rosen ED. The orphan nuclear receptor chicken ovalbumin upstream promoter-transcription factor II is a critical regulator of adipogenesis. Proc Natl Acad Sci U S A 2008;105:2421–2426. [PubMed: 18250317]
Yu S, Matsusue K, Kashireddy P, Cao WQ, Yeldandi V, Yeldandi AV, Rao MS, Gonzalez FJ, Reddy JK. Adipocyte-specific gene expression and adipogenic steatosis in the mouse liver due to peroxisome proliferator-activated receptor gamma1 (PPARgamma1) overexpression. J Biol Chem
2003;278:498–505. [PubMed: 12401792]
Zhang X, Odom DT, Koo SH, Conkright MD, Canettieri G, Best J, Chen H, Jenner R, Herbolsheimer E, Jacobsen E, et al. Genome-wide analysis of cAMP-response element binding protein occupancy, phosphorylation, and target gene activation in human tissues. Proc Natl Acad Sci U S A 2005;102:4459–4464. [PubMed: 15753290]
NIH-PA Author Manuscript
NIH-PA Author Manuscript
Figure 1. Chromatin state and TF localization near Pparg during L1 adipogenesis
Histograms of ChIP fragments across the Pparg locus, normalized to fragments per 10 million aligned reads, for each of the profiled histone modifications and TFs at four time points during L1 adipogenesis. All histograms are shown on the same scale and high values were truncated as necessary. See also Figure S1-S2 and Tables S1-S2.
NIH-PA Author Manuscript
NIH-PA Author Manuscript
Figure 2. Histone modifications and distal cis-regulatory elements
(A) Fractions of genes associated with at least one adipocyte (Ad), pre-adipocyte (Pre) or invariant H3K27ac region in L1s, conditional on changes in expression levels in adipocytes (max of days 2 and 7) relative to pre-adipocytes (max of days -2 and 0).
(B) Fractions of genes that showed ≥2-fold up- (left) or down-regulation (right) in L1s, conditional on the maximal enrichment score of associated H3K27ac regions.
(C) Fractions of genes that showed ≥2-fold up- (left) or down-regulation (right) in L1s, conditional on the number of associated H3K27ac regions.
(D) Fractions of genes associated with at least one H3K27ac region in hASCs, conditional on their changes in expression levels in adipocytes (max[day 3/9]) relative to pre-adipocytes (max [day -2/0]).
(E) Fractions of genes that showed ≥2-fold up- (left) or down-regulation (right) in hASCs, conditional on the maximal enrichment score of associated H3K27ac regions.
(F) Fractions of genes that showed ≥2-fold up- (left) or down-regulation (right) in hASCs, conditional on the number of associated H3K27ac regions.
NIH-PA Author Manuscript
NIH-PA Author Manuscript
(G) Fraction of genes associated with at least one adipocyte-specific H3K27ac region in L1s or hASCs, conditional on the ratio of their changes in expression levels during L1 and hASC adipogenesis.
See also Figure S3 and Tables S3.
NIH-PA Author Manuscript
NIH-PA Author Manuscript
Figure 3. PPARγ and CTCF localization in adipocytes
(A) Summary of PPARγ binding sites in L1 and hASC adipocytes. For each quartile of ChIP enrichment scores, the columns show (from left to right) the percentage of sites located ≤ 2 kb from a known promoter; sites overlapping a PPARγ motif; sites overlapping H3K4me3/me2/ me1 and/or H3K7ac in adipocytes and in pre-adipocytes; sites that could be mapped to an orthologous region in the other genome; and mapped sites that were also bound by PPARγ in the other model.
(B) Motifs learned ab initio from sequences +/- 100 bp from the top 800 PPARγ binding sites in L1s (ranked by enrichment scores). Virtually identical motifs were learned from hASCs. (C) Correlations between PPARγ binding, the presence of a conserved motif instance, and open chromatin marks in human genomic regions orthologous to L1 PPARγ binding sites.
(D) Fractions of genes that were up-regulated ≥2-fold in L1s or hASCs, conditional on association with a PPARγ binding site. ‘Orthologous’ PPARγ binding sites could be mapped to an orthologous region also bound in the other model. ‘Dynamic’ PPARγ binding sites increased H3K27ac enrichment ≥5-fold.
(E) Fractions of genes that were up-regulated ≥2-fold in L1s or hASCs, conditional on association with ‘dynamic’ PPARγ binding sites.
(F) Annotation enrichment analysis of orthologs associated with PPARγ binding sites and up-regulated ≥2-fold. P-values are Benjamini-corrected.
(G) Summary of CTCF binding sites in L1 and hASC adipocytes.
(H) Motif learned ab initio from sequences +/- 100 bp from the top 800 CTCF binding sites in L1s (ranked by enrichment scores). A virtually identical motif was learned from hASCs. (I) Correlations between CTCF binding, the presence of a conserved motif instance, and open chromatin marks in human genomic regions orthologous to L1 CTCF binding sites.
NIH-PA Author Manuscript
NIH-PA Author Manuscript
See also Figure S4 and Table S4.
NIH-PA Author Manuscript
NIH-PA Author Manuscript
Figure 4. Identification of adipocyte-specific Cd36 cis-regulatory elements
(A) Chromatin state maps of the ~300 kb Cd36/Gnat3 locus from L1 pre-adipocytes (day -2) and adipocytes (day 7). Cd36 has three known promoters (P1-P3). Asterisk, start of the protein-coding sequence.
(B) Reporter assays. Each dot shows the ratio of normalized luciferase expression (RLU) from plasmids carrying distal fragments upstream of P2 or P3 over the estimated basal activity of the promoter. Fragments from six distinct distal sites (E1-E6) showed ≥2-fold mean enhancement of expression from P3 (orange dots, top). Three of these (orange dots, bottom) also showed ≥2-fold mean enhancement of expression from P2. E5 was present within two overlapping fragments. Error bars show standard errors of the means.
(C) 3C. Each dot shows the cross-linking frequency of a HindIII fragment to P3 (top) or P2 (bottom) in adipocytes relative to pre-adipocytes. Error bars show standard errors of the means. See also Figures S5-S6 and Table S5.
NIH-PA Author Manuscript
NIH-PA Author Manuscript
Figure 5. Comparison of Cd36/CD36 in L1 and hASC adipocytes
(A) Genomic and chromatin state maps from L1 (top) and hASC (bottom) adipocytes. Orthology tracks show regions mapped from the mouse to the human genome (pink) and vice
versa (red). Grey vertical lines highlight orthologous sites, those terminated by X highlight
sites that could not be mapped. Orange dots show the E1-E6 enhancers identified in L1s. (B) Expanded view of E5/E6 shows the locations of PPARγ motifs (blue bars) and transposons (grey/black) in the genomic sequences. The PPARγ motif underlying the peak of the L1 ChIP-Seq signal lies within a rodent-specific LINE/L1 fragment (arrow).
(C) Expanded view of an upstream region shows CTCF ChIP-Seq signals at non-orthologous sites separated by ~2.4-5 kb in L1s and hASCs.
(D) Alignments of the sequences underlying the two non-orthologous sites in (C) shows that the underlying motifs (blue bars) are not conserved.
NIH-PA Author Manuscript
NIH-PA Author Manuscript
Figure 6. TF motifs associated with chromatin remodeling during adipogenesis
TF motifs with the highest relative enrichment in adipocyte- (right) and pre-adipocyte-specific (left) H3K27ac regions. The top 400 L1 adipocyte and pre-adipocyte H3K27ac regions (ranked by enrichment scores) that could be mapped to orthologous locations with H3K27ac in hASCs were used. Each mammalian TRANSFAC (M prefix) and UniPROBE (U prefix) motif was matched and assigned adipocyte/pre-adipocyte enrichment ratios in the underlying mouse and human sequences (corrected for length and composition). The ‘ratio’ columns show the maximal (right) or minimal (left) enrichment ratio from mouse and human for non-redundant motifs with consistent enrichment ratios in the two genomes. The ‘candidates’ columns show genes or gene families expressed in L1 cells that are known to recognize each of the motifs. See also Table S6.
NIH-PA Author Manuscript
NIH-PA Author Manuscript
Figure 7. PLZF and SRF regulate adipogenesis
(A) L1 pre-adipocytes were transduced with retrovirus expressing PLZF or SRF [pMSCV empty vector (EV) as control] and induced to differentiate. The cells were subjected to oil Red O staining at the indicated time points.
(B) mRNA levels relative to 36B were assessed by RT-qPCR (mean±SD; n=4) at the indicated time points. ** P<0.01; *** P<0.001.
(C) Protein levels were assessed by Western blotting at the indicated time points.
(D) L1 pre-adipocytes were transduced with a retrovirus expressing control shRNA (shLuc), PLZF (shPLZF), or SRF (shSRF). The cells were subjected to oil Red O staining at the indicated time points.
NIH-PA Author Manuscript
NIH-PA Author Manuscript
(E) mRNA levels relative to 36B4 were assessed by RT-qPCR (mean±SD; n=4) at the indicated time points. *, P<0.05; **, P<0.01; ***, P<0.001.
(F) Protein levels were assessed by Western blotting at the indicated time points. See also Figure S7.