HAL Id: inserm-02489459
https://www.hal.inserm.fr/inserm-02489459v2
Submitted on 18 Mar 2020
HAL is a multi-disciplinary open access
archive for the deposit and dissemination of
sci-entific research documents, whether they are
pub-lished or not. The documents may come from
teaching and research institutions in France or
abroad, or from public or private research centers.
L’archive ouverte pluridisciplinaire HAL, est
destinée au dépôt et à la diffusion de documents
scientifiques de niveau recherche, publiés ou non,
émanant des établissements d’enseignement et de
recherche français ou étrangers, des laboratoires
publics ou privés.
Impact of 1D and 2D visualisation on EEG-fMRI
neurofeedback training during a motor imagery task.
Claire Cury, Giulia Lioi, Lorraine Perronnet, Anatole Lécuyer, Pierre Maurel,
Christian Barillot
To cite this version:
Claire Cury, Giulia Lioi, Lorraine Perronnet, Anatole Lécuyer, Pierre Maurel, et al.. Impact of 1D
and 2D visualisation on EEG-fMRI neurofeedback training during a motor imagery task.. ISBI 2020
- IEEE International Symposium on Biomedical Imaging, Apr 2020, Iowa City, United States. pp.1-4.
�inserm-02489459v2�
IMPACT OF 1D AND 2D VISUALISATION ON EEG-FMRI NEUROFEEDBACK TRAINING
DURING A MOTOR IMAGERY TASK.
Claire Cury
1,2, Giulia Lioi
1,3, Lorraine Perronnet
1,3, Anatole L´ecuyer
3Pierre Maurel
1, Christian Barillot
11
Univ Rennes, CNRS, Inria, Inserm, IRISA UMR 6074, Empenn team, F-35000 Rennes, France.
2Univ Rennes, CNRS, Inria, IRISA UMR 6074, Panama team, F-35000 Rennes, France.
3Univ Rennes, CNRS, Inria, IRISA UMR 6074, Hybrid Project team, F-35000 Rennes, France.
ABSTRACT
Bi-modal EEG-fMRI neurofeedback (NF) is a new technique of great interest. First, it can improve the quality of NF train-ing by combintrain-ing different real-time information (haemody-namic and electrophysiological) from the participant’s brain activity; Second, it has potential to better understand the link and the synergy between the two modalities (EEG-fMRI). However there are different ways to show to the participant his NF scores during bi-modal NF sessions. To improve data fusion methodologies, we investigate the impact of a 1D or 2D representation when a visual feedback is given during mo-tor imagery task. Results show a better synergy between EEG and fMRI when a 2D display is used. Subjects have better fMRI scores when 1D is used for bi-modal EEG-fMRI NF sessions; on the other hand, they regulate EEG more specifi-cally when the 2D metaphor is used.
Index Terms— EEG, fMRI, bi-modal, data fusion 1. INTRODUCTION
Neurofeedback (NF) is a psycho-physiological technique that consists in feeding back real-time information to a subject about its own brain activity, and help him perform a given task via self-regulation [1]. NF is also a promising tech-nique for clinical purposes, in the context of rehabilitation in stroke patients ([2]) or psychiatric disorders ([3]) for exam-ple. NF approaches are usually based on real-time measures of brain activity using a single imaging technique, with the majority of applications relying on electro-encephalography (EEG). However, it has been shown during the past few years that combining different modalities could give a more effi-cient and specific self-regulation [4]. In particular, integrat-ing EEG and functional MRI (fMRI) might enhance tempo-ral and spatial resolution. Simultaneous EEG-fMRI recording has been used to understand the links between EEG and fMRI in different physiological and pathological conditions and re-ceived recognition as a promising bi-modal measurement of brain activity [5]. It also has been suggested that bi-modal NF is more efficient than EEG only NF training, as shown in [6].
Fig. 1. NF scores representation during NF sessions intro-duced in [7]. The goal is to bring the ball into the dark blue area. Left : 1D representation. Right : 2D representation.
To improve methodologies for multi-modal data integra-tion, to shed light on the coupling model underlying EEG and fMRI signals, and to conduct reproducible and compa-rable NF studies, it is crucial to understand how NF scores should be returned to subjects when visual feedback is used. In data fusion, it is essential to determine if bi-modal infor-mation should be displayed in 1D or 2D, and to know the bias when using one or the other representation. Indeed, the im-pact of the choice of visualisation has not been explored yet for bi-modal NF, therefore it is not clear if a fully or partially integrated visualisation (as introduced in [7]) should be used to improve data fusion and efficiency of NF training.
If a visual feedback is used, NF scores are displayed us-ing a metaphor indicatus-ing to the subject how well the task is performed, to help him improve his performance. When a sin-gle modality is used, a sinsin-gle dimension is needed. However, when performing bi-modal NF, different options are available. For instance, either the subject can visualise two gauges side by side, one for each modality [4], or one gauge representing the sum of the two NF scores (1D representation, Fig 1 left side). The use of two gauges is a simple representation but might need a higher cognitive load due to 2 distinct targets [8]. In a previous study from our group [7] we have proposed an original 2D metaphor that allows to separately regulate EEG and fMRI activity while focusing only on one target (see Fig-ure 1). This 2D visualisation displays NF scores in 2
dimen-sions with one modality per axis (2D representation). In this previous study, fMRI performances have been explored and results suggest that 1D feedback is easier to control than 2D, while the fMRI activation is more specific when 2D is used.
In this paper, we want to go further by analysing EEG performance. We are interested in evaluating the impact of the 1D or 2D representations on EEG patterns and NF scores during EEG-fMRI NF training of a motor imagery task. 2. DATASET DESCRIPTION AND PRE-PROCESSING EEG and fMRI data were simultaneously recorded with a 64-channels MR-compatible EEG solution from Brain Products (Brain Products GmbH, Gilching, Germany) and a 3T Verio Siemens scanner (VB17) with a 12-channel head coil at the Neurinfo platform in Rennes, France. 20 right-handed NF-naive healthy participant were included in the study: 10 sub-jects received a 1D feedback representation (1D group: mean age 33 ± 6 years), and 10 subjects received a 2D representa-tion (2D group : mean age 37 ± 14 years). All subjects were verbally informed about the study and signed a consent form describing the study (for more details see [6]).
The 1D representation is a ball moving on a gauge, the ball position being the sum of the EEG-NF and the fMRI-NF scores (described below). The 2D representation is a ball moving in a 2D space, where the ball position is the coordi-nates (EEG-NF, fMRI-NF) as shown at Figure 1.
Each participant performed a calibration and 3 NF train-ing sessions. Each NF session included 8 blocks of 40 sec-onds : 20 secsec-onds of rest and 20 secsec-onds of task. During the task, subjects were asked to perform kinesthetic motor imagery : i.e. imaging moving their right hand and feel the sensation of movement, in order to control the ball. Data col-lected for this study are a useful tool to develop and test EEG-fMRI data fusion methods and can be found in BIDS format at : https://openneuro.org/datasets/ds002338/ (details [9]).
EEG data were pre-processed for gradient and pulse artifact correction and band-pass filtered in the 8-30 Hz frequency band using Brain Products Analyzer (version 2.1.1.327). For fMRI-NF scores computation, a first-level general linear model analysis was performed on pre-processed scans, and activation maps were corrected using family-wise error correction (p < 0.05). For more details about data acquisition and pre-processing refer to [7, 10].
EEG-NF scores are estimated 4 times t per second on the past 2 seconds time window Itas follow :
Neeg(t) = [bpLap(Jrest) − bpLap(It)]/bpLap(Jrest)
with bpLap(x) the band power of a given time interval x of
Laplacian filtered signal around C3 channel and bpLap(Jrest)
the average band power over time intervals Jrest, the last 4
seconds of the previous resting block. fMRI-NF are estimated 1 time per second i.e. for each volume v as follow :
Nf mri(v) = Broi(v)/Broi(vrest) − Bbg(v)/Bbg(vrest)
with Broi(v) (respectively Bbg(v)) the mean BOLD signal
in the ROI (resp. background) at volume v. vrestrepresents
the last 4 volumes of the previous resting block. Broi(vrest)
(resp. Bbg(vrest)) represents the average of Broi(v), v ∈
vrest. The ROI is the 9 × 9 × 3 voxels box around the peak
of activation in the motor area in the left hemisphere.
3. METHODS 3.1. Neurofeedback scores analysis
As a first analysis, we investigated how well the subjects reg-ulated EEG and fMRI motor activity, when receiving a 1D or 2D representation of their bi-modal NF scores.
We divided each group of subjects (1D and 2D) into 4 sub-groups : We concatenated NF scores - over all blocks of all NF sessions and all subjects within the group. The Neeg
scores during task are noted Teeg1D (respectively Teeg2D); Neeg
scores during rest (scores not shown to the participant) are noted R1D
eeg(respectively R2Deeg); Nf mriscores during task are
noted T1D
f mri(respectively Tf mri2D ); Nf mriscores during rest
(not displayed) are noted R1Df mri(respectively R2Df mri). During NF sessions, subjects were alternatively follow-ing restfollow-ing blocks and motor imagery task blocks. A good NF training is when a subject is able to follow the rest/task changes along time (320 seconds here). To validate the previ-ous analysis, we investigated the correlation, for each session and for each subject, between this rest/task shifts and the cor-responding NF scores time courses, from EEG and fMRI. 3.2. EEG time-frequency analysis
In order to investigate EEG patterns (Event Related Desyn-chronisation, ERD and Event Related SynDesyn-chronisation, ERS) associated to the NF task, EEG power spectrum was firstly es-timated using a multitaper Hanning approach in the 8-30 Hz frequency band. ERDs for each block and NF session were then computed in relation to a baseline segment correspond-ing to the 10 s interval before motor imagery execution (in order to exclude in the baseline computation the ERS occur-ring at the end of the motor imagery task). Average ERD scalp distributions in the alpha (8-12 Hz) low beta (13-20 Hz) and high beta (21-30 Hz) frequency bands were investigated, as well as temporal and frequency patterns.
4. RESULTS AND DISCUSSION
Using a k-means cluster analysis based on ERD and ERS fea-tures, two outliers (one in the 1D and the other in the 2D group) with abnormal or artifactual ERD were identified and excluded from further analysis.
A Jarque-Bera test was run on each of the 8 sub-groups, and none of the sub-groups comes from a normal distribution. Therefore, non-parametric tests are used to assess significant
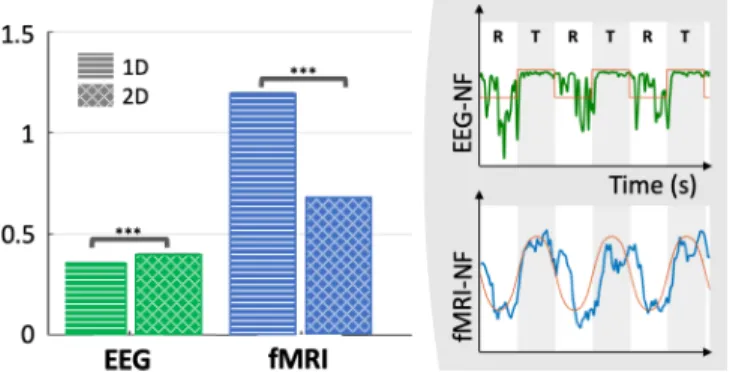
Fig. 2. Left : Median of NF scores during tasks (Td
eegon the
left and Td
f mri on the right, with d ∈ {1D; 2D}), of each
groups. The *** indicates a significance of p < 1e-3 for the corresponding Wilcoxon test. Right : example of task/rest alternations for both NF time courses, with the corresponding ideal shift in red.
differences between subgroups, and especially between T2D eeg
and T1D
eeg(respectively Tf mri2D and Tf mri1D ).
Beforehand, we checked if participants in each group were doing better during task than during rest. Both groups have significant higher NF scores during task than during rest (one-sided Wilcoxon test Rdm < Tmd, p < 1e-100, z > 30,
respectively for d ∈ {1D; 2D} and m ∈ {eeg; f mri}). Participants are responsive to the NF motor imagery task independently from the display used (1D or 2D).
We first tested EEG-NF scores. A one-sided Wilcoxon test shows that T2D
eeg > Teeg1D(p = 6e-20, z = 9.1). This first
result suggests that subjects are able to better regulate EEG activity when the 2D representation is used.
On the contrary, for fMRI-NF scores a one-sided Wilcoxon test between Tf mri2D and Tf mri1D shows that Tf mri1D > T2D
f mri
(p < 1e-100, z = −28.5), results are illustrated at Figure 2 left part. This second result suggests that subjects are more responsive to fMRI-NF when 1D feedback is used. Together with the first result, we can entail that fMRI is easier to con-trol than EEG. Considering that when the 1D representation is used, NF scores rise mainly thanks to the fMRI-NF. When using a 2D representation, subjects are encouraged to equally engage EEG and fMRI, and can visualise their contribution to each modality (Figure 1). T2D
f mri values are smaller than
T1D
f mri: this suggests that in 2D subjects are less sensitive to
the fMRI (than in 1D) and focuses more on EEG, as EEG-NF scores are higher when a 2D representation is used.
To support this hypothesis and compare the quality of the NF sessions, we tested the correlations between the differ-ent NF scores time courses and the interchanges between rest and task. Because of the hemodynamic delay, we smoothed the ”squared shape” function1task(t) of the rest/task
alter-nation, when compared to fMRI-NF scores (Figure 2 right). We computed Spearman rank correlations, for each session and subject in each group (1D, 2D) and for each modality
(EEG,fMRI). In this context, correlations are used as an index to evaluate performances between groups. In both groups, for EEG and fMRI, the distribution of correlations comes from a normal distribution (Jarque-Bera test, p > 0.5) thus we used student tests. The mean correlation of Neeg is higher in the
2D group (rs = 0.26) than in the 1D group (rs = 0.22) but
this difference is not significant.
For the 1D group, Nf mri scores have a significantly
higher correlation with the alternation rest/task that Neeg
(one-sided t-test, p = 1e-4, average correlation for fMRI-NF scores rs = 0.40). However, for the 2D group, Neeg
have a non-significant higher average correlation (rs= 0.26)
compared to Nf mri(rs = 0.24). This consolidates the idea
that when 1D is used, subjects are more sensitive to fMRI measures than to EEG signal, letting think that fMRI-NF is easier to control, also because the quality of EEG is affected by residual MRI induced artifacts. In 2D the sensitivity to fMRI signal drops in favour of the EEG signal, as the average correlation of fMRI-NF scores is significantly lower in 2D than in 1D (one sided t-test, p = 1e-4).
In line with these findings, average time-frequency maps (Figure 3 panel B) show a larger desynchronisation in the al-pha and beta bands for the 2D group than for the 1D group (that, on the other hand, seems to have a higher beta ERS after the motor imagery task, as can been seen in the first seconds of the rest block and in the 20-25 Hz band in red).
Moreover, ERD scalp distributions (as shown at Figure 3 panel A) in the alpha band indicate that when receiving 2D feedback, subjects were more specifically activating the con-tralateral motor area (electrodes C3 and CP3), while topo-graphic maps for the 1D group exhibit a broader activation including ipsilateral and occipital areas (Figure 3). Accord-ing to results in the literature [11] ERD distributions in the beta bands are larger and involve centro-parietal electrodes for both groups. This last result shows that EEG activation is more specific in 2D than in 1D.
5. CONCLUSION
This study shows, in the context of bi-modal neurofeedback training during motor imagery task, a different impact on EEG-NF when used with a 1D or a 2D feedback representa-tion : the quality of EEG-NF improves when 2D display is used, and EEG activity involves more specifically the con-tralateral motor area in 2D than in 1D, especially in the alpha band. fMRI-NF scores seem to be of a better quality when a 1D display is used, which is in line with results of the previous study [7] on fMRI signal, which suggests that 1D feedback is easier to control than 2D. Yet, [7] also indicates that 2D representation gives more specific fMRI activation. Those results are of great interest for data fusion methods and for NF research, since the choice of the representation significantly impacts the response of the subjects to the task, and therefore the modalities synergy. In the context of data
Fig. 3. Average EEG ERD time-frequency patterns during NF sessions in the 2D feedback group (first line) and 1D feedback group (second line). A. ERD scalp distributions in the alpha (8-12 Hz) low beta (13-20 Hz) and high beta (21-30 Hz) frequency bands. B : Time-Frequency maps displaying ERD (red) and ERS (blue) in the contralateral motor electrodes (C3 and CP3) with respect to baseline in the [10-20]s of the resting block.
fusion, using a task as simple as the motor imagery task in bi-modal NF, provides an efficient model to study the syn-ergy between EEG and fMRI signals when the 2D metaphor (Figure 1) is used. This 2D representation of the NF scores might help to better understand relation between EEG and fMRI. In the context of NF, understanding such link between modalities will improve the computation of NF scores de-pending on the task asked, which is a biomedical question of great interest. The gain of synergy while using the 2D representation is therefore needed to develop new NF scores. Furthermore, new bi-modal NF scores presentation learned on healthy subjects could be used in clinic to improve the quality of NF training of patients, responding to the challenge of providing a richer and more specific NF, while keeping the cognitive demand low to be adapted to the clinical context.
6. REFERENCES
[1] Ranganatha Sitaram et al., “Closed-loop brain training: the science of neurofeedback,” Nature Reviews Neuro-science, vol. 18, no. 2, pp. 86–100, Feb. 2017.
[2] Ander Ramos-Murguialday et al., “Brain-machine inter-face in chronic stroke rehabilitation: A controlled study: BMI in Chronic Stroke,” Annals of Neurology, vol. 74, no. 1, pp. 100–108, July 2013.
[3] Vadim Zotev et al., “Correlation between amygdala BOLD activity and frontal EEG asymmetry during real-time fMRI neurofeedback training in patients with de-pression,” NeuroImage: Clinical, vol. 11, pp. 224, 2016.
[4] Vadim Zotev et al., “Self-regulation of human brain ac-tivity using simultaneous real-time fMRI and EEG neu-rofeedback,” NeuroImage, vol. 85, pp. 985, Jan. 2014. [5] Rodolfo Abreu et al., “EEG-Informed fMRI: A Review
of Data Analysis Methods,” Frontiers in Human Neuro-science, vol. 12, Feb. 2018.
[6] Lorraine Perronnet et al., “Unimodal Versus Bimodal EEG-fMRI Neurofeedback of a Motor Imagery Task,” Frontiers in Human Neuroscience, vol. 11, Apr. 2017. [7] Lorraine Perronnet et al., “Learning 2-1: towards
in-tegrated EEG-fMRI-neurofeedback,” bioRxiv, 2018. [8] A. Gaume et al., “A psychoengineering paradigm for the
neurocognitive mechanisms of biofeedback and neuro-feedback,” Neuroscience & Biobehavioral Reviews, vol. 68, pp. 891–910, Sept. 2016.
[9] Giulia Lioi et al., “Simultaneous MRI-EEG during a motor imagery neurofeedback task: an open access brain imaging dataset for multi-modal data integration,” preprint, Neuroscience, Dec. 2019.
[10] Marsel Mano et al., “How to Build a Hybrid Neurofeed-back Platform Combining EEG and fMRI,” Frontiers in Neuroscience, vol. 11, 2017.
[11] S. Rimbert et al., “Modulation of beta power in EEG during discrete and continuous motor imageries,” in 2017 8th International IEEE/EMBS Conference on Neu-ral Engineering (NER), May 2017, pp. 333–336.
![Fig. 1. NF scores representation during NF sessions intro- intro-duced in [7]. The goal is to bring the ball into the dark blue area](https://thumb-eu.123doks.com/thumbv2/123doknet/14385721.507260/2.918.553.756.375.507/fig-scores-representation-sessions-intro-intro-duced-bring.webp)