HAL Id: hal-01849702
https://hal.insa-toulouse.fr/hal-01849702
Submitted on 20 Sep 2018
HAL is a multi-disciplinary open access
archive for the deposit and dissemination of
sci-entific research documents, whether they are
pub-lished or not. The documents may come from
teaching and research institutions in France or
abroad, or from public or private research centers.
L’archive ouverte pluridisciplinaire HAL, est
destinée au dépôt et à la diffusion de documents
scientifiques de niveau recherche, publiés ou non,
émanant des établissements d’enseignement et de
recherche français ou étrangers, des laboratoires
publics ou privés.
Mechanisms of cementitious material deterioration in
biogas digester
Célestine Voegel, Alexandra Bertron, B. Erable
To cite this version:
Célestine Voegel, Alexandra Bertron, B. Erable.
Mechanisms of cementitious material
deterio-ration in biogas digester.
Science of the Total Environment, Elsevier, 2016, 571, pp.892-901.
To cite this version :
Voegel, Celestine and Bertron, Alexandra and Erable,
Benjamin Mechanisms of cementitious material deterioration in biogas
digester. (2016) Science of the Total Environment, 571. 892-901. ISSN
0048-9697
O
pen
A
rchive
T
OULOUSE
A
rchive
O
uverte (
OATAO
)
OATAO is an open access repository that collects the work of Toulouse researchers and
makes it freely available over the web where possible.
This is an author-deposited version published in :
http://oatao.univ-toulouse.fr/
Eprints ID : 20499
To link to this article: DOI :
10.1016/j.scitotenv.2016.07.072
URL
: http://doi.org/10.1016/j.scitotenv.2016.07.072
Any correspondence concerning this service should be sent to the repository
administrator:
staff-oatao@listes-diff.inp-toulouse.fr
Mechanisms of cementitious material deterioration in biogas digester
C. Voegel
a,b,⁎
, A. Bertron
a, B. Erable
baLaboratoire Matériaux et Durabilité des Constructions, Université de Toulouse, INSA, UPS, France bLaboratoire de Génie Chimique, Université de Toulouse, CNRS, INP, UPS, France
H I G H L I G H T S
• Anaerobic digestion is a microbial waste treatment producing energy.
• Microbial activity during digestion causes deterioration of concrete di-gesters.
• The biodeterioration of cement paste in anaerobic digestion bioreactors is eval-uated.
• Cement paste biodeterioration com-bines calcium leaching and carbonation in bioreactors.
• Microorganisms should be considered as aggressive for concrete in European standards.
G R A P H I C A L A B S T R A C T
a b s t r a c t
Digesters produce biogas from organic wastes through anaerobic digestion processes. These digesters, often made of concrete, suffer severe premature deterioration caused mainly by the presence of fermentative microor-ganisms producing metabolites that are aggressive towards cementitious materials.
To clarify the degradation mechanisms in an anaerobic digestion medium, ordinary Portland cement paste spec-imens were immersed in the liquid fraction of a running, lab-scale digester for 4 weeks. The anaerobic digestion medium was a mixture of a biowaste substrate and sludge from municipal wastewater treatment plant used as a source of anaerobic bacteria.
The chemical characteristics of the anaerobic digestion liquid phase were monitored over time using a pH metre, high performance liquid chromatography (HPLC) and ion chromatography (HPIC). An initial critical period of low pH in the bioreactors was observed before the pH stabilized around 8. Acetic, propionic and butyric acids were produced during the digestion with a maximum total organic acid concentration of 50 mmol L−1. The maximum
ammonium content of the liquid phase was 40 mmol L−1, which was about seven times the upper limit of the
highly aggressive chemical environment class (XA3) as defined by the European standard for the specification of concrete design in chemically aggressive environments (EN 206).
The changes in the mineralogical, microstructural and chemical characteristics of the cement pastes exposed to the solid and liquid phase of the digesters were analysed at the end of the immersion period by X-ray diffraction (XRD), scanning electron microscopy (SEM) coupled with energy dispersive X-ray spectrometry (EDS) and elec-tron-probe micro-analysis (EPMA). A 700-μm thick altered layer was identified in the cement paste specimens.
Keywords: Biodeterioration Anaerobic digestion Cementitious materials Organic acids Ammonium Biofilms
The main biodeterioration patterns in the bioreactors' solid/liquid phase were calcium leaching and carbonation of the cement matrix.
1. Introduction
Microbial production of sustainable energy, such as biogas, is possi-ble through the natural biodegradation of organic matter in anaerobic conditions, also called anaerobic digestion (Frank and Smith, 1988). The anaerobic digestion process consists of four consecutive degrada-tion reacdegrada-tions called hydrolysis, acidogenesis, acetogenesis, and methanogenesis. The methanogenesis step is responsible for the pro-duction of biogas, mainly composed of 65% methane (CH4) and 35%
car-bon dioxide (CO2), and of co-products such as digestate, which is used
as agricultural fertilizer (Evans and Furlong, 2003).
Biogas is a cheap and locally available renewable energy resource. Therefore, the industrial development of the anaerobic digestion pro-cess has become worldwide, permitting the valorization of many sources of organic wastes.
In a biogas plant, biogas production is carried out in anaerobic di-gesters for the conversion of large volumes of organic wastes (Fig. 1). The converted biogas is used either directly for heating the digester or for local distribution, e.g. gas and electricity in a nearby city.
The construction material commonly used for the digester structures is concrete. Concrete is economically competitive and shows high per-formance in terms of water- and air-tightness, and thermal inertia.
Structural concrete in digesters is exposed to digesting organic waste, the solid/liquid phase (in the submerged part of the structure), and to the resulting biogas, the gas phase (mainly in the emerged part) (Fig. 1). Many chemical and biological agents in the gas and in the solid/liquid phases of the digester may lead to irreversible damage on cementitious materials, which consequently threaten the durability of the concrete structures. The main consequences of the deteriorations of structural concrete are financial and environmental. On the one hand, the income from biogas production is reduced because of (i) the lowered production yield caused by the biogas leakage and (ii) the structural repairs, which require production to be stopped. On the other hand, the leakage of polluting effluents into the nearby environ-ment becomes possible through sealing defects.
One recent study reports observations of deterioration patterns of concrete that are probably due to the microbial deterioration pro-cesses in a biogas digester fed with silage as the biowaste (Koenig and Dehn, 2016). The authors conclude that concrete deteriorations were caused by biogenic sulfuric acid attack in the gas phase and ero-sion of the concrete skin, slight leaching and carbonation in the solid-liquid fermenting waste. The altered layer of concrete samples in the solid-/liquid phase after one year and a half of exposure was around 1 mm thick, independently of the concrete mixes used for the sam-ples, which were designed according to European standard EN 206 (Koenig and Dehn, 2016).
However, the solid/liquid phase in a biogas digester contains several aggressive agents: (i) a mix of volatile fatty acids (VFA) (Breure and Van
Andel, 1984; Lata et al., 2002, Koenig and Dehn, 2016), and ammonium (Karakashev et al., 2005; Yenigün and Demirel, 2013), which can be re-sponsible for concrete leaching (Bertron et al., 2005; Escadeillas, 2013), and (ii) CO2(Cohen et al., 1979) which can lead to concrete carbonation
(Magniont et al., 2011) (Fig. 2). These chemical compounds are pro-duced in large quantities by cooperating microbial communities in-volved in the anaerobic digestion process (Fernández et al., 2008). They are able to structure their biofilms “intelligently”, i.e. to self-orga-nize into biofilms that optimize the exchange of substances (metabo-lites, ions, etc.) and to create an environment in which local physicochemical conditions are favourable to microbial cooperation. The biofilm organization contributes to a more efficient degradation of organic substrates and to a higher biogas yield (Ahring, 2003; Langer et al., 2014). But biofilm formation on cement paste intensifies the dete-rioration kinetics and phenomena (Magniont et al., 2011) (Fig. 2).
Table 1illustrates the diversity of maximal concentrations of volatile fatty acids during anaerobic digestion of various substrates as reported in the literature. The concentrations of organic acid during anaerobic di-gestion vary considerably according to the substrates fermented (Table 1).
The ammonium concentration in anaerobic digesters can reach 55 mmol L−1(1000 mg L−1) (McCarty, 1964). McCarty highlighted
that the concentrations of ammonium should not exceed 1500 mg L−1
otherwise the anaerobic digestion is inhibited. However, other authors have measured concentrations of a few grams per litre (Karakashev et al., 2005; Yenigün and Demirel, 2013).
Finally, dissolved CO2, mainly in the form of bicarbonate, is present
in the fermented biowaste and is monitored to control operating indus-trial digesters (Cohen et al., 1979; Jenkins et al., 1991). Considering all the studies on concrete aggressive agents in anaerobic digestion, the an-aerobic digestion liquid phase appears to lead to highly variable envi-ronments that are harmful for cementitious materials.
Environments aggressive towards concrete are classified in the Eu-ropean standard EN 206. Chemically aggressive aqueous media are clas-sified in three classes of increasing aggressiveness: XA1, XA2 and XA3, according to the aggressive agents identified in the media and their con-centrations. As far as biowastes are concerned, the standards notably consider the following criteria in the classification of chemically aggres-sive media: the pH, the aggresaggres-sive carbon dioxide concentration (ag-gressive CO2) and the ammonium ion concentration (NH4+).
The present study aimed to (i) identify the chemical composition of the liquid fraction of the waste according to time during the anaerobic digestion process (in terms of pH, and concentrations of volatile fatty acids and ammonium), (ii) evaluate the capability of the microorgan-isms in the biowaste to colonize the cementitious material in the form of a biofilm, and (iii) characterize the mechanisms of biodeterioration of cementitious materials in contact with the solid/liquid phase of an anaerobic digester. Ordinary Portland cement paste samples were im-mersed in biowaste in anaerobic batch conditions for 4 weeks, which is the time required to achieve complete digestion of a biowaste. The concentrations of organic acids and ammonium, and the pH in the liquid phase were monitored over time during the experiment. The concentra-tion of CO2in the liquid phase was measured occasionally. The biofilm
on the specimen surface was observed by Field Emission Gun Scanning Electron Microscope (FEGSEM). The chemical, mineralogical and micro-structural changes of the cement pastes after immersion in the solid/liq-uid phase were explored by Scanning Electron Microscopy (SEM) coupled with Energy Dispersive Spectrometry (EDS), X-ray Diffraction (XRD) and Electron Probe Micro-Analysis (EPMA).
2. Materials and methods 2.1. Cementitious materials
Samples of ordinary cement pastes (CEM I 52.5 R CE CP2 NF; Lafarge, factory of Le Teil, France) were made with a water/cement ratio of 0.40. Cylindrical moulds (height 75 mm, diameter 25 mm) were used to cast the specimens. After the pastes had been removed from their moulds (24 h after pouring), the curing period of the specimens was 28 days in water at 20 °C.
2.2. Preparation of synthetic biowaste
The composition of a synthetic biowaste representative of the pro-portions of organic domestic waste was provided by IRSTEA of Antony (France). The composition is given inTable 2.
The biowaste was homogenized by blending for 10 min at 20 °C. It was then inoculated in order to initiate the anaerobic digestion process (Neves et al., 2004). Here, the inoculum was a sludge sampled from a municipal wastewater treatment plant in Toulouse (France). The organ-ic loads, expressed as chemorgan-ical oxygen demands (COD), were 50 g L−1
for the substrate (biowaste) and 20 g L−1for the inoculum (sludge).
Proper establishment of the anaerobic digestion process depends on the inoculum/substrate (biowaste) quantity ratio (Elbeshbishy et al., 2012). The inoculation was operated with an optimal ratio of 1 g COD(inoculum)/g COD(biowaste) as already reported in a previous work (Voegel et al., 2015). Therefore, biowaste was diluted in inoculum to reach this ratio. The immersion was operated in anaerobic bioreactors (usable volume: 500 mL) at 37 °C (Lettinga, 1995; Khanal, 2008) in a thermostatically controlled incubator during the complete biowaste di-gestion (Fig. 3).
2.3. Immersion of cement pastes in the digesting organic waste
The tests of cement paste specimen immersion were performed in triplicate, conducted in three replicate anaerobic bioreactors containing the inoculated biowaste, for 4 weeks at 37 °C (Fig. 3). Directly after the inoculation of the biowaste, the cement paste specimens were
immersed in the bioreactors. The solid/liquid ratio (cement paste sur-face area/inoculated biowaste volume) used for each bioreactor was ap-proximately 224 cm2L−1(industrial scale digesters provide a lower
ratio, of about 4 cm2L−1). Three reference bioreactors were also run
in digestion without cement paste specimens. The pH in the bioreactors was monitored by a pH data acquisition system (WTW, Multi 3430) throughout digestion (Voegel et al., 2015).
2.4. Analysis of organic acids, ammonium and dissolved carbon dioxide in the liquid phase of the digesting biowaste
The analysis of the liquid phase required regular samplings of 1.5 mL of biowaste in digestion from the bioreactors, using sterile needles and syringes. The nature and concentrations of the organic acids were deter-mined in the liquid phase of the biowaste samples by High Performance Liquid Chromatography analysis (Thermo Fisher U3000; column: Aminex HPX-87H BIORAD; eluant: H2SO4; flow rate: 0.6 mL min
−1)
(Voegel et al., 2015). The concentrations of ammonium in the liquid phase of the fermented biowaste samples were analysed by Ionic Chro-matography (Thermo Electron ICS 3000, column: CS16; pre-column; cartridge holder; eluant: 30 mM methanesulfonic acid, flow rate: 1.0 mL min−1). Moreover, some occasional analyses of total inorganic
carbon were performed with an analyser of total carbon and total inor-ganic carbon (TOC-SHIMADZU Combustion) in order to determine the soluble CO2produced by the microbial activity.
2.5. Observation of microbial biofilms on cementitious materials
The surface of the cement paste specimens was observed with a scanning electron microscope at the end of the 4 weeks of immersion to observe any biofilm that had developed. Cement paste specimens were first sawn carefully to avoid any damage to the surface. The ce-ment pastes were then treated for biofilm fixation and dehydration (Voegel et al., 2015). Firstly, the biofilms were fixed on the samples for 20 min in aldehyde fixator solution made of glutaraldehyde (4%), phosphate buffer (pH 7.4, 0.4 M) and distilled water. Secondly, the spec-imens were cleaned twice for 15 min in a solution made of phosphate buffer (pH 7.4, 0.4 M), sucrose solution (0.4 M) and distilled water. Fig. 2. Scheme of the bio induced deterioration of concrete in the solid/liquid phase of an anaerobic digester.
Table 1
Maximum volatile fatty acid concentrations in mmol L−1(mg L−1) during anaerobic digestion of several substrates (nm: not mentioned) (Breure and Van Andel, 1984; Cohen et al., 1979;
Hill and Holmberg, 1988; Lata et al., 2002; Wang et al., 2009).
Authors (year of publication) Substrate Acetic acid Propionic acid Butyric acid
Cohen et al. (1979) 1% Glucose 17.55 (1054) 95 (1.28) 5673 (64.39)
Breure and Van Andel (1984) Gelatin 4.54 (20,743) 4.83 (358) 1.12 (99)
Hill and Holmberg (1988) Manure 16.49 (990) 26.38 (1954) 5.86 (516)
Lata et al. (2002) Vegetables 66.61 (4000) 20.25 (1500) 39.72 (3500)
Tea 66.61 (4000) 6.75 (500) nm
Wang et al. (2009) Mix ethanol + acetic/propionic/butyric acids 68.69 (4125) 38.55 (2856) 39.22 (3456) 26.64 (1600) 4.05 (300) 20.43 (1800)
Finally, the samples were progressively dehydrated by successive im-mersion in solutions made of acetone and water and then hexamethyldisilazane (HMDS) until total evaporation. The specimens were coated with a thin layer of gold before SEM observations (Field Emission Gun, JEOL 7100F TTLS).
2.6. Analysis of chemical and mineralogical changes in cementitious materials
The cylindrical cement paste specimens were sliced perpendicularly to their longitudinal axis with a thin diamond saw. The slices of cement paste, which were a few millimetres thick, were embedded in an epoxy resin (Mecaprex MA2 by Presi) and dry-polished using silicon carbide polishing disks (Presi) according to the procedure described in
Bertron et al. (2009). After carbon coating of the polished sections, chemical analyses were performed with an Electron Microprobe (Cameca SXFive, 15 kV, 20 nA, scanning area of the beam: 2 × 2 μm2)
on one hundred points on the flat, polished sections, from the surface in contact with the liquid phase of biowaste in digestion to the centre of the specimen. The points analysed were carefully chosen to measure only the hydrated paste and avoid residual anhydrous grains. The fol-lowing elements were analysed: Ca, Si, Al, Fe, S, P and Ti for each point. The counting time was 10 s on peak and 5 s on the background on each side for all elements but titanium. For titanium (minor element used for the correction method) the counting time was 30 s on peak and 10 s on the background on each side (Bertron et al. 2009). Calibration was performed on natural and synthetic standard materials before each series of analyses. Elemental mass percentages were expressed as mass percentages of the associated oxides. For cementitious mate-rials, the sum of oxides is normally around 75% (Bertron et al. 2009). The complement to 100 covers non-analysed elements, such as H, C, and elements in small quantities that were not included in the analysis program. It should be noted that most of the complement to 100 could be attributed to bound water in hydrated calcium silicate hydrates (C-S-H), portlandite (C(C-S-H), ettringite (AFt), etc. In the case of chemical attack, such as leaching, the loss of less stable and more mobile elements (Ca,
Na and K for example) leads to an increase in the proportion of more stable elements (Si, Al, Fe, etc.) since microprobe analysis gives the rel-ative contents of the elements in the probed volume. To obtain the ab-solute evolution of the element concentrations, the microprobe data was processed according to a method detailed byBertron et al. (2009). The TiO2content was used to calculate correction factors since
it has been shown that titanium present in the form of rutile titanium oxide is very stable over the pH interval between 3 and 9.5 (Knauss et al., 2001).
The changes in mineralogical composition in the depth of the speci-mens were characterized by X-Ray Diffraction (Siespeci-mens D5000, Co cathode, 40 kV, 30 nA). The preparation of the specimens is described inBertron et al. (2005). The plane sides of the cylinders were analysed. The plane face of the specimen directly exposed to the biowaste in di-gestion was first analysed. Then it was abraded and submitted to the next analysis. A control specimen was also analysed at the end of the curing period (four weeks).
3. Results
3.1. Production of organic acids, ammonium, dissolved carbon dioxide (car-bonates) and evolution of the pH during the anaerobic digestion of biowastes
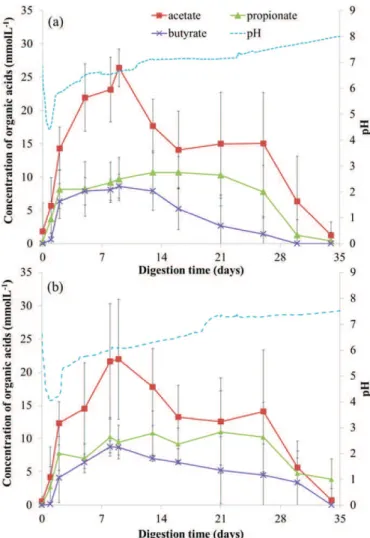
Fig. 4gives the evolution of the pH and the mean values of organic acid concentrations in the liquid fraction contained in the bioreactors with or without the cement paste specimens (Fig. 4). InFig. 4(a), the first days of decreasing pH from 6 to 4 corresponded to a significant Table 2
Composition of the biowaste in percentages by mass of organic substitution fractions from organic domestic waste in (IRSTEA of Antony, France).
Organic substitution fractions Composition by mass (%)
Potatoes 8.1 Tomatoes 3.4 Minced meat 8.1 Milk powder 0.7 Crackers 4.1 Water 75.6
Fig. 3. Schematic representation of the anaerobic bioreactors placed on a magnetic plate for mixing purposes and kept in an oven regulated at 37 °C.
Fig. 4. Evolution of the pH and the concentrations of organic acids during anaerobic digestion of biowaste in presence (a) and in absence (b) of cement paste specimens.
production of acetic, propionic and butyric acids, which are typical vol-atile fatty acids metabolized by microorganisms in anaerobic digestion (Jeris and McCarty, 1965). The total maximum concentration of organic acids reached about 50 mmol L−1
on day 9. After this first acidification stage, the pH slowly rose to 7–8 and reached the pH conditions of methanogenesis. After 9 days of digestion, the concentrations of acids decreased, except for propionate, which started depleting after 15 days. The complete digestion of the substrate was marked by the en-tire consumption of all the volatile fatty acids at the end of the experi-ment. The bioreactors without cement paste samples followed the same evolution as the bioreactors with the samples but with slightly lower organic acid concentrations.
Fig. 5shows the evolution of the ammonium concentration in the fermented biowaste in presence and in absence of cement paste sam-ples in the bioreactors. The ammonium production increased quickly from 1 mmol L−1(10 mg L−1) to nearly 20 mmol L−1(500 mg L−1)
in two weeks with and without the cement paste samples in the biore-actors. After four weeks of digestion, the ammonium content reached nearly 40 mmol L−1(800 mg L−1). According to Eq.(1), ammonium
should be mainly in the form of ammonium ion in the pH conditions (7.0–8.0), which were significantly lower than the pKa of the acid and conjugate base NH4+/NH3,of 9.25.
NH4þþ H2O→NH3þ H3Oþ: pKa¼ 9:25 ð1Þ
The ranges of ammonium concentration of the exposure classes (marked XA1, XA2 and XA3) for chemical attacks on concrete as defined by the European standard (EN 206) are reported inFig. 5. The ranges are 0.83–1.66 mmol L−1
(15–30 mg L−1
) for XA1, 1.66–3.33 mmol L−1
(30–60 mg L−1
) for XA2 and 3.33–5.55 mmol L−1
(60–100 mg L−1)
for XA3.
The concentrations of dissolved CO2were measured through
analy-sis of total inorganic carbon content in the fermenting medium at 3 weeks of experiment. At this time, the pH of the biowaste was 7.7. The mean value of total inorganic carbon in the medium was 146 ± 46 mg L−1(5 samplings). In the pH condition, the major form of
dis-solved CO2was bicarbonate ion HCO3–(95% by mass), according to the
predominance curve of dissolved carbonates (Eqs.(2) and (3)). Calcula-tions gave the mean amount of HCO3–as 2.3 mmol L
−1± 0.2 mg L−1(or
139 ± 16 mg L−1) in the fermented media. The other form present at pH 7.7 was carbonic acid H2CO3(5% by mass) with a mean content of
0.1 ± 0.02 mmol L−1(7 ± 1.7 mg L−1).
H2O þ H2CO3→H3Oþþ HCO3–−pKa1¼ 6:37 ð2Þ
H2O þ HCO3 −
→H3Oþþ O32–−pKa2¼ 10:32 ð3Þ
3.2. Microbial biofilm formation on the surface of the cementitious material The cement paste surfaces after 4 weeks of immersion in the biore-actors are shown inFig. 6. The surface of the cementitious material was entirely covered by biofilm (Fig. 6(a)). The measurements per-formed during the observation session suggested a total biofilm thick-ness of about 100 μm. The biofilm contained microorganisms with spherical (Fig. 6(d)) and elongated shapes, called coccus and rod (bacil-lus) morphologies.
3.3. Deterioration of cement paste immersed in the solid/liquid phase of a biowaste in anaerobic digestion
The chemical composition profiles, analysed by EPMA, of the speci-men as a function of the distance to the surface exposed to the solid/liq-uid phase of the biowaste in digestion, is shown on Fig. 7. The observation of the same specimen by SEM in back-scattered electron (BSE) mode is also presented under the graph. A chemical zonation of the specimen was identified and is represented onFig. 7(zones 1 to 5). The average chemical composition of the cementitious matrix in the different zones is given inTable 3.Fig. 9gives the mineralogical characterization by XRD of the different zones of the cement pastes, as defined onFig. 7, after 4 weeks of exposure to the biowaste.
The chemical and mineralogical zonation from the core to the exter-nal layer of the specimen was as follows:
Zone 1, or the sound zone, had a chemical and a mineralogical com-position identical to that of an unaltered control specimen. The typical peaks of hydrated phases, such as portlandite and ettringite, and of an-hydrous grains, such as tricalcium silicate or alite (3CaO SiO2), dicalcium silicate or belite (2CaO·SiO2) and brownmillerite
(4CaO·Al2O3·Fe2O3), were present (Fig. 9). Furthermore, the density
of anhydrous residual cement grains was high (white grains on the SEM picture) (Fig. 7).
Zone 2 showed a slight decalcification and an enrichment in sulphur (Fig. 7), which may be correlated with the dissolution of portlandite and the intensification of the ettringite peaks compared to zone 1 (Fig. 9). The density of residual anhydrous grains was lower than in zone 1. This zone was 500-μm thick (Fig. 7).
Zone 3 was slightly decalcified (Fig. 7). Calcite was the main crystal-lized phase. Ettringite was dissolved. Alite and belite peaks had disap-peared, which was in accordance with SEM observations showing a very low amount of residual anhydrous grains in this zone (Figs. 7 and 8). This zone was 100 μm thick.
Zone 4 was just a few tens of μm thick and showed phosphorus en-richment (Fig. 8). Phosphorus was most probably brought by the biowaste. SEM observations coupled to EDS analyses showed some pre-cipitates mainly composed of P, Ca and Si at different places in this thin layer (Fig. 8). The proportions of Ca, P and Si of these precipitates (Table 3) were typical of apatite minerals (Elliott et al., 2002), which may be confirmed by the small peaks resembling those of hydroxyapatite ob-served onFig. 9. Finally, the average CaO/SiO2ratio in this zone (about
1.95,Table 3) suggested that the calcium silicate hydrates (C-S-H) had been dissolved.
Zone 5 was the outer layer (50-μm thick) previously covered by the biofilm. This zone was less dense than the other zones (dark zone on the SEM picture ofFig. 7) and mainly amorphous (Fig. 9). This zone was al-most completely decalcified and enriched in aluminium and silica com-pared to the zones closer the specimen core. Also, the phosphorus content in this zone, although lower than in zone 4, remained high. Fig. 5. Evolution of the concentration of ammonium during the anaerobic digestion of
biowaste in presence (continuous line) and in absence (dotted line) of cement paste samples in the bioreactors. Limit values of the exposure classes (15 mg L−1≤XA1 b 30 mg L−1, 30 mg L−1≤XA2 b 60 mg L−1and 60 mg L−1≤XA3) for chemical attacks in aqueous environments in the standards (European standard EN NF 2061 and French documentation file FD P18–011) are reported for comparison.
4. Discussion
Ordinary cement paste specimens were exposed to the solid/liquid phase of a biowaste during a complete anaerobic digestion process. This work aimed to quantify the concentrations of aggressive agents
against concrete in the liquid phase of fermenting biowaste, to identify the capability of the microorganisms in the biowaste to colonize the ce-mentitious material in the form of a biofilm, and to determine the mech-anisms of cementitious material biodeterioration in the solid/liquid phase of an anaerobic digester.
Fig. 6. SEM observations of ordinary cement paste surface colonized with a microbial biofilm after 4 weeks of exposure to biowaste under anaerobic digestion process. ((a) global biofilm surface, (b) view of the cement paste under the biofilm thanks to a little nick made on the biofilm, (c,d) focus on biofilm details.)
Fig. 7. Chemical composition profile of an ordinary Portland cement paste immersed in the solid/liquid phase of a biowaste in anaerobic digestion conditions for 4 weeks according to the distance to the surface in contact with the medium (EPMA), and SEM observations of the polished section in back-scattered electron (BSE) mode.
4.1. Composition of the liquid fraction of the fermenting biowaste and po-tential aggressiveness for cementitious material
The growth of microorganisms in anaerobic digestion requires dif-ferent pH ranges, e.g., a pH range of 4.0–8.5 is needed for the fermenta-tive microorganisms producing organic substrates (e.g., fatty acids and glucose). In particular, a more restricted pH range of 6.5–7.2 stimulates the growth of methanogens (Zhang et al., 2014).
The evolution of organic acids, in terms of nature and concentra-tions, and pH during the whole digestion is represented onFig. 4, the duration of which (4 weeks) matched a whole cycle of anaerobic diges-tion. The pH evolution suggested than anaerobic digestion was properly established. The presence of cement paste specimens in bioreactors did not affect the anaerobic digestion process. pH, organic acid and ammo-nia concentrations changed in a similar way with or without the addi-tion of cement paste (Figs. 4 and 5).
Anaerobic digestion showed an initial pH drop (b2 days) from 6 to 4–5 before a slow pH increase, reaching the pH values corresponding to methanogenesis conditions in 4 weeks (Fig. 4). The maximal total concentration of volatile fatty acids, including acetic, propionic and bu-tyric acids, was about 50 mmol L−1in the biowaste under digestion. In
terms of ammonium content, the total ammonium production had reached nearly 1000 mg L−1after 4 weeks. Besides being present in
the initial biowaste before the digestion, ammonia (NH3) and
ammoni-um (NH4+) accumulated during the breakdown of proteins and were the
foremost inhibitors of the anaerobic digestion process. The range of con-centrations (up to 40 mmol L−1) measured in the fermenting biowaste
was in accordance with the data available in the literature and below critical thresholds (80 mmol L−1) that can cause inhibition of the biogas
production process (McCarty, 1964). CO2was co-produced during the
anaerobic digestion of the biowaste. Occasional analyses made on dis-solved CO2content in the fermenting mix showed an HCO3–
concentra-tion of 2.3 mmol L−1(or 140 mg L−1) (pH of 7.7 at the sampling time). The concentration of CO2in the bioreactor was thus much
lower than the concentrations that may be reached in industrial anaer-obic digestion media, i.e. 2000–3000 mg L−1(McCarty, 1964)
corre-sponding to the saturation level (the solubility of CO2in water at 25 °
C and 1 atm is 34 mmol L−1or 0.77 mg L−1).
Based solely on pH data collected during the anaerobic digestion of biowaste, despite a short initial period with a pH below 7.0, anaerobic digestion media in normal operation should not be classified as aggres-sive environments for cement based materials, considering their stable pH of 7.0–8.0 (N6.5 which is the upper limit of the XA1 exposure class according to NF D 18–011). Nevertheless, when considering the ammo-nium and the CO2concentrations collected during anaerobic digestion
of biowaste, the anaerobic digestion media in normal operation have to be considered as highly aggressive for cement based materials (XA3 exposure class according to EN 206 and NF D 18–011). For example, the concentration of ammonium, from two days after the start of the ex-periment ([NH4+] = 9 mmol L
−1) to the end ([NH 4
+] = 40 mmol L−1),
was significantly higher than the concentration range of class XA3 (3.33–5.55 mmol L−1).
The concentrations of ammonium measured (up to 40 mmol L−1) in
this study were about seven times the upper limit (5.55 mmol L−1) of
the XA3 exposure class and still lower than the anaerobic digestion in-hibition concentration (around 80 mmol L−1) given by McCarty
(1964). It may be noted that the French documentation file FD P18-011 recommends an external or internal protection in cases when the concentration of an aggressive agent exceeds the upper limit of the XA3 classification in the media.
It should additionally be noted that these standards do not consider the nature of the acids, notably the organic acids, their concentration, nor the specific impact of the microorganisms, individually or in the form of a biofilm, in the classification of aggressive media. Yet, several studies have highlighted the significant role of these two parameters in the deterioration of the cementitious matrix in various biological media (Nica et al., 2000; Leemann et al., 2010a; Larreur-Cayol et al., 2011; Magniont et al., 2011; Bertron and Duchesne, 2013; Bertron, 2014).
4.2. Biofilm proliferation at the surface of the cementitious materials The phenomena of biodeterioration are often exacerbated when a surface layer of microorganisms, called biofilm, grows on the surface of the altered material. The aggressive products secreted by microor-ganisms are concentrated in the close vicinity of the material surface and result in accelerated damage (Nuhoglu et al., 2011; Magniont et al., 2011).
After only 4 weeks of exposure in the solid/liquid phase of the fermenting biowaste, a rich biofilm, a hundred microns thick, was al-ready observed by scanning electron microscopy on the cement paste surface of the cementitious material exposed to the fermenting biowaste. It should be mentioned that the optimal pH conditions for mi-croorganisms involved in anaerobic digestion to live are 4.5–6.3 for hy-drolytic bacteria and acidogens, 6.8–7.5 for acetogens and 6.2–7.6 for methanogens (McCarty, 1964; Prescott et al., 1996; Evans and Furlong, 2003). However, cementitious materials have initial pH around 12–13. The surface colonization was probably made possible because of the production of metabolites (organic acids, CO2and ammonium) by the
planktonic microorganisms in the first hours of the digestion process, which caused initial deterioration of the material (calcium leaching and carbonation, as analysed with EPMA, SEM + EDS and XRD) and probably decreased the surface pH to suitable conditions for microbial colonization (Magniont et al., 2011). This surface conditioning is a key step enhancing the bioreceptivity of the cementitious material (Guillite, 1995; Manso et al., 2014).
Table 3
Average chemical composition and standard deviations in mass percentages in the differ-ent zones defined inFig. 7.
Oxides
Average chemical composition by mass (%)
Zone 3 Zone 4 Zone 5
% CaO 39.22 ± 4.78 29.97 ± 6.75 5.09 ± 1.75 % Al2O3 3.92 ± 0.84 3.75 ± 0.62 5.02 ± 0.68 % SiO2 24.01 ± 8.24 15.37 ± 2.12 17.70 ± 4.82 % P2O5 1.57 ± 1.87 11.47 ± 2.15 5.66 ± 2.28 % SO3 1.24 ± 0.98 1.55 ± 0.52 1.22 ± 0.57 % Tot 74.22 ± 5.48 64.84 ± 6.31 37.02 ± 4.74
Fig. 8. SEM observation in BSE mode and chemical mapping of calcium (Ca) and phosphorus (P) EDS in the outer zones (zones 3 to 5 as defined inFig. 6) of an ordinary cement paste immersed in solid/liquid phase of biowaste in anaerobic digestion conditions for 4 weeks.
SEM observations showed a complex mixture of microorganisms with rods and cocci morphologies in the biofilm on cementitious mate-rials. Zellner et al. observed the same morphologies in biofilm in anaer-obic digester reactors (Zellner et al., 1996).
The presence of a biofilm suggests greater local microbial activity on the surface of cementitious material than in the medium (i.e. heteroge-neous catalytic phenomenon). For that reason, the consequences on the distribution and the concentration of soluble chemical species have to be considered. Thus, concentrations of metabolites obtained in the biowaste during anaerobic digestion are certainly lower than those ac-tually produced locally on the surface of cement pastes.
4.3. Chemical alteration mechanisms on cementitious materials exposed to the solid/liquid phase of fermenting biowaste in the anaerobic digester
A chemical and mineralogical zonation of cementitious specimens exposed to the solid/liquid phase of biowaste in digestion was highlighted. Five zones with different chemical and mineralogical com-positions were identified, with zone 1 corresponding to the non-altered core of the specimen and zone 5 being the outer layer in contact with the biowaste. After four weeks of immersion, the total thickness of the altered layers (zones 2 to 5) was 700 μm. Organic acids, CO2and
ammo-nium are the agents aggressive to concrete that were identified in this work. The metabolites reacting with the calcium-bearing components of the cement matrix were responsible for calcium leaching and carbon-ation phenomena in the cement matrix. It should be noted that the pres-ence of microorganisms on the surface may have led to specific conditions of concentrations of aggressive agents and of pH (namely high acid, CO2and ammonium concentrations and low pH) locally
(Magniont et al., 2011). Phosphorus enrichment of the cement matrix was also detected.
4.3.1. Calcium leaching phenomena
Calcium leaching of the cementitious matrix was observed, probably due to the attack of organic acids (Koenig and Dehn, 2016) and ammo-nium in the biowaste.
A cement matrix in a medium containing organic acids undergoes acid-base reactions occurring between the acids and the highly alkaline cement phases. In the case of ordinary cement paste, these reactions lead to the formation of calcium salts or complexes and water (Bertron and Duchesne, 2013; De Windt et al., 2015). The volatile fatty acids in anaerobic digestion (acetic, propionic and butyric acids) have very soluble calcium salts (Bertron et al., 2007; Bertron and Duchesne, 2013). The attack by these specific acids induces calcium leaching
from the matrix and formation of a Si-Al-skeleton gel with high porosity and low mechanical properties (Bertron et al., 2007), the main hydrates of the cement matrix (Ca(OH)2, C-S-H and C4AHx) being dissolved.
Ammonium salts are highly aggressive for the cementitious matrix because of an exchange reaction between NH4+in the medium and
Ca2+in the cement paste (Escadeillas, 2013).
In this work, the chemical and mineralogical compositions of zone 2 (transition zone where portlandite was dissolved and non-expansive ettringite precipitated) and of zone 5 (an amorphous zone mainly com-posed of Si and containing Al and P) were typical of a leaching process resulting from the exposure of cementitious materials to VFA (Bertron et al., 2007) and ammonium (Escadeillas, 2013).
4.3.2. Phosphorus enrichment in the cement matrix
The chemical analyses by EDS and EPMA revealed enrichment in phosphorus in zone 4. This enrichment in the Ca-P component was due the presence of phosphorus in the substrate used in our experi-ment. It would not necessarily occur in the various environments that may be encountered in other anaerobic digestion media. Hydroxyapa-tite may have precipitated following the reaction between calcium re-leased by the cement matrix and phosphorus diffused from the medium. This precipitation could not be confirmed by XRD, which may be explained by the formation of an amorphous calcium phosphate precursor (Christoffersen et al., 1989). Amorphous calcium phosphate is one of the most frequent forms of calcium phosphate minerals in biolog-ical organisms (Eanes, 1998) and is the precursor of hydroxyapatite, which is a major part of bone structure (Rey et al., 2009).
It should be noted thatMeyer and Eanes (1978)reported that this amorphous form was stable in pH between 7 and 9 (Meyer and Eanes, 1978). This pH condition might be encountered in zones 4 and 5, zone 4 being the place with the highest concentration of P (Figs. 7 and 8) as the pH decreases from the core of the matrix (pH 12–13) to the outer layer in contact with the biofilm (pH 7 or lower). There was no ettringite left in zone 3, which means that the pH was lower than 10.6 (Duchesne and Bertron, 2013), and calcite precipitated in zones 3 and 4, indicating preferential pH conditions between 8.5 and 9.5 (Tai et al., 2006; Ruiz-Agudo et al., 2011). Finally, it is not known whether this precipita-tion has a protective effect on the cement matrix through the creaprecipita-tion of a diffusion barrier.
4.3.3. Carbonation of the cement matrix
CO2is one of the main metabolites of methanogens as it constitutes
35% of the final biogas produced in an anaerobic digestion process. In aqueous environments, the presence of dissolved carbon dioxide may Fig. 9. Mineralogical analyses by XRD of ordinary cement paste immersed in the solid/liquid phase of biowaste in anaerobic digestion conditions for 4 weeks.
lead to both carbonation and dissolution of the cement matrix. The total CO2in the medium includes free and bound CO2. The free CO2contains
aggressive and stabilizing CO2(Escadeillas and Hornain, 2008). The
sta-bilizing CO2is the quantity required to maintain the bicarbonates in
so-lution with the following reactionEq. (4).
H2O þ CO2þ CaCO3→Ca HCOð 3Þ2 ð4Þ
The aggressive carbon dioxide is the excess free CO2beyond the
sta-bilizing CO2. The degradation with aggressive CO2leads to subsequent
dissolution and precipitation mechanisms. The water in contact with the cement material becomes progressively saturated in bicarbonates. Calcium carbonate, with its very low solubility, can precipitate through the reaction between bicarbonate in solution and calcium-bearing hy-drates such as portlandite and C-S-H as shown inEqs. (5) and (6). Ca HCOð 3Þ2þ Ca OHð Þ2→2CaCO3þ 2H2O ð5Þ
xCaO % ySiO2% nH2O þ 2xCa HC3ð Þ2→2xCaCO3þ ySi OHð Þ4
þ x þ n−2yð ÞH2O ð6Þ
This phenomenon decreases the porosity of the cementitious mate-rial (Escadeillas and Hornain, 2008). The calcium carbonate precipitated reacts with carbon dioxide and forms calcium bicarbonate, according to Eq.(7).
CaCO3þ CO2þ H2O→Ca HCOð 3Þ2 ð7Þ
Calcium bicarbonate is more soluble than calcium carbonate and will consequently be dissolved in water (Yin et al., 2015). So, the leaching of lime, the formation of bicarbonates, and the precipitation of carbonates is repeated until the lime runs out (Escadeillas and Hornain, 2008).
In this study, an average concentration of 2.3 mmol L−1 (or
140 mg L−1) of dissolved CO
2(in the form of HCO3–at the pH of 7.7 in
the fermented medium) was measured in the medium. However, as suggested byMagniont et al. (2011), more aggressive conditions, in-cluding higher CO2concentrations and lower pH, may be encountered
at the interface between the biofilm and the specimen surface than in the surrounding medium. Leemann et al. highlighted that, in low pH conditions, as in an acidic environment, calcite would not precipitate even in presence of carbonates because of the insufficient buffering ca-pacity of the CaO content in the cement material towards the acidic en-vironment (Leemann et al., 2010b). Actually, calcite was not identified on the surface of the specimen in this experiment.
Calcite was detected deeper in the specimen, i.e. in zones 3 and 4. Other authors have also concluded that carbonation can be induced by bacteria producing CO2in an environment enriched with
microorgan-isms (Lajili et al., 2008; Magniont et al., 2011). Calcite precipitation in the cementitious material has also been reported as a providing possible protection against agents that are aggressive to concrete, by filling the porosity of the material (Leemann et al., 2010b).
5. Conclusion
Biodeterioration of cementitious material exposed to the solid/liquid fraction of fermenting biowaste was investigated by immersing ordi-nary cement pastes in bioreactors in laboratory conditions. The liquid phase of the digesters was analysed over time to measure the evolution of pH, and the concentrations of volatile fatty acids and ammonium. CO2
concentration was also measured.
A maximum total concentration of 50 mmol L−1of volatile fatty
acids (acetic, propionic and butyric acids) was produced during the pro-cess. Despite a short period of biowaste acidification at the beginning of the experiment, the pH in the bioreactors stabilized in the 7–8 range. Large amounts of ammonium ion, up to 8 times the upper limit of the
class of highly aggressive environments for concrete (XA3) in European standard EN 206, were formed during the anaerobic digestion.
The biodeterioration of the cementitious material in the solid/liquid phase of anaerobic digestion bioreactors was identified as a combina-tion of calcium leaching and carbonacombina-tion. The cement paste surface was covered by a biofilm several tens of μm thick after 4 weeks of expo-sure to digesting biowaste. The deterioration mechanisms highlighted through this study suggest that specific chemical conditions may have developed under the biofilm and that these conditions may have been more aggressive for the cementitious material than what was obtained from the analysis of the bulk environment.
It should be noted that the European (EN 206) standards for the de-sign of concrete subjected to aggressive environments consider neither the presence of volatile fatty acids and their concentrations nor the presence of microorganisms (in the environment or in the form of a bio-film on the material) as potential aggressive agents, which appears to be a shortcoming of these standards.
Further research will focus on understanding the specific impact of attached microorganisms in deterioration. Microorganisms capable of colonizing the surface of cement pastes will also be identified using DNA-based microbial population analyses.
Acknowledgements
The authors gratefully thank the PRES Université de Toulouse and the Midi-Pyrénées region for their financial support and IRSTEA of Antony for the biowaste production protocol.
References
Ahring, B.K., 2003.Perspectives for anaerobic digestion. Biomethanation I. Springer, Berlin Heidelberg, pp. 1–30.
Bertron, A., 2014.Understanding the interactions between cementitious materials, micro-organisms and organic matter: a key to durable and sustainable concrete structures in various contexts. Mater. Struct. 47 (11), 1787–1806.
Bertron, A., Duchesne, J., 2013.Attack of cementitious materials by organic acids in agri-cultural and agrofood effluents. Performance of Cement-Based Materials in Aggres-sive Aqueous Environments. Springer, Netherlands, pp. 131–173.
Bertron, A., Coutand, M., Cameleyre, X., Escadeillas, G., Duchesne, J., 2005.Attaques chimique et biologique des effluents agricoles et agroalimentaires sur les matériaux cimentaires. Mater. Tech. 93, s-111.
Bertron, A., Duchesne, J., Escadeillas, G., 2007.Degradation of cement pastes by organic acids. Mater. Struct. 40 (3), 341–354.
Bertron, A., Escadeillas, G., De Parseval, P., Duchesne, J., 2009.Processing of electron mi-croprobe data from the analysis of altered cementitious materials. Cem. Concr. Res. 39 (10), 929–935.
Breure, A.M., Van Andel, J.G., 1984.Hydrolysis and acidogenic fermentation of a protein, gelatin, in an anaerobic continuous culture. Appl. Microbiol. Biotechnol. 20 (1), 40–45.
Christoffersen, J., Christoffersen, M.R., Kibalczyc, W., Andersen, F.A., 1989.A contribution to the understanding of the formation of calcium phosphates. J. Cryst. Growth 94 (3), 767–777.
Cohen, A., Zoetemeyer, R.J., Van Deursen, A., Van Andel, J.G., 1979.Anaerobic digestion of glucose with separated acid production and methane formation. Water Res. 13 (7), 571–580.
De Windt, L., Bertron, A., Larreur-Cayol, S., Escadeillas, G., 2015.Interactions between hy-drated cement paste and organic acids: thermodynamic data and speciation model-ing. Cem. Concr. Res. 69, 25–36.
Duchesne, J., Bertron, A., 2013.Leaching of cementitious materials by pure water and strong acids (HCl and HNO3). Performance of Cement-Based Materials in Aggressive
Aqueous Environments. Springer, Netherlands, pp. 91–112.
Eanes, E.D., 1998.Amorphous calcium phosphate: thermodynamic and kinetic consider-ations. Calcium Phosphates in Biological and Industrial Systems. Springer, US, pp. 21–39.
Elbeshbishy, E., Nakhla, G., Hafez, H., 2012.Biochemical methane potential (BMP) of food waste and primary sludge: influence of inoculum pre-incubation and inoculum source. Bioresour. Technol. 110, 18–25.
Elliott, J.C., Wilson, R., Dowker, S., 2002.Apatite structures. Adv. X-ray Anal. 45, 172–181.
Escadeillas, G., 2013.Ammonium nitrate attack on cementitious materials. Performance of Cement-Based Materials in Aggressive Aqueous Environments. Springer, Nether-lands, pp. 113–130.
Escadeillas, G., Hornain, H., 2008.La durabilité des bétons vis-à-vis des environnements chimiquement agressifs. La durabilité des bétons. Presses de l'école nationale des Ponts et chaussées, pp. 613–705.
Evans, G.M., Furlong, J.C., 2003.Environmental Biotechnology: Theory and Application. IK International Pvt Ltd.
Fernández, N., Díaz, E.E., Amils, R., Sanz, J.L., 2008.Analysis of microbial community during biofilm development in an anaerobic wastewater treatment reactor. Microbial Ecolo-gy 56 (1), 121–132.
Frank, J.R., Smith, W.H. (Eds.), 1988.Methane from Biomass: A Systems Approach. Elsevier Applied Science.
Guillite, O., 1995.Bioreceptivity: a new concept for building ecology studies. Sci. Total En-viron. 167 (1), 215–220.
Hill, D.T., Holmberg, R.D., 1988.Long chain volatile fatty acid relationships in anaerobic di-gestion of swine waste. Biological Wastes 23 (3), 195–214.
Jenkins, S.R., Morgan, J.M., Zhang, X., 1991.Measuring the usable carbonate alkalinity of operating anaerobic digesters. Research Journal of the Water Pollution Control Feder-ation 28–34.
Jeris, J.S., McCarty, P.L., 1965.The biochemistry of methane fermentation using tracers. J. Water Pollut. Control Fed. 37 (2), 178–192.
Karakashev, D., Batstone, D.J., Angelidaki, I., 2005.Influence of environmental conditions on methanogenic compositions in anaerobic biogas reactors. Appl. Environ. Microbiol. 71 (1), 331–338.
Khanal, S.K., 2008.Environmental factors. Anaerobic Biotechnology for Bioenergy Produc-tion. Wiley-Blackwell, pp. 43–63.
Knauss, K.G., Dibley, M.J., Bourcier, W.L., Shaw, H.F., 2001.Ti (IV) hydrolysis constants de-rived from rutile solubility measurements made from 100 to 300 °C. Appl. Geochem. 16 (9), 1115–1128.
Koenig, A., Dehn, F., 2016.Biogenic acid attack on concretes in biogas plants. Biosyst. Eng. 147, 226–237.
Lajili, H., Devillers, P., Grambin-Lapeyre, C., Bournazel, J.P., 2008.Alteration of a cement matrix subjected to biolixiviation test. Mater. Struct. 41 (10), 1633–1645.
Langer, S., Schropp, D., Bengelsdorf, F.R., Othman, M., Kazda, M., 2014.Dynamics of biofilm formation during anaerobic digestion of organic waste. Anaerobe 29, 44–51.
Larreur-Cayol, S., Bertron, A., Escadeillas, G., 2011.Alteration of cement-based materials by various organic acids in agro-industrial waste-waters. Cem. Concr. Res. 41 (8), 882–892.
Lata, K., Rajeshwari, K.V., Pant, D.C., Kishore, V.V.N., 2002.Volatile fatty acid production during anaerobic mesophilic digestion of tea and vegetable market wastes. World J. Microbiol. Biotechnol. 18 (6), 589–592.
Leemann, A., Lothenbach, B., Hoffmann, C., 2010b.Biologically induced concrete deterio-ration in a wastewater treatment plant assessed by combining microstructural anal-ysis with thermodynamic modeling. Cem. Concr. Res. 40 (8), 1157–1164.
Leemann, A., Lothenbach, B., Siegrist, H., Hoffmann, C., 2010a.Influence of water hardness on concrete surface deterioration caused by nitrifying biofilms in wastewater treat-ment plants. Int. Biodeterior. Biodegrad. 64 (6), 489–498.
Lettinga, G., 1995.Anaerobic digestion and wastewater treatment systems. Antonie Van Leeuwenhoek 67 (1), 3–28.
Magniont, C., Coutand, M., Bertron, A., Cameleyre, X., Lafforgue, C., Beaufort, S., Escadeillas, G., 2011.A new test method to assess the bacterial deterioration of cementitious ma-terials. Cem. Concr. Res. 41 (4), 429–438.
Manso, S., De Muynck, W., Segura, I., Aguado, A., Steppe, K., Boon, N., De Belie, N., 2014.
Bioreceptivity evaluation of cementitious materials designed to stimulate biological growth. Sci. Total Environ. 481, 232–241.
McCarty, P.L., 1964.Anaerobic waste treatment fundamentals. Public Works 95 (9), 107–112.
Meyer, J.L., Eanes, E.D., 1978.A thermodynamic analysis of the amorphous to crystalline calcium phosphate transformation. Calcif. Tissue Res. 25 (1), 59–68.
Neves, L., Oliveira, R., Alves, M.M., 2004.Influence of inoculum activity on the bio-methanization of a kitchen waste under different waste/inoculum ratios. Process Biochem. 39 (12), 2019–2024.
Nica, D., Davis, J.L., Kirby, L., Zuo, G., Roberts, D.J., 2000.Isolation and characterization of microorganisms involved in the biodeterioration of concrete in sewers. Int. Biodeterior. Biodegrad. 46 (1), 61–68.
Nuhoglu, Y., Oguz, E., Uslu, H., Ozbek, A., Ipekoglu, B., Ocak, I., Hasenekoglu, I., 2011.The accelerating effects of the microorganisms on biodeterioration of stone monuments under air pollution and continental-cold climatic conditions in Erzurum, Turkey. Sci. Total Environ. 364 (1), 272–283.
Prescott, L.M., Harley, J.P., Klein, D.A., 1996.Microbiology. third ed. (Wm. C).
Rey, C., Combes, C., Drouet, C., Glimcher, M.J., 2009.Bone mineral: update on chemical composition and structure. Osteoporos. Int. 20 (6), 1013–1021.
Ruiz-Agudo, E., Putnis, C.V., Rodriguez-Navarro, C., Putnis, A., 2011.Effect of pH on calcite growth at constant ratio and supersaturation. Geochim. Cosmochim. Acta 75 (1), 284–296.
Tai, C.Y., Chang, M.C., Wu, C.K., Lin, Y.C., 2006.Interpretation of calcite growth data using the two-step crystal growth model. Chem. Eng. Sci. 61 (16), 5346–5354.
Voegel, C., Bertron, A., Erable, B., 2015.Biodeterioration of cementitious materials in bio-gas digester. Mater. Tech. 103 (2), 202.
Wang, Y., Zhang, Y., Wang, J., Meng, L., 2009.Effects of volatile fatty acid concentrations on methane yield and methanogenic bacteria. Biomass Bioenergy 33 (5), 848–853.
Yenigün, O., Demirel, B., 2013.Ammonia inhibition in anaerobic digestion: a review. Pro-cess Biochem. 48 (5), 901–911.
Yin, S.H., Yang, Y.F., Zhang, T.S., Guo, G.F., Yu, F., 2015.Effect of carbonic acid water on the degradation of Portland cement paste: corrosion process and kinetics. Constr. Build. Mater. 91, 39–46.
Zellner, G., Macario, A.J.L., de Macario, E.C., 1996.Microbial subpopulations in the biofilm attached to the substratum and in the free flocs of a fixed-bed anaerobic bioreactor. Appl. Microbiol. Biotechnol. 46 (4), 443–449.
Zhang, C., Su, H., Baeyens, J., Tan, T., 2014.Reviewing the anaerobic digestion of food waste for biogas production. Renew. Sust. Energ. Rev. 38, 383–392.