HAL Id: hal-02153733
https://hal.inria.fr/hal-02153733
Submitted on 12 Jun 2019
HAL is a multi-disciplinary open access
archive for the deposit and dissemination of
sci-entific research documents, whether they are
pub-lished or not. The documents may come from
teaching and research institutions in France or
abroad, or from public or private research centers.
L’archive ouverte pluridisciplinaire HAL, est
destinée au dépôt et à la diffusion de documents
scientifiques de niveau recherche, publiés ou non,
émanant des établissements d’enseignement et de
recherche français ou étrangers, des laboratoires
publics ou privés.
Fibrillation Patterns Creep and Jump in a Detailed
Three-Dimensional Model of the Human Atria
Mark Potse, Alain Vinet, Ali Gharaviri, Simone Pezzuto
To cite this version:
Mark Potse, Alain Vinet, Ali Gharaviri, Simone Pezzuto. Fibrillation Patterns Creep and Jump in a
Detailed Three-Dimensional Model of the Human Atria. FIMH 2019 - 10th International Conference
Functionnal Imaging and Modeling of the Heart, Yves Coudière; Valéry Ozenne; Edward Vigmond;
Nejib Zemzemi, Jun 2019, Bordeaux, France. pp.131-138, �10.1007/978-3-030-21949-9_15�.
�hal-02153733�
Detailed Three-Dimensional Model of the
Human Atria
Mark Potse1,2,3, Alain Vinet4,
Ali Gharaviri5, and Simone Pezzuto5
1 Univ. Bordeaux, IMB, UMR 5251, Talence, France 2
CARMEN Research Team, Inria Bordeaux Sud-Ouest, Talence, France
3 IHU Liryc, fondation Bordeaux Universit´e, Pessac, France
mark@potse.nl
4 Institut de g´enie biom´edical, Universit´e de Montr´eal, Montreal, Canada
alain.vinet@umontreal.ca
5
Center for Computational Medicine in Cardiology, Institute for Computational Science,
Universit`a della Svizzera italiana, Lugano, Switzerland ali.gharaviri@usi.ch, simone.pezzuto@usi.ch
abstract Activation mapping in animal models of atrial fibrillation (AF) has shown that activation patterns can repeat for several cycles and then be followed by different changing or repetitive patterns. Subsequent clinical studies have suggested a similar type of activity in human AF. Our purpose was to investigate whether a computer model of human AF can reproduce this behavior.
We used a three-dimensional model of the human atria consisting of 0.2-mm volumetric elements with a detailed representation of bundle structures and fiber orientations. Propagating activation was simulated over 9 seconds with a monodomain reaction-diffusion model using human atrial membrane dynam-ics. AF was induced by rapid pacing. Pattern recurrence was quantified using a similarity measure based on transmembrane voltage at 1000 uniformly dis-tributed points in the model.
Recurrence plots demonstrated a continuous evolution of patterns, but the speed of evolution varied considerably. Groups of upto 15 similar cycles could be recognized, separated by rapid changes. In a few cases truly periodic pat-terns developed, which were related to macroscopic anatomical reentry. The drivers of non-periodic patterns could not be clearly identified. For example, a spiral wave could appear or disappear without an obvious impact on the similarity between cycles.
We conclude that our model can indeed reproduce strong variations in similar-ity between subsequent cycles, but true periodicsimilar-ity only in case of anatomical reentry.
keywords Atrial fibrillation, Reentry, Recurrence plot, computer model Published in: Y. Coudi`ere et al. (Eds): Functional Imaging and Modeling of the Heart. Lecture Notes in Computer Science vol. 11504, pp. 131–138, Springer, 2019. doi:10.1007/978-3-030-21949-9 15
right inferior pulmonary vein
right superior pulmonary vein superior vena cava
left superior pulmonary vein
left atrial appendage
pectinate muscles crista terminalis
inferior vena cava right atrium
left atrium
Fig. 1. Anatomy of the atrial model. The epicardium is rendered semi-transpararently to show the variations in wall thickness.
1
Introduction
Optical mapping of atrial fibrillation (AF) in sheep atria has shown that acti-vation patterns can repeat for several cycles and then suddenly give way to a sequence of dissimilar cycles or another repetitive pattern [12]. Clinical studies have suggested a similar type of activity in human AF [8]. In the sheep atria these repetitive patterns were related to temporarily stable rotor activity. In human AF such a link is harder to establish, because AF patterns in patients can only be observed with coarse resolution by noninvasive mapping [8] or in a small portion of the atria by invasive mapping [1].
A computer model can help to gain more insight in this pseudo-stable be-havior of AF, in its determinants, and in possible methods to recognize it with limited data, such as an ordinary electrocardiogram. The purpose of this study was therefore to investigate whether a computer model can reproduce the AF dynamics observed in animal studies, and if such behavior can be linked to me-andering spiral waves.
2
Methods
A three-dimensional model of the human atria was previously constructed [5, 10]. The model included the crista terminalis, pectinate muscles, Bachmann’s bundle, posterior interatrial bundles, bundle structures in the left atrial appendage, and up to three layers of fiber orientation (figure 1).
Propagating activation was simulated with a monodomain reaction-diffusion model using human atrial membrane dynamics [2], with minor adaptation to avoid numerical instabilities due to discontinuous coefficients, on a hexahedral mesh with 0.2-mm spacing. The model was integrated with the Rush-Larsen method for gating variables and an explicit Euler method for the other variables, using a fixed time step of 0.01 ms.
To simulate electrically remodeled atria we modified the maximum conduc-tivities of the calcium current, gCaL, from 0.1238 to 0.037, gTO from 0.1652 to
0.026, gK1 from 0.09 to 0.180, and gKsfrom 0.129 to 0.1 nS/pF. [4].
Simulations were performed in a “fibrotic” model and in a “normal” model. In the fibrotic model 50 % of the model elements had zero transverse conductivity, to mimic the uncoupling of lateral connections in ageing myocardium [13]. The affected elements were chosen randomly, with a uniform probability density.
With each model 10 simulations, each with 9 seconds duration, were per-formed. AF was induced by rapid pacing, from a different location in each sim-ulation. Pattern recurrence and similarity between simulations were quantified at 1-ms intervals using a state variable consisting of transmembrane voltage sampled from 1000 distributed points in the model. The points were chosen ran-domly, regardless of whether they were endocardial, epicardial, or intramural. For each pair of time samples i, j, a similarity measure Sij was computed as
Sij = (Φi· Ψj)/(|Φi| · |Ψj|) (1)
where Φi is the state at time i in one simulation and Ψj the state at time j in
another; Φ ≡ Ψ for self-similarity or “recurrence.” This similarity was visualized using recurrence plots [3, 9], which show Sij as a function of i and j.
Phase singularity filaments were identified using a phase measure computed with a time embedding of the transmembrane potential [6] with a delay of 10 ms. On each face of the computational mesh, the topological charge was computed as the line integral of the phase over the corners. If the integral was ±2π a singularity filament was assumed to cross the face. Crossings that occurred on different faces of the same element were assumed to be part of the same filament. Simulations were performed with the Propag-5 software [7] on 96 compute nodes each containing two 14-core Intel Xeon E5 processors. A full 9-second simulation took 55 minutes.
3
Results
3.1 Normal model
In the normal model, 3 out of 10 simulations yielded AF until the end of the simu-lation (9 seconds). In the other 7 activity stopped between 536 and 1398 ms after the last pacing pulse (approximately 4 to 9 cycles), either before any reentrant pattern had established or after all wavefronts encountered refractory tissue.
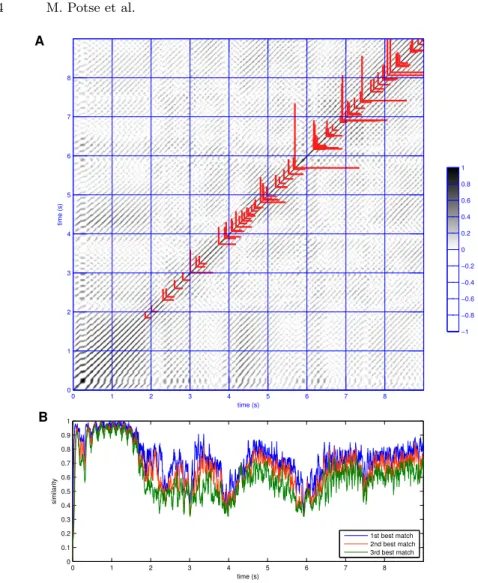
In the 3 simulations that yielded 9 seconds of AF, periods of higher and lower similarity between subsequent cycles could be discerned. An example is shown in figure 2. Panel A shows Sij together with all phase singularity filaments that
lasted more than 150 ms. The first such filaments appear shortly before the end of the pacing interval. Subsequently, several intervals with simultaneous filaments are seen, separated (around 3.6 s) by a short interval without any long-living filaments. Panel B shows, for each time instant in the simulation, the similarity of the three best-matching time instants in the simulation separated by at least
A −1 −0.8 −0.6 −0.4 −0.2 0 0.2 0.4 0.6 0.8 1 time (s) time (s) 0 1 2 3 4 5 6 7 8 0 1 2 3 4 5 6 7 8 B 00.51 0.2 0.4 0.6 0.8 0 1 2 3 4 5 6 7 8 0 0.1 0.2 0.3 0.4 0.5 0.6 0.7 0.8 0.9 1 time (s) similarity 1st best match 2nd best match 3rd best match
Fig. 2. A: Recurrence plot, showing Sijfor a simulation in the normal model. Darker
shades of gray represent higher similarity between the potential patterns at each pair of time instants. A dark diagonal line outside the main diagonal indicates a repeat-ing activation pattern. Here, after 2 seconds of rapid pacrepeat-ing, periods of higher and lower similarity follow. Red lines indicate the intervals during which long-living phase singularity filaments were present. B: Graph showing the similarity of the three best-matching time instants for each time instant in the simulation.
50 ms; i.e. Sij1 > Sij2 > Sij3 > . . . where |jn− i| > 50 and |jn− jm| > 50 for
any jn, jm. Maximum similarity is seen to oscillate roughly between 0.4 and 0.8.
There is no obvious relation with periods of rotor activity.
In all 10 simulations with the normal model combined, 7940 separate sin-gularity filaments were detected. 2324 of these (29 %) were detected for only a single time instant, 138 filaments lived longer than 150 ms (approximately one
cycle length), and 68 lived longer than 300 ms. The longest-living filament lasted for 5601 ms.
3.2 Fibrotic model
In the fibrotic model, 5 out of 10 simulations yielded AF until the end of the simulation. In the other 5, activity stopped between 655 and 1268 ms after the last pacing pulse.
As in the normal model, recurrence plots demonstrated a continuous evo-lution of patterns, with a varying speed of evoevo-lution. A “creeping” progression during groups of upto 15 similar cycles could be recognized, separated by rapid “jumps.” An example is shown in figure 3.
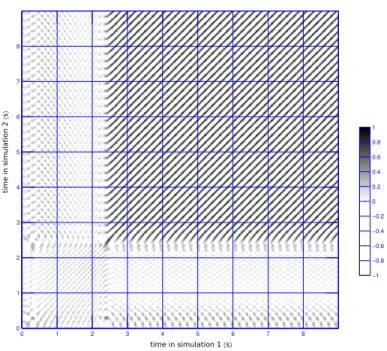
In the fibrotic model, three of the 5 simulations that showed activity until the end of the simulation arrived at the same periodic regime, which corresponded to an anatomical reentry that passed from the coronary sinus to the left atrium and returned through the interatrial septum. A comparison of two of these sim-ulations is shown in figure 4.
In all 10 simulations with the fibrotic model combined, 20873 separate fil-aments were found. 7898 of these (38 %) were detected for only a single time instant, 31 filaments lived longer than 150 ms, and 11 lived longer than 300 ms. The longest-living filament lasted for 2901 ms.
4
Discussion
This study shows that a computer model can reproduce variations in similarity between subsequent cycles of AF. The results also highlight that it is difficult to define when a pattern is “periodic,” as it was called by Skanes et al. [12], cause the similarity between subsequent cycles was never perfect, and ranged be-tween 0.4 and 0.98 in our results. Since published studies have not quantitatively defined when patterns were considered periodic or nonperiodic, a quantitative comparison to their results was not attempted here.
In addition to the similarity of patterns between different time instants we also studied the occurrence of phase singularity or “vortex” filaments. Here we found surprising results. The total number of detected filaments was 2.5 times larger in the fibrotic model than in the normal model, while the total time spent in AF was only 1.6 times larger. In striking contrast, the number of filaments that lived longer than 150 ms was 5 times smaller in the fibrotic model, despite the longer time in AF. Clearly the presence of fibrosis in this model promotes the generation of phase singularities but also reduces their lifetime. Thus, if one were to use the number of phase singularities to demonstrate that fibrosis changes the complexity of AF, the result would greatly depend on the definition of a separate phase singularity.
A clear relation between nearly-periodic patterns and the existence of long-lived phase singularities could not be established. This may be partly explained by methodological restrictions. For example, when a boundary between excitable
A −1 −0.8 −0.6 −0.4 −0.2 0 0.2 0.4 0.6 0.8 1 time (s) time (s) 0 1 2 3 4 5 6 7 8 0 1 2 3 4 5 6 7 8 B 00.51 0.2 0.4 0.6 0.8 0 1 2 3 4 5 6 7 8 0 0.1 0.2 0.3 0.4 0.5 0.6 0.7 0.8 0.9 1 time (s) similarity 1st best match 2nd best match 3rd best match
Fig. 3. A: Recurrence plot, showing Sij for a simulation in the fibrotic model. The
format is as in figure 2. After 2 seconds of rapid pacing, the development of 3 groups of similar cycles can be recognized. Long-living phase singularities (red lines) are present but do not coincide with the groups of similar cycles. B: Similarity of the three best-matching time instants for each time instant in the simulation.
and refractory tissue crosses an anatomical obstacle such as a pulmonary vein, a vortex filament traveling along this boundary may enter the obstacle and reappear on the other side. In such cases, our methods will see this as two different filaments. It is in general very difficult to determine the type of reentry that takes place in this complex anatomy. Similarly, the precise mechanism of termination of a reentry could not always be understood.
Our results concerning vortex filaments likely depend on the methods chosen to detect the intersections of filaments with mesh elements [14] and the
deci-time in simulation 1 (s) time in simu lat ion 2 ( s)
Fig. 4. Similarity plot for two simulations in the fibrotic model, which ended up in the same periodic regime. The format is the same as in figure 3. The simulations were stimulated at different locations, leading to different patterns during the first 2.3 s. Subsequently the two simulations produced exactly the same patterns, albeit with a phase delay (none of the lines of maximum intensity coincides exactly with the main diagonal).
sions whether different intersections belong to the same filament and whether filaments in subsequent time steps are related. A comparison of these methods, however, is outside the scope of this study. The type of fibrosis and the method to model it [11] will also affect the results. We chose to model a diffuse type of fibrosis in which there are no gaps in the myocardium on the scale of a model ele-ment: all our elements represented myocardium. Fibrotic elements only had zero transverse conductivity, which was to mimic fine-grained fibrosis that interrupts side-to-side coupling between myofibers [13].
In summary, we have shown that pseudo-periodic AF patterns can be simu-lated and that this stability can be quantified. A similar quantification of mea-sured results is needed to establish whether the model truly agrees with reality.
Acknowledgments
We thank Sarah Peris for the implementation of the singularity detection al-gorithm. This work was supported by the French National Research Agency, grant reference ANR-10-IAHU04-LIRYC. This work was granted access to HPC resources of CINES under GENCI allocation 2019-A0050307379.
References
1. Allessie, M.A., de Groot, N., Houben, R.P.M., Schotten, U., Boersma, E., Smeets, J.L., Crijns, H.J.: Electropathological substrate of long-standing persistent atrial fibrillation in patients with structural heart disease: Longitudinal dissociation. Circ. Arrhythm. Electrophysiol. 3, 606–615 (2010)
2. Courtemanche, M., Ramirez, R., Nattel, S.: Ionic mechanisms underlying human atrial action potential properties: insights from a mathematical model. Am. J. Physiol. Heart Circ. Physiol. 275, H301–H321 (1998)
3. Eckmann, J.P., Oliffson Kamphorst, S., Ruelle, D.: Recurrence plots of dynamical systems. Europhys. Lett. 4, 973–977 (1987)
4. Gharaviri, A., Verheule, S., Eckstein, J., Potse, M., Kuklik, P., Kuijpers, N.H.L., Schotten, U.: How disruption of endo-epicardial electrical connections enhances endo-epicardial conduction during atrial fibrillation. Europace 19, 308–316 (2017) 5. Gharaviri, A., Zink, M., Pezzuto, S., Potse, M., Zeemering, S., Krause, R., Auric-chio, A., Schotten, U.: Acute changes in P-wave morphology by pulmonary vein isolation in atrial fibrillation patients. In: Computing in Cardiology. Maastricht, The Netherlands (2018)
6. Gray, R.A., Pertsov, A.M., Jalife, J.: Spatial and temporal organization during cardiac fibrillation. Nature 392, 75–78 (1998)
7. Krause, D., Potse, M., Dickopf, T., Krause, R., Auricchio, A., Prinzen, F.W.: Hy-brid parallelization of a large-scale heart model. In: Keller, R., Kramer, D., Weiss, J.P. (eds.) Facing the Multicore-Challenge II. Lecture Notes in Computer Science, vol. 7174, pp. 120–132. Springer, Berlin (2012)
8. Lim, H.S., Hocini, M., Dubois, R., Denis, A., Derval, N., Zellerhoff, S., Yamashita, S., Berte, B., Mahida, S., Komatsu, Y., Daly, M., Jesel, L., Pomier, C., Meillet, V., Amraoui, S., Shah, A.J., Cochet, H., Sacher, F., Ja¨ıs, P., Ha¨ıssaguerre, M.: Complexity and distribution of drivers in relation to duration of persistent atrial fibrillation. J. Am. Coll. Cardiol. 69, 1257–1269 (2017)
9. Marwan, N., Kurths, J., Foerster, S.: Analysing spatially extended high-dimensional dynamics by recurrence plots. Phys. Lett. A 379, 894–900 (2015) 10. Potse, M., Lankveld, T.A.R., Zeemering, S., Dagnelie, P.C., Stehouwer, C.D.A.,
Henry, R.M., Linnenbank, A.C., Kuijpers, N.H.L., Schotten, U.: P-wave complexity in normal subjects and computer models. J. Electrocardiol. 49, 545–553 (2016) 11. Roney, C.H., Bayer, J.D., Zahid, S., Meo, M., Boyle, P.M.J., Trayanova, N.A.,
Ha¨ıssaguerre, M., Dubois, R., Cochet, H., Vigmond, E.J.: Modelling methodology of atrial fibrosis affects rotor dynamics and electrograms. Europace 18, iv146–155 (2016)
12. Skanes, A.C., Mandapati, R., Berenfeld, O., Davidenko, J., Jalife, J.: Spatiotem-poral periodicity during atrial fibrillation in the isolated sheep heart. Circulation 98, 1236–1248 (1998)
13. Spach, M.S., Dolber, P.C.: Relating extracellular potentials and their derivatives to anisotropic propagation at a microscopic level in human cardiac muscle; evidence for electrical uncoupling of side-to-side fiber connections with increasing age. Circ. Res. 58, 356–371 (1986)
14. Zhou, R., Kneller, J., Leon, L.J., Nattel, S.: Development of a computer algorithm for the detection of phase singularities and initial application to analyze simulations of atrial fibrillation. Chaos 12, 764–778 (2002)