Publisher’s version / Version de l'éditeur:
Canadian Geotechnical Journal, 5, 1, pp. 28-45, 1968-04-01
READ THESE TERMS AND CONDITIONS CAREFULLY BEFORE USING THIS WEBSITE. https://nrc-publications.canada.ca/eng/copyright
Vous avez des questions? Nous pouvons vous aider. Pour communiquer directement avec un auteur, consultez la
première page de la revue dans laquelle son article a été publié afin de trouver ses coordonnées. Si vous n’arrivez pas à les repérer, communiquez avec nous à [email protected].
Questions? Contact the NRC Publications Archive team at
[email protected]. If you wish to email the authors directly, please see the first page of the publication for their contact information.
NRC Publications Archive
Archives des publications du CNRC
This publication could be one of several versions: author’s original, accepted manuscript or the publisher’s version. / La version de cette publication peut être l’une des suivantes : la version prépublication de l’auteur, la version acceptée du manuscrit ou la version de l’éditeur.
Access and use of this website and the material on it are subject to the Terms and Conditions set forth at
Settlement observations at Kars Bridge
Eden, W. J.; Poorooshasb, H. B.
https://publications-cnrc.canada.ca/fra/droits
L’accès à ce site Web et l’utilisation de son contenu sont assujettis aux conditions présentées dans le site
LISEZ CES CONDITIONS ATTENTIVEMENT AVANT D’UTILISER CE SITE WEB.
NRC Publications Record / Notice d'Archives des publications de CNRC:
https://nrc-publications.canada.ca/eng/view/object/?id=e5aa2004-7d97-40f6-a012-45287eadc011 https://publications-cnrc.canada.ca/fra/voir/objet/?id=e5aa2004-7d97-40f6-a012-45287eadc011S E T T L E M E N T O B S E R V A T I O N S A T K A R S B R I D G E
W. J. E D E N Division of Building Research, National Research Council of Canacla FI, B. P 0 0 R 0 0 S H A S B Visiting Scientist, Soil Mechanics Section, Division of
Building Research, National Research Cozcncil of Canada
A 26 ft. high approach fill was con- Un reinblai d'approche de 26 pieds de hauteur structed in Novenlber 1959 for a bridge fut construit en novembre 1959 pour un pont over the Rideau river near Kars, Ontario. sur la rivikre Rideau prks de Kars en Ontario. The fill was placed over 50 ft. of Leda Ce renlblai fut &rig& sur une couche d'argile clay, the lower 30 ft. of which was Leda profonde de 50 pieds dont les 30 pieds de estrelnely sensitive and conlpressible. base Ctaient extrkineinent sensibles et conlpres- Prior testing indicated that the precon- sibles. Des essais avaient dCmontr6 que les solidation pressure of the clay would be pressions de prCconsolidation seraient dCpassCes.
exceeded. Depuis le dCbut des travaus et jusqu'h ce
Settlement gauges and piezoineters jour des lectures ont CtC faites tant sur cles under the fill have been observed since jauges de tasseinent que sur des piCzolnktres the start of construction. After 7X years, places sous le remblai. Ces lectures rCvklent 20 in. of settleinent has occurred under qu'il s'est produit au cours des 7:1 dernikres the centre of the fill. Settleinents are con- annbes, 20 pouces de tasseillent au centre du tinuing at an appreciable rate altl~ough reinblai et que ces tasseinents s'effectuent tou- the excess pore water pressure has dis- jours un rythme apprBciable en dCpit du fait sipatecl to a low level and is nearly que les pressions interstitielles aient pr6sente- constant through the clay layer. ment atteint un niveau moindre et soient cle
The field observations of settleinent presque Cgale intensit6 i travers la couche and pore water pressure are compared d'argile.
with values calculated and a closed form On compare les observations in situ des solution to the process of consolidation tassements et de la pression interstitielle avec obtained by a heat balance integral tech- les valeurs calculCes en utilisant une solution nique and by considering the clay layer esplicite du probl8nle de consolidation obtenue to be a rigid plastic. par la technique de l'intCgrale de 1'Cquilibre
calorifique et en considkrant que la couche d'argile se comporte colnlne un n1atCriau rigide plastique.
The Kars bridge is situated about 25 miles south of Ottawa. The bridge was erected over the Rideau river in 1961 by Carleton county, to replace a low- level swing bridge. To meet the Department of Transport's clearance require- ments over the Rideau canal, a fixed span required a 26 ft. approach fill on the west side of the river where low-lying swampland is underlain by soft Leda
EDEN AND POOROOSHASB: SETTLEMENT AT WRS BRIDGE 29
clay. The 26 ft. fill was heavy enough to cause concern about the stability of the proposed embankment and could be expected to cause settlements of the order of 2 ft. With the co-operation of the County Engineer for Carleton, the Division of Building Research of the National Research Council of Canada undertook a testing and instrumentation program on the fill. The results of this program are presented herein.
THE SITE
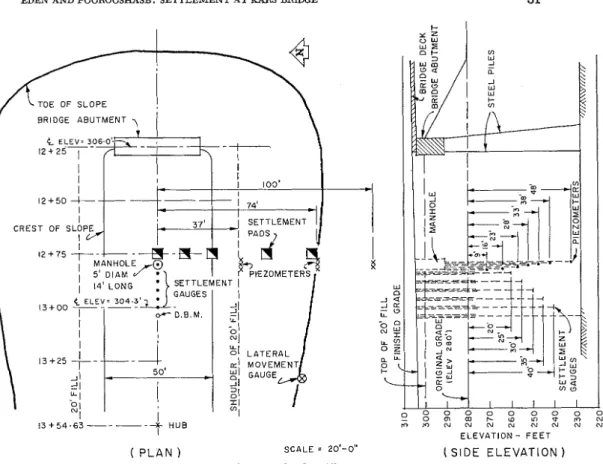
On the west side, the soil profile consists of a 3 ft. surface layer of peat, 5 ft. of sandy clay alluvium, 12 ft. of over-consolidated fissured clay, 30 ft. of extremely sensitive soft Leda clay and, finally, 3 to 5 ft. of glacial till over the shale bed- rock. Figure 1 is a log on which are plotted results of the soil tests from one boring. Because of stability considerations, the fill was built in two stages. The first lift of 20 ft, was placed in November 1959. The pile-founded west abut- ment was constructed during the following spring and the final 6 ft. of fill were placed in June 1961. The anticipated increase in vertical stress due first t o the 20 ft. fill and later to the 26 ft. fill is indicated on Figure 1 by lines C-C ancl D-D respectively. It was estimated that the 20 ft, fill would exceecl the preconsolidation pressure and cause appreciable consolidation in the clay layer.
I?zst~.ui~zentntion
In a previous paper (Eden 1960), a detailed description of the instrumentation at the Kars bridge was given. Figure 2 is a plan and side elevation of the area showing the location of the instrumentation. I t includes a row of settlement gauges along the centreline of the fill at depths of 20, 25, 30, 35, and 40 ft. with a deep bench mark founded on bedrock at 55 ft. The depths were chosen in order to divide the compressible clay zone into increments of about 5 ft. To measure settlements across the fill, five 3 ft, x 4 ft. x ?i in. steel plates were placed on the first lift of the fill and carefully levelled. These were later located by drilling through the fill; then vertical cased rods were set on them. The steel plates were located on the centreline, 12% ft. south of centreline, 25 ft. sot~th of centreline (shoulder of fill), 49 ft. south of centreline (mid slope), and 74 ft. south ( a t the toe).
Fifteen Geonor piezometers were installed to monitor changes in pore water ~ r e s s u r e during and after loading. Seven of the piezometers were located on centreline at depths of 9, 16, 23, 28, 33, 38, and 48 ft. below original grade. Three piezometers at depths of 15, 20, and 35 ft. were located on the shoulder line of the first stage of fill. Three more, at depths of 15, 20, and 30 ft., were located at the toe of the fill, and two piezometers at depths of 20 and 25 ft. were located beyond the toe, 100 ft. south of centreline. To ensure that a minimum of voluine change would influence the piezometer readings, those on centreline were terminated in a manhole formed of a 5 ft. diameter corrugated steel culvert section rising 11 ft. above original grade. These piezometers were connected to Bourdon gauges during the loading phase and for two months after the load application when they remained under a positive head. Water
P~~~~~~~ P~~~~~~~~ P~~~~~~~ A - A INITIAL EFFECTIVE STRESSES IN THE FIELD b - b MINIMUM PRECONSOLIDATION LOAD
- 0 PROBABLE PRECONSOLIDATION LOAD
C - C STRESSES BENEATH & OF 2 0 ' F l L L
D
-
D STRESSES BENEATH & OF 2 6 ' F l L L V - V UNDISTURBED FIELD VANE SHEAR STRENGTHS+ UNDISTURBED SHEAR STRENGTHS MEASURED WITH FIELD VANE
o UNDISTURBED SHEAR STRENGTHS MEASURED IN LABORATORY
REMOULDED SHEAR STRENGTH BY FIELD
WATER CONTENT FROM VARIOUS SOIL TESTS
EDEN AND POOROOSHASB: SETTLEMENT A T KARS BRIDGE j TOE OF SLOPE BRIDGE ABUTMENT 7 t E L E V : 306 0 ' b
'
1 2 + 2 5 1 - A I I I I I I * 1 100' t 1 2 + 5 0 4- I I ! 74' I SETTLEMENT CREST OF SLOPE I ~ ~ o g L D ~O l O N~ o o o o ~ ~ N N N N N N N N E L E V A T I O N - F E E T ( P L A N ) SCALE = 20'-0" ( S I D E E L E V A T I O N )FIGURE 2. Layout of instrumentation for Kars bridge fill
levels were determined with an electrical probe in the open small volume stand pipes.
To check the response of piezometers, three piezometers at 30 and 35 ft. were checked in June 1963. The piezometers were filled with water to the top of the tube, and the time required for the piezometers to revert to their original level was recorded. In each case, after three days the piezometric level had returned to within 10 per cent of its former level. I n a week, the former level had been reached.
At the toe of the fill, a 2% in. diameter flexible plastic pipe was installed vertically through the clay layer. The purpose of this pipe was to detect lateral movements. Readings were taken by lowering a lighted plumb bob down the tube. The position of the plumb bob at predetermined depths was measured from the top of the pipe which was, in turn, measured from a fixed point 100 ft. from the fill. With this system, it was believed that movements of more than ?i in. could be detected.
OBSERVATIONS Settlements
Construction on the site began on 1 November 1959. The first step was to remove the organic silt with a dragline and fill up to grade level with a sand
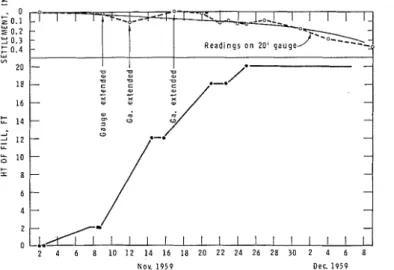
fill. The excavation and back611 were completed by 7 November 1959, at which stage very little load had been added. From 9 to 24 November, the first 20 ft. of the fill were built up by the contractor on a 5% day per week schedule. While the filling operation proceeded, extensions were added to the centreline settle- ment gauges. It was estimated that a
?Q in. error could occur at each joint. The
settlement records indicate in Figure 3 that little immediate settlement occurredFIGURE 3. Rate of load application (first stage) and initial settlements
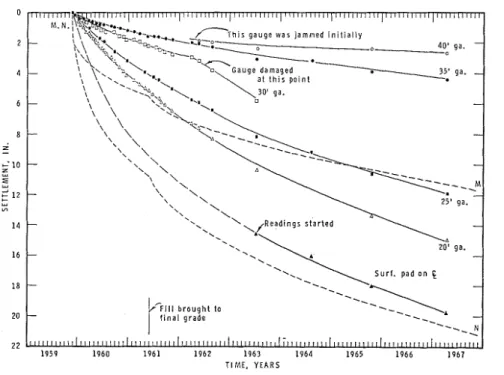
during the loading operations. Since three extensions were necessary for the settlement gauge, the maximum possible immediate settlement was about 0.3 in. Figure 4 shows the settlement records over a 7% year period. By April 1967 a total settlement of 19.7 in. was recorded under the centreline. Figure 5
indicates the transverse distribution of the settlement.
Pore water pressures
When loading began, the piezometers showed an immediate response to the change in stresses. Those along the centreline were equipped with bourdon gauges on 16 November. Maximum pore water pressure was measured on the centreline piezometer located 28 ft. below grade on 23 November, the final day of load application. Pressure then dropped off rapidly to a relatively constant value and has dissipated slowly since then. Figure 6 shows equipoten- tial contours of the maximum excess pore water pressure measured on 23 November 1959. The contours for 2 February 1960 are also shown (in dashed lines), at which time the excess pore water pressure levelled off. Figure 7 shows the variation of pore water pressures with time for three of the centre- line piezometers. The rising of the Rideau river to flood stage in April 1960 was reflected. In June 1960, the driving of the piles for the west abutment about 50 ft. away caused a temporary rise in piezometric levels. Finally, in June 1961 fill was added, bringing the road to final grade. Since June 1961 the
EDEN AND POOROOSHASB: S E m E h l E N T AT KARS BRIDGE 33
T I M E . Y E A R S
FIGURE 4. O b s e r v e d s e t t l e m e n t s
loading has been constant and the pore water pressures have slowly dissipated to an excess head of about 5 ft.
Lateral movements
Surveys in the 2% in. plastic pipe were continued from November 1959 until July 1963. During this time, it was possible to observe the plumb bob to
depths of 45 ft., indicating that lateral movements were small. Because of
--
F 10 20 30 4 0 50 60 70 80 D I S T A N C E F R O M E , FT
34 CANADIAN GEOTECHNICAL JOURNAL
< I O * ~
I
P I E Z O M E T E R-
e lo 20 30 40 so 60 70 so 90 l o o
D I S T A N C E F R O M E , F T
FIGVRE 6. Equipotential contours of excess pore water pressure a t end of loading and two
months later
difEculties in maintaining a stable reference pin, the absolute accuracy of the measurements is somewhat doubtful. The total movement, in any case, does not appear to have exceeded one-half inch. It may be concluded that lateral movements were relatively insignificant compared with the vertical movements.
TESTING AmSETTLEMENT PREDICXTONS
Several field vane borings were made on the site. The results of these tests are shown on Figure 1. Continuous samples were taken with an NGI piston sampler from two other borings. On these samples a comprehensive program of consolidation testing was undertaken, the object being to determine the preconsolidation pressure of the clay and to obtain coefficients of consolidation in order to predict settlement.
Two types of consolidation test were employed. Sixty-seven standard incre- mental loading consolidation tests were conducted on samples from the two borings. The results of the preconsolidation determinations are shown on
Figure 1. The minimum and prcbable assumed preconsolidation pressures for
the most compressible layer, from 23 to 37 ft., are shown by lines b-b and
B-B. For settlement calculations, the probable values (B-B) were used. A second series of consolidation tests was conducted for settlement calcula-
tions by the method suggested by Skempton and Bjerrum (1957). In these
tests the specimen was first loaded to the initial effective overburden pressure.
The next loading increment increased the effective pressure to the calculated
effective pressure under the 20 ft. fill and the final increment to the pressure
under the 26 ft. fill. These tests yielded coefficients of compressibility and
consolidation over the working load range.
For purposes of the settlement predictions, it was assumed that the fissured
crust extended to a depth of 23 ft. and that settlements in the crust would be
EDEN AND POOROOSHASB: S E T T L E M E N T A T KARS BRIDGE 305 300 + L Z 0 295 + Q 2
-
U -=
290 0 N-
- a 2 8 5 280 1959 1960 1961 1962 1963 1964 1965 1966 1967 TIME. Y E A R SF I G ~ E 7. Changes in levels of three piezometers with time (datum 280.0 ft.)
fill exceeded the preconsolidation load. I t was further assumed there was a drainage sink at 18 ft. in the fissured crust of the clay. The second layer, from 23 to 37 ft., is rather uniform, highly sensitive, and quite compressible clay. In the third layer, from 37 to 46 ft., the clay is more stratified and somewhat less compressible. Since the permeability of the lower layer, determined from consolidation tests, is more than twice that of the middle layer, the bottom drainage sink for the middle layer was assumed to be at 37 ft. The lower layer was assumed to drain towards the bottom, at a depth of 46 ft. Two estimates of settlement were made, based on the two types of test. Method A, using the standard type of test, gave four phases of settlement:
( 1 ) immediate or elastic settlement based on modulus of compression deter- mined from undrained triaxial tests;
( 2 ) recompression settlements caused by increase of stress from the existing effective overburden pressure to the preconsolidation pressure;
( 3 ) settlements due to the normal consolidation process along the virgin branch of the pressure void ratio curve from precoilsolidation pressure to pressure due to load of a 20 ft. fill; and
( 4 ) settlements due to increase of load from 20 to 26 ft. fill.
The rate of settlement determined by this method is shown on Figure 4 as line M-A4. The method suggested by Skempton and Bjerruin is shown on Figure 4 as line
N-N.
This method yielded about the same total amount of settlement (35 in.) as the first method (37 in.), but the time required for 100 per cent consolidation was much less-27 years as compared with 80 years. The rate of settlement depends upon values of c, and a, measured in labora- tory tests known to have a limited accuracy. The influence of the fissured crustin distributing the load laterally and the location of drainage sinks in the field are additional uncertain factors.
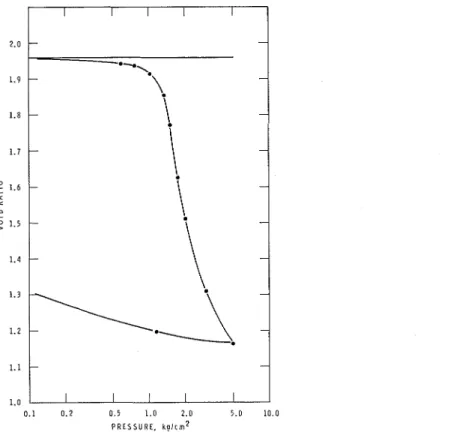
For the middle clay zone the pressure-void ratio curves have the charac- teristic shape of extremely sensitive clays. Figure 8 illustrates a typical curve for test No. 87-28-12 from a depth of 26 ft. This specimen was loaded in small increments, a procedure recommended by Hamilton and Crawford (1959). Figure 9 shows the time-compression curves for the various load increments during the test. It will be seen that in the region of the preconsolidation pressure, the time-compression curves do not have a well-defined primary and secondary stage but that the rate of compression appears to be mainly iduenced by a structural breakdown mechanism. As the void ratio decreases, the structural breakdown process is no longer as significant, and better defined primary and secondary stages can be recognized. Using conventional pro- cedures for interpreting the time-compression curves, Table I lists the coeffi- cients of compressibility (a, ), consolidation ( c, ) , and permeability ( k )
determined from the test.
The coefficients vary widely and do not follow any logical pattern with
decreasing void ratio and, for a purely hydrodynamic process of consolidation, may be misleading (Raymond 1966 )
.
Crawford ( 1964) has indicated that "structural breakdown" is an important feature in the compression of Leda1.0 I I I I I
0.1 0.2 0.5 1.0 2.0 5.0 10.0 PRESSURE, k g i c r n 2
E D E N AND POOROOSHASB: SETTLE-NT AT ICARS BRIDGE 0.1 0 0.01 0.32 0.09 0.OA O.Os 0.06 0.07 Z
-
0.08 Z 0 - &- 0.09z
L : 0.10 0.11 0.12 0.13 0.14 0.15 0.16 0.17 0.18 0.19 0.20 0.21 0.22 FIGURE TIME, h l l N 1.0 10 100 1000 I i I.-.-._._.-
. _ . .
'0.58 kqlcrn2 P - . - . - .-
.-.-._._._.
_.__.--
.-._._
L . ,.-.-._
0.75 - -.-.-
.-._.
_._.
001..---. -,.
..
.-
--
-
'--'-.-.-.-.-.
' ' ~ ~ 1 . 3 2 --\.
- -:
.
-.
"\
1.50-
- .,.-*-*---\.
--
\.
- -\.
- 7.-.-,-.-.
\
.1.75 - --.---.\.\.
- - - -a-.'\
.2.00I
\' I. - 1. - - - -'.\.
\.
- -\.
\.
- 1-2 .,.---a-a'-1
-3.00 - - - A.\.
- - -"\
\' - -1. -'--boo
- I I I i9. Time deformation curves, sample 87-28-12
clay, particularly near the preconsolidation pressure. If the laboratory test is
regarded as a model of field behaviour, then the coefficients of compression and consolidation should be determined from the working stress range. Because of the shape of the time-compression curves in this region, with compression continuing over a long period of time little coddence can be placed in the laboratory values of coefficients, and agreement between the field rate and the
TABLE I
Coefficients derived from test No. 87-28-12
Pressure kg/cm2 0.75 1.00 1.32 1.50
predicted rate, if achieved, may be fortuitous. The fact that method B seems to give better agreement may be because the load increments used duplicate the field situation more closely than the conventional test. With this type of test, the problem of interpretation of the laboratory time-compression curve remains. The average values determined will depend on the number of tests, and the manner in which the individual time-compression curves are inter- preted.
The presence of the fissured crust of clay tends to distribute the load laterally. The compressibility of the fissured crust is unknown, but for pui-poses of the calculations it was assumed to be relatively incompressible and settle- ment gauges were not installed within the crust. The difference in settlement between the surface pad and the 20 ft, gauge is a measure of the compression in this zone, and it is seen to be more compressible than originally assumed. It was also assumed that the fissured crust would provide an upper drainage sink but the field pore water pressure measurements indicate that the drainage sink was somewllere above 16 ft.
All piezometers in the compressible clay zone behaved in a similar manner- a rapid response to the loading followed by a rapid dissipation to about 15 ft. excess head, followed by a relatively slow rate of dissipation. Eventually, no significant difference in head was evident between the piezometers in the middle of the clay (28 and 33 ft.) and those near the boundaries of the layer
(23 and 38 ft.).
In considering the actual behaviour of the fill, an attempt was made to treat the case by assuming that the clay layer could be considered as a rigid plastic material and that a closed form solution to the process of consolidation could be obtained by using a heat balance integral technique. The basis for this treatment is outlined in Appendix A.
By assuming the clay to be a rigid plastic material, the ratio of the coefficients of consolidation
up
to and beyond the preconsolidation pressure (orl and az)becomes zero. To calculate the dissipation of pore water pressure due to Phase I11 of the process (see Appendix), a value of or2 was required from the laboratory tests. As the working stress range in the field involved the region of ''structural breakdown" in the laboratory tests, the value to be used had to be decided upon. It was reasoned that the structural breakdown would also occur in
EDEN AND POOROOSHASB: SETTLEMENT A T KARS BRIDGE 39
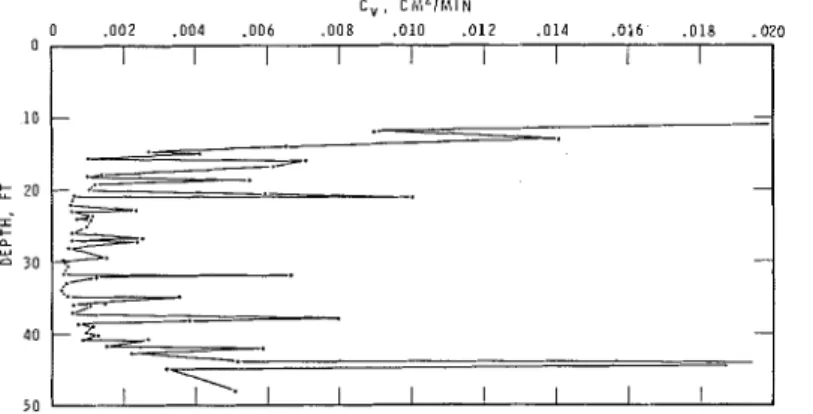
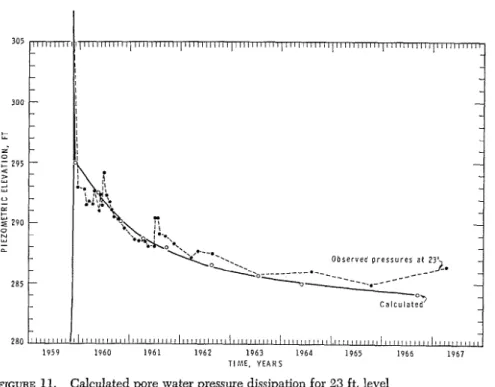
the field and that the c, values from laboratory tests should therefore b e determined from the working stress range. The results of 57 tests from two borings were assembled (Figure 10) and a value of c, or cx2 = .001 cm2/min. was chosen. Calculations were made for the dissipation of pore water pressure at a depth of 23 ft. These calculations are presented in Figure 11, and may be compared with those of the 23 ft. piezometer, also shown in Figure 11.
In comparing the observed and calculated pressures, the following features should be noted. The load addition caused a rapid rise in pore water pressure, which quickly dissipated to a value v . This was followed by the consolidation (Phase 111) process in which the pore water pressures dissipated slowly with time. The fact that the rate of dissipation shown in Figure 11 agrees with the observed measurements suggests that the value selection for c, of 0.001 cm2/min. was reasonable.
If the drainage of the clay layer proceeded as assumed in a vertical direc- tion, then piezometers at 28 and 33 ft. should have shown a signscant gradient towards the 23 and 38 ft. levels. Since this is not the case, either lateral drainage must have been great or signscant pore pressures are created by structural breakdown of the soil. A study of careful photographic records of continuous samples of the soil profile revealed no permeable layers. There might have been small imperfections in the clay, such as minor sand or silt parting, or fissures, which escaped detection. If one examines the piezometric gradients (Figure 6 ) there does not seem to be a significant tendency for lateral drain- age. Thus, the rate of consolidation in the region of structural breakdown of Leda clay may not be entirely dependent on the field permeability, but rather on the viscous type of structural breakdown. Jarret (1967) has demonstrated this phenomenon in laboratory test specimens, and has suggested that the consolidation of Leda clay has three phases: (1) an elastic deformation range up to the preconsolidation pressure; ( 2 ) a structural collapse governed by a form of structural viscosity at and beyond the preconsolidation pressure; and ( 3 ) a normal process of primary coi~solidation with a definite relation between pressure and void ratio. It is suggested that the second phase accounts for a signscant part of the settlements at the Kars site, and that this accounts for
C,, C M ~ I M I N
0 ,002 ,004 .006 ,008 ,010 ,012 ,014 ,016 ,018 ,020 0
I I I I I I I I I
the uniform pore water pressures being measured in the clay layer at the present time.
The observations at the Kars bridge approach fill demonstrate the field behaviour of a layer of highly compressible, lightly overconsolidated Leda clay under a relatively wide load which exceeded the preconsolidation pressure. The observations suggest that:
(1) Because the amount of settlement measured in the field is not greater than predicted, a liberal interpretation can be placed on the value of precon- solidation pressure determined in the laboratory on tube samples taken by refined sampling techniques.
( 2 ) Immediate or elastic settlements in this clay are very slight and the clay had a high modulus of deformation so that it could be considered a "rigid plastic material."
( 3 ) No significant lateral strain or spreading was observed.
( 4 ) The fissured crust of the Leda clay appears to be more compressible and not as free draining as had been originally assumed.
( 5 ) Predictions of settlement on the basis of laboratory tests are difficult due
to the structural breakdown of the clay structure in the region of the precon- solidation pressure. By using values of the coefficient of consolidation deter- mined somewhat arbitrarily from laboratory tests from the working stress range, reasonable agreement has been achieved between the field rate of consolidation and the theoretical treatment.
- 1 1 1 1 1 1 1 1 1 1 1 1 1 1 1 , 1 1 1 1 1 1 , I
-
- I I - I-
I I - I I I I 305 300 + ,L Z 0 - - - - - - - - - E 295 4 2 u " - 0: + 2 290 0 C - 0. 285 280 - - - - - - - - - - - - - - O b s e r v e d p r e s s u r e s a t 23' - _--- -2. - --
-
-_....----
- Calculateo? - - - - l ~ ~ l l l ~ l ~ / I I ~ ~ ~ ~ ~ ~ ~ I I ~ ~ I I I ~ I I I I I ~ ~ ~ ~ ~ ~ I ~ I ~ I ~ ~ ~ ~ ~ I I I I ~ I ~ I I ~ ~ I I ~ I ~ ~ ~ ~ I ~ ~ , ~ ! ~ ~ ~ ~ I ~ ~ ~ ~ ~ I ~ I I ~ I ~ I I I I ~ ~ ~ ~ ~ I I ~ ~ ~ ~ I 1959 1960 1961 1962 1963 1964 1965 1966 1967 T I M E . Y E A R SEDEN AND POOROOSHASB: SETTLEMENT AT XARS BRIDGE 41
ACKNOWLEDGMENTS
The Kars bridge project required the assistance of most of the staff of the Soil Mechanics Section in the preparation and installation of the field instruments and in the extensive laboratory testing program. Particular acknowledgment is due to M. Bozozuk who conducted the initial analysis of settlement. The project was given the full and continued cooperation of the County Engineer of Carleton County, initially Mr. A. J. Graham, and subsequently Mr. G. Weatherall. This paper is a contribution of the Division of Building Research of the National Research Council and is published with the approval of the Director.
REFERENCES
CRAWFORD, C. B., 1964. Interpretation of the consolidation test. JSMGFD, Proc. ASCE 90, SM 5: 87-102.
EDEN, W. J., 1961. Field studies of the consolidation properties of Leda clay. Proc. 14th Can. Soil Mechanics Conf., Assoc. Committee Soil and Snow Mechanics, NRC TM 69.
HAMILTON, J. J., and CRAWFORD, C. B., 1959. Improved determination of preconsolida- tion pressure on a sensitive clay. ASTM STP 254: 25470.
J A ~ T P. M., 1967. Time-dependent consolidation of a sensitive clay. ASTM Materials ~ , Research and Standards 7, 7: 3 0 0 4 .
F ~ Y M O N D , G. P. 1966. Consolidation of slightly overconsolidated soils. JSMbFD, Proc. ASCE 92, SM 5: 1-20.
SKEMPTON, A. W., and BJERRUM, L., 1957. A contribution to the settlement analysis of foundations on clay. Gbotechnique 7, 4: 168-78.
APPENDIX A: SOLUTION TO A NON-LINEAR CONSOLIDATION PROBLEM
This note discusses the nature of consolidation of a slightly overconsolidated clay layer when subjected to a pressure higher than its preconsolidation value. The method used for the analysis employs an expression analogous to the "heat balance integral" used in heat transfer problems. As an extensive account of the method is already given by Goodman (1964), only a brief account will be presented here. I t is convenient to start by giving a concise statement of the problems to be discussed.
A clay layer of thickness lz, underlain by bedrock and free-draining on its upper surface, is subjected to a load of af I ( t ) where a? is constant and I ( t ) is the unit step function. For times t
<
0 the effective stress in the layer ismi, also a constant, and its excess pore water pressure u is assumed to be equal to zero. The clay is initially overconsolidated and the loading is such that,
(1) ( T i
<
(TO<
(TIwhere a. denotes the preconsolidation pressure of the layer. The distribution and variation of the pore water pressure as a function of time and position must be obtained.
The origin of the co-ordinate system is taken at the top surface of the layer and the z axis is taken vertically pointing downwards.
Shortly after the application of the load, the uppermost portion of the layer (i.e., in the vicinity of z fi 0 ) would have consolidated fully so that
where d represents the effective stress. At this level and up to a level z = s ( t ) where
the material becomes normally consolidated (since in this zone a'
2
a o ) whereas for h2
z
>
s ( t ) , the clay is still overconsolidated. In other words, s ( t ) signifies the elevation at which the material changes its nature from over- consolidated to normally consolidated. Another elevation which is also of importance in the subsequent analysis is s, the level of influence i ( t ) . This is defined as the depth beIow which the clay has not as yet felt the effect of surface loading. (The corresponding terminology in heat transfer is the pene- tration distance.) Obviously, both s and i are non-decreasing functions of time that assume the value of zero at t = 0 and will eventually equate to h. It is also clear that since i>,
s the condition i = h is realized earlier than s = h.The process of consolidation has three distinctive phases (mathematically speaking). Phase I defined by i
d
h takes place during the period from t = 0 to ti=,. At the end of this phase, s has a value of si,7,. Phase I1 is defined by siZ7,<
s<
h and progresses during this period from ti,h to t,=7,. Phase 111 is defined by i = s = h and the process continues from tSE7, to t-w. Each of the above three ~ h a s e s must be tseated separately.Phase I
The set of equations governing the process is:
( 6 / 6 t ) ~ 1 = or1(6"6z2)ul for 0
<
z<
s (a) ( 6 / 6 t ) ~ 2 = or2(6"/6z2)u2 for s<
z<
i
(b) u1(0, t ) = w (c) u 2 ( i , t) = - v (d ( 6 / 6 z ) [ u t ( i , t ) ] = 0 (e ( 6 / 6 z ) u i ( s , t ) = (6/6z)us(s, t ) ( f ) u1(s, t ) = us(s, t ) = 0 (gwhere to = a, - (TO and 0 = a 0 - ai are constant and where use has been made of a new parameter a = cr' - ao. Subscripts 1 and 2 refer, respectively, to the portion of the layer that has become normally coilsolidated and to the portion that is still overconsolidated. Parameter a represents the coefficient of consolidation of the clay.
Integration of (1,a) with respect to
z
between limitsz
= 0 toz
= s yields:where
(5) also if
EDEN AND POOROOSHASB: SETTLEMENT AT KARS BRIDGE 43
A similar integration of (1,b) between limits of
z
= s, toz
= i yields, after some simplification,Combining ( 4 ) and ( 7 ) and using condition ( I , f )
(8) Let
and assume a corresponding expression with coefficients a2, b2, and c2 for u2. Substituting these forms of ul and u 2 in equations ( 5 ) , ( 6 ) , and ( 7 ) and
using the boundary conditions (I,c), (1,d) and (1,g) result in the set of equations:
d
(i
- S )-
(e2
+
iv) = 2va2. dtThe original set of partial digerential equations has now been transformed into a set of simultaneous ordinary differential equations that must be solved with the initial conditions 61 = O2 = i = s = 0 at t = 0. Although the variables in I1 are non-linearly coupled, a simple solution of the set in fact exists. For variables i and s this solution assumes the form
(10)
i
= ms(11) s = Mt4
where m = m ( p , P ) and M = M ( p , P ) are independent of time but are functions of dimensionless parameters p and /3 defined by p = ( a l / a 2 ) and /3 = ( v / w ) . Parameters m and M must satisfy the conditions,
(12) 12a2 = M 2 ( m - l ) ( m
+
2)Equation (13) has three roots, two of which are always smaller than unity but the third of which is always larger; it is this root that must be used in (10) since, as mentioned above, i
3
s.Phase I I
Proceeding in exactly the same manner as above or alternatively by putting i = h
44 CANADIAN GEOTECHNICAL JOURN.4L
equations results, which upon substitution for 81, 82 and s and t in terms of dimensionless variable X, Y, Z and T, reads as follows:
where X = (81/wh), Y = (82/wh), Z = (s/h), and T = ( a 2 / h 2 ) t. The appro-
priate initial conditions are determined from the values of el, O2 and s obtained at the termination of Phase I. Unfortunately a simple analytical solution of
III has not been found, and a series form or a numerical technique must be adopted. The latter technique has been used in the particular example given in the text.
Phase 111
This phase of the process starts when t , = h. The problem is no longer non- linear because of the absence of the unlmown variable s. The consolidation process is simply governed by equation (1,a) with boundary conditions (I,c) and the condition (6/6Z) a , (h,t) = 0. The initial condition is determined from the form of a , at the time t = t, = h, i.e., the end of Phase I1 of the process. As the problem is linear from this point on, any standard technique (such as the application of the Laplace Transform) may be used to obtain the solutions.
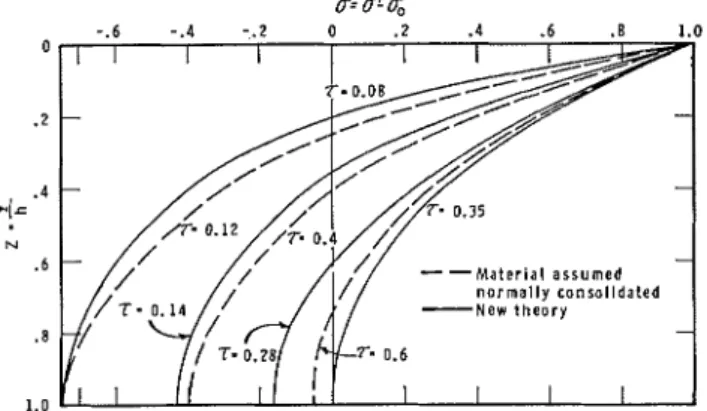
I n Figure 12 the distribution of pore water pressure for the case j3 = .75 and p = # has been represented. The solid curves correspond to the same sample configuration and mode of loading as when normally consolidated throughout the process. The effect of the overconsolidation is quite clear; up to the end of the second phase, the rate of dissipation of the pore water pressure has been nearly twice as fast as the corresponding rate, had the sample been normally consolidated.
EDEN AND POOROOSHASB: S E T T L E m N T A T KARS BRIDGE 45
If the clay material is assumed to be rigid plastic (plastic in a broad sense), then equations (1,a) and (1,b) would reduce to
( 6 ~ 1 / 6 t ) = ( 6 ~ / 6 t ) = a .
In other words, Phases I and I1 would be completed in an infinitesimal time period. Physically this means that the clay would momentarily experience the high initial imposed pore water pressure but would immediately dissipate it to the level of v . This assumption has been made in the above case history and the results appear to be in agreement with theory.
The mode of application of the "heat balance integral" technique is poten- tially extensive and is a powerful tool for solving linear and non-linear consoli- dation problems. The basic aim of this Appendix has been to demonstrate the application of the "heat balance integral" technique to the solution of a typical consolidation problem. The exact nature of the problem is incidental; in fact, the set of equations I (with appropriate conditions employed in lieu of 1,d and 1,c) can be rewritten in their finite difference forms and the resulting set of algebraic equations solved by any technique of successive approximations
(see, for example, Raymond 1966).
REFERENCES
GOODMAN. T. R.. 1964. Contribution to Advances in Heat Transfer (Academic Press. New . .
YO;^)
: 52-120.RAYMOND, G. P., 1966. Consolidation of slightly overconsolidated soils. J S M b F D , PTOC.