HAL Id: hal-01060913
https://hal.archives-ouvertes.fr/hal-01060913
Submitted on 4 Sep 2014
HAL is a multi-disciplinary open access
archive for the deposit and dissemination of
sci-entific research documents, whether they are
pub-lished or not. The documents may come from
teaching and research institutions in France or
abroad, or from public or private research centers.
L’archive ouverte pluridisciplinaire HAL, est
destinée au dépôt et à la diffusion de documents
scientifiques de niveau recherche, publiés ou non,
émanant des établissements d’enseignement et de
recherche français ou étrangers, des laboratoires
publics ou privés.
An Evidential Scheme for a Velodyne Ground Truth
Chunlei Yu, Philippe Bonnifait, Véronique Cherfaoui
To cite this version:
Chunlei Yu, Philippe Bonnifait, Véronique Cherfaoui. An Evidential Scheme for a Velodyne Ground
Truth. Perception for the Intelligent Vehicles, workshop, RFIA 2014, Jun 2014, Rouen, France.
�hal-01060913�
An Evidential Scheme for a Velodyne Ground Truth
Chunlei YU
1Véronique Cherfaoui
1Philippe Bonnifait
11
Université de Technologie de Compiègne
[email protected]
Domaine principal de recherche: RFP
Papier soumis dans le cadre de la journée commune: NON
Résumé
Un système de vérité terrain est indispensable pour tester un système de perception pour les véhicules intelligents. Cet article utilise le formalisme des grilles d’occupation évidentielles qui peut être appliqué à la gestion des in-certitudes des capteurs. Un modèle de capteur évidentiel qui interprète les données acquises par le Velodyne en une grille d’occupation 2D est ainsi conçu et étudié. Les infor-mations provenant du capteur sont traitées sur la base de pincipe d’engagement minimal pour garantir l’intégrité de l’information fournie. Les résultats expérimentaux mon-trent que cette approche peut gérer efficacement les incer-titudes du capteur et donc fournir une vérité terrain fiable tout autour du véhicule.
Mots Clef
Grille d’occupation, theorie évidentielle, vérité terrain, Velodyne
Abstract
This paper proposes an evidential occupancy grid map-ping framework that can be applied to manage the sensor uncertainties. An evidential sensor model that interprets the data acquired by the Velodyne to a 2D occupancy grid map is conceived. The information from the sensor is pro-cessed based on the least commitment principle to guaran-tee information integrity. Experimental results prove that this approach can handle efficiently the uncertainties of the sensor and thus a reliable ground truth map all around the vehicle can be built.
Keywords
Occupancy grid, evidential theory, ground truth, Velodyne
1
Introduction
A ground truth perception equipment is a key issue for the development of driving assistance systems and au-tonomous vehicles. Although the V elodyne lidar [1] pro-vides rich and accurate information about the surrounding
environment, an adapted sensor model to tackle its un-certainty and to fully profit its rich information is rarely discussed in the literature. To cope with errors and un-certainty for building occupancy grid maps in perception systems, Bayesian methods are the common background. Many extensions have been published in the literature, like the Bayesian Occupancy Filter (BOF) [2] which estimates both the occupancy and the speed of the cells. [3] proposed an extended occupancy grid approach which can be used to track non-rigid moving objects. [4] applied a Bayesian oc-cupancy grid map to detect road boundaries. In this paper, we propose an evidential framework to build an occupancy grid map in the proximity of the host vehicle. We propose a tailored sensor model which interprets V elodyne data frames into a local 2D occupancy grid map in this work. A fusion process based on Dempster Shafer data fusion en-hances the ground truth map by fusing data acquired at dif-ferent locations.
The paper is organized as follows: Section 2 details the ev-idential sensor model developed to merge high definition lidar sensor measurements into scan grid maps. Section 3 illustrates the fusion scheme based on the evidential frame-work. Section 4 shows the implementation details and ex-perimental results.
2
An evidential sensor model for the
Velodyne
In this section, an inverse sensor model for the V elodyne is developed. In our approach, we build 2D evidential oc-cupancy grid map (denoted as scan grid) with data from the Velodyne by making a projection on the ground plane.
2.1
Evidential framework
The frame of discernment is defined as: Ω = {O, F }, the two singletons are the proposition O and the proposition F, indicating respectively that the specific cell is Occupied and F ree. One has to increase this set, by considering the power set which is defined as 2Ω= {∅, F, O, Ω}. Ω
indi-cates ignorance about the state of the cell (U nknown cell), and ∅ indicates that no proposition fits the cell.
The basic probability assignment (BP A) is a direct sup-port for a proposition, which is denoted by function m.
2.2
Polar sensor model basic concepts
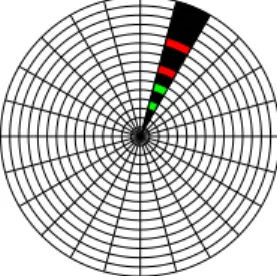
In order to be as close as possible to the sensor’s rotating acquisition process, the scan grid map is created in a polar frame.
Figure 1: Space representation in Polar Coordinates, show-ing how measurements from V elodyne can be interpreted in the evidential framework. Green refers to free space, red refers to occupied space and dark refers to unknown space.
As shown in Figure 1, the whole space around the car is di-vided into angular sectors, while each sector in the space is divided into different cells. For the BP A assignment pro-cess, we consider the sectors independent from each other. Indeed, if the sampling of the grid is high enough and since the laser beam width is very small, this assumption is well verified. The state assignment respects the least commit-ment principle. Velodyne points provide information about the state of the scanned cells. Therefore, the space where there is no information is treated as U nknown.
2.3
Grid state assignment
Let define an elevation threshold denoted H which spec-ifies the elevation of points considered as obstacles. The value of the threshold has to be chosen carefully in order to filter noise. When the elevation of an echo is above H, we consider the cell Occupied.
G1 G2 H1 H2 G3 H h H3 G4 H4 Range Angle O U U U U F U F F U F F U U U U 1 2 3 4 5 6 7 8 9 10 1112 13 14 15 16 17 18 1920 O λ U L H5 O U O1 x S λ
Figure 2: Sensor model for the scan grid construction process. Top, bird view of the host vehicle, x represents the motion direction. Middle, lateral visualization of the threshold scene and of the backward free extrapolation (short vertical lines, explained in section 2.4). Bottom, state assignment.
Figure 2 illustrates the state assignment process. To dif-ferentiate the ground information from the above-ground information, we set up a scene where a human and a car
are near our host vehicle. Nine beams from Velodyne are drawn for illustration. The four lowest green beams hit the ground, where G1, G2, G3 and G4 are respectively the intersections on the ground. The five red beams reach the human and the car in the distance, and their intersec-tions are H1, H2, H3, H4 and H5. The grid on the bot-tom serves as an illustrating plot of the polar world model shown in Figure 2, in which the horizontal axis shows the range variation and the vertical axis represents the angle variation. One object O1 is designed near the host vehi-cle to illustrate the fact that there exists space that is not detectable with Velodyne installed on the roof. Thus the least commitment principle can guarantee the information integrity in the model.
Based on the least commitment principle, the state allo-cation process obeys the following rules: the cells which contain the H3, H4 and H5 are marked O(Occupied), as these points are above the threshold; the cells which contain respectively G1, G2, G3 and G4 are marked as F (F ree), as these points are detected on the ground; al-though H1 is beneath the threshold H, abut the same cell also contains the H2, which is above the threshold, to elim-inate the potential conflict, in our approach, we make an additional assumption: a detected obstacle is modeled as a vertical surf ace that is linked to the ground. This cell is marked Occupied. All the other cells are marked U (U nknown).
2.4
Backward free space propagation
One benefit of defining the threshold H is the extension of the F ree region by making a backward extrapolation to the host vehicle. The effect is illustrated in Figure 2. Consid-ering the beam which intersects the ground at G4, one can deduce that there is no obstacle in the interval L which has an elevation superior to threshold H. In this case, the zone F ree corresponding to G4 is extended towards the host ve-hicle. The states of cell 8 is also set to F ree because we extrapolate at point G3. Cell 5 is not propagated to F ree because the extrapolation distance can not cover the whole cell, no state propagation is made.
2.5
Grid mass assignment
We need now to assign a BP A to the grid cells to quantify the belief. We propose a grid mass assignment model based on information accumulation. In Figure 2, cell 6, cell 9 and cell 12 are all set to F ree. However, we should have unequal amount of beliefs about their F ree state because in cell 6, there exist two points on the ground to support the state, whereas in cell 9 and cell 12, there exists only one point. The same stands for the Occupied cells, cell 15 and cell 19 should have unequal amount of beliefs about the occupied state. M ore points supporting one state should contribute to more belief s on the state. This accumulation concept reinforces the belief assigned to each proposition.
The BP A values are based on sensor uncertainties. Let αF A and αM D correspond to the the probability of false
δs Beam divergence of Lidar projected on ground δg Angle resolution of polar grid
Figure 3: Missed-detection illustration
alarm and missed-detection. A false alarm is when the sen-sor issues an impact whereas there is nothing. It depends essentially on the sensor noise and on multipath propaga-tion. A missed detection is mainly related to the reflex-ivity of the target and to the ratio between the cell size and the beam width. Figure 3 shows how this ratio results in missed-detection. δsrepresents the divergence of Lidar
(beam width), and δgrepresents the angular resolution of
the polar grid. In this circumstance, one beam of Lidar can not cover the whole sector. This beam can miss potential obstacles within its blind regions of the cell. The missed-detection effect thus has to be considered.
The proposed model calculates the BP As with proba-bilistic approach. Based on the definition of false alarm, its probability αF A = P (C = F | ξ1), Where ξ1
rep-resents one obstacle impact in the cell, C stands for the state of the cell. If we suppose that errors are indepen-dent, the total false alarm probability in one cell given nO obstacle points are detected in this cell should be
P (C = F | ξ1, ξ2,... , ξN) = αnF AO. Thus the
prob-ability of Occupied can be represented as: P (C = O | ξ1, ξ2, ..., ξN) = 1−αnF AO. Based on the same
method-ology, for F ree cells, the missed-detection probability αM D = P (C = O | ∆), where ∆ represents no above
ground impact is returned to the sensor. If we assume nF
ground points are detected in this cell, the total missed-detection probability should be αnF
M D. Thus the probability
of F ree should be represented as 1 − αnF
M D.
The BP A assignment thus follows the rules below: For a F ree cell:
m(O) = 0, m(F ) = 1−αnF
M D, m(Ω) = 1−m(F ), m(∅) = 0
For an Occupied cell: m(O) = 1−αnO
F A, m(F ) = 0, m(Ω) = 1−m(O), m(∅) = 0
For an U nknown cell, the initial state is kept: m(O) = 0, m(F ) = 0, m(Ω) = 1, m(∅) = 0 To keep the processing load reasonable, we suggest to ex-trapolate the free level m(F ) uniformly in the backward propagation with no decrease to the cells that have no echoes.
2.6
From polar to Cartesian
The approach merges the Velodyne scan data into occu-pancy grid map. This map is built in a polar coordinate
system, but for the fusion purpose, we need to transform it into a Cartesian coordinate system. All the information collected has to be transformed into Cartesian coordinates, with the least loss. In our approach, we have adopted the bilinear interpolation algorithm introduced by [5].
3
Ego-Map Grid Fusion
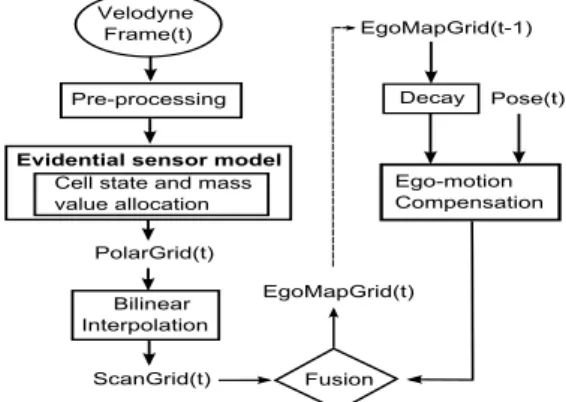
The scan grid map is not complete, because there exist uncertainties in the map due to unperceived space. With Dempster’s conjunctive rule, the fusion of several succes-sive scan grids allows to eliminate the uncertainties in the map. To make this fusion, the ego-motion of the host vehi-cle has to be compensated and then every new scan grid of the Velodyne is merged into a grid denoted EgoM apGrid.
Velodyne 1Frame(t)
Evidential sensor model Cell1state1and1mass1111111111111 value1allocation PolarGrid(t) 11111Bilinear1 Interpolation ScanGrid(t) Pre-processing EgoMapGrid(t-1) Decay Ego-motion1 Compensation 1 Pose(t) 11111111Fusion EgoMapGrid(t)
Figure 4: Workflow of the scan grid construction and fu-sion
Figure 4 illustrates the whole approach. The fusion process is sequential. At time t, the new scan grid ScanGrid(t) updates EgoM apGrid(t − 1) to provide a new EgoM apGrid(t).
To accommodate to the dynamic environment, we adopt the approach proposed by [6] and use a decay factor for EgoM apGrid. The information in EgoM apGrid can be-come aged and not consistent with reality. This effect can be especially important when moving objects are in the scene. The equations below show how mass functions are discounted with a decay factor denoted β.
β
mM(A) = β ∗ mM(A), A ⊂ Ω
βm
M(Ω) = 1 − β + β ∗ mM(Ω)
The fusion process adopts the Demster-Shafer conjunctive rule, as shown in Equation 1. For denotation purpose, let mM,t and mS,t represent respectively the mass functions
of EgoM apGrid and ScanGrid at time t.
4
Experimental implementation and
results
4.1
Experimental implementation
The approach was tested with the vehicle shown in Fig-ure 5a. FigFig-ure 5b displays the trajectory. We have imple-mented the approach in C++.
(a) CARMEN vehicle. V elodyne is installed on top
(b) Trajectory of the Experiment (Red line)
Figure 5: Experimental platform of Heudiasyc and Trajec-tory
The V elodyne data was acquired at 10Hz frequency. The ego-motion between two scans is estimated using CAN data. For the purpose of demonstration, the scan grids of (72 ∗ 72) meters are built with uniform cells of size(0.1 ∗ 0.1) meters. In the polar grid map, the angular resolu-tion is 0.5 degrees and the radius resoluresolu-tion is 0.1 meters. For the tuning parameters, we have adopted αM D = 0.66,
αF A = 0.15. αM D is based on the ratio of the beam
di-vergence of V elodyne (estimated to 0.17 degrees by [7]) and the resolution of the grid (0.5 degrees). We have tuned αF Ato 0.15 in order to consider the sensor noise and the
multipath phenomenon.
4.2
Results
Figure 6: Occupancy scan grid with backward extrapola-tion, H = 0.2. Green represents F ree space, Red represents Occupied space, Dark represents U nknown space.
One typical scene is chosen where the host vehicle is in an urban road. The resultant scan grid is shown in Figure 6.
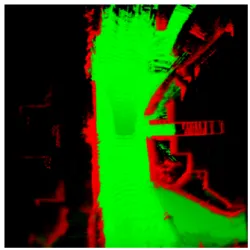
Figure 7: Fusion result map of several scan grids.
H is set to 0.2 for illustration. Figure 7 shows the result of fusion. One can remark that the green level in the cen-tral part of the fusion result map is lower compared to the other surrounding parts of the F ree space. The reason for this phenomenon is that the sensor receives no information from this space in the present scan. The decay factor was set to 0.98 to slowly discount aged information. This effect is noticeable in the fusion result map: the right bottom part of the map shows darker green which means less evidence to be F ree. This can also be explained by the ScanGrid: the state of this space is U nknown in the ScanGrid. With no evidence supporting the space state, the system tends to gradually forget its past state. In this case, m(F ) decreases until the system totally forgets the state, and it becomes U nknown again.
5
Conclusion
In this paper, we have proposed an evidential sensor model to interpret V elodyne data into scan grid maps. Based on the least commitment principle, the proposed model provides reliable grid state indications of the space. The principle of information accumulation enables to manage the sensor’s uncertainties based on probabilistic approach, which greatly augments the accuracy of mass allocation. The resulting scan grid map is conservative so provides high reliability. The fusion process based on the evidential theory yields a complete occupancy grid map. Based on the real experiments, we have observed that the approach pro-vides satisfactory results. In future work, this occupancy grid map can be used as ground truth to evaluate the per-formance of other perception schemes that use cheaper sen-sors.
References
[1] V. L. Inc., HDL-64E S2 and S2.1 High Definition Li-DAR Sensor User’s Manual and Programming Guide. Velodyne LiDAR Inc., 2010.
[2] C. Coue, C. Pradalier, C. Laugier, T. Fraichard, and P. Bessiere, “Bayesian occupancy filteing for multi-target tracking : an automotive application,” Interna-tional Journal of robotics research, vol. 25, no. 1, pp. 19–30, 2006.
[3] B. Lefaudeux, G. Gate, and F. Nashashibi, “Extended occupation grids for non-rigid moving objects track-ing,” Intelligent Transportation Systems (ITSC), Inter-national IEEE Conference, p. 7, 2011.
[4] T. Weiss, B. Schiele, and K. Dietmayer, “Robust driv-ing path detection in urban and highway scenarios us-ing a laser scanner and online occupancy grids,” Pro-ceedings of IEEE Intelligent Vehicles Symposium, p. 6, 2007.
[5] J. Moras, “Evidential perception grids for robotics nav-igation in urban environment,” Ph.D. dissertation, Uni-versité de Technologie de Compiègne, 2013.
[6] J. Moras, V. Cherfaoui, and P. Bonnifait, “Moving ob-jects detection by conflict analysis in evidential grids,” IEEE Intelligent Vehicles Symposium (IV), vol. 6, 2011.
[7] H. LONJARET and J. BENOIST, “Rapport d’essais de qualification de l’imageur laser,” ANR, Tech. Rep., 2010.