VII. COMMUNICATION RESEARCH
A. MULTIPATH TRANSMISSION
Prof. L. B. Arguimbau J. Granlund
B. Brown W. L. Hatton
F. G. Cole J. B. Lewi
R. A. Paananen 1. Speech and Music
a. Field tests on frequency-modulation reception
Field tests have been completed. They indicate that frequency modulation can give excellent quality under favorable conditions, virtually eliminating noise and selective fading. Under most conditions met in the field frequency modulation appeared to be quite favorable in comparison with typical amplitude-modulation reception at the same
wavelength. L. B. Arguimbau, J. Granlund
b. Simplified receiver
The simplified FM receiver has been constructed and tested. A schematic drawing of the unit appears in Fig. VII-1.
Functionally the unit consists of a flat stagger-tuned i-f amplifier, a two-stage limiter using IN56 crystals with 2 volts of bias, a single-tube Granlund-type discrimi-nator of 2-Mc bandwidth, and de-emphasis and audio circuits. A side amplifier and rectifier to provide automatic volume control voltages and tuning indication is also included.
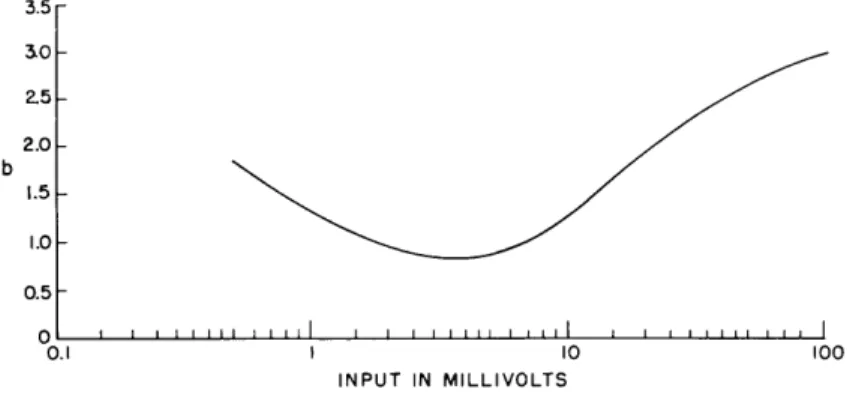
Fig. VII-2 shows the signal-to-interference ratios needed for effective suppression of interference. The optimum operating range as seen from the graph is quite small.
3.5 a0 2.5 2.0 db 1.5 1.0 0.5 0 I iiiii 111111 , I11111 1111 I 0.1 10 100 INPUT IN MILLIVOLTS
Fig. VII-2 Suppression threshold as a function of input.
Some improvement can be made by rearranging the stagger-tuned amplifier. The
presence of automatic volume control in the r-f unit will tend to keep the operating point
in the desired range. R. A. Paananen
-62-(VII. COMMUNICATION RESEARCH)
c. Three-path propagation interference
The expression for the average frequency of the sum of three carriers, which ap-peared in the Quarterly Progress Report, April 15, 1950, has been considered in more
detail and found to be misleading. The average frequency can be expressed in a very simple form:
Aw
+ Be 2 + Cw3S2 3
1 iT
a
The three carriers have strengths a, b, and c, and frequencies
el,
w2, and w3 respec-tively. The angles A, B, and C are determined from the signal strength triangle as indicated. If the strength of one carrier is greater than the sum of the other two strengths, the triangle cannot be formed, and the average frequency is exactly the fre-quency of the strongest carrier. If the differences of the carrier frequencies are com-mensurate, the expression above represents the average, over all possible initial phases of the carriers.The reasoning which led to the result above is rather interesting. The addition of the three carriers is indicated in the vector diagram of Fig. VII-3. If (w3 - l) and
Fig. VII-3 Vector diagram showing addition
of three carriers.
(W2 - Wl) are incommensurate, the diagram never repeats itself exactly. In other words, the sum is aperiodic, and any averaging must be done over all time. The instantaneous frequency of the sum is
dO Wi = Wl +
T-and the average frequency is
T - lim 1dt
Wi
= T+o-o T i dt.-T
(VII. COMMUNICATION RESEARCH)
a and b signals are in phase, and the c signal leads them by
p.
If another time reference
had been chosen, another value of 4 would have resulted. Considering all possible time
references, all values of 4i are equally likely. Thus it is correct to average, over all
possible values of 4:
2wr Zr T
- 1 - 1 f lim 1 (
i 2i ) 1 2 d
T-co
2T ) i dt0
0
-T
Changing the order of integration, we have
T
2w
lim1
1
Ti = T o - dt r rWi
dk-T
0
Functionally, the instantaneous frequency is i[ (w2 - )
t,
(3 - wl) t + 4] . Afterper-forming the definite integral on
4,
or on [(w
3
-
I) t
+
4
] since t is constant during the
integration, the result is some function of the angle
(w
2- wi)t.
This function is clearly
periodic in 27r/(w
2-
q),
so that the average over all time amounts to an average over a
period, similar to the integration on L.
The advantage of this devious method is that the two integrations can be performed
easily, while the limiting process initially proposed presents serious difficulties.
In
addition, the method suggests a way of finding the average frequency of the sum of
more than three carriers: all but two are given initial phases, 41, 2 etc., over which
averages may be performed.
J. Granlund
2.
Television
Preliminary work has been completed by F. Cole on the subject of the use of
pre-emphasis and clipping for FM video.
The results are difficult to evaluate because of the
inferior quality of video signal available for test purposes.
The signal was obtained
from a commercial television receiver tuned to a local station.
The exciter for the FM transmitter has been completed.
It obtains a deviation of
5 Mc/sec at a center frequency of 50 Mc/sec with a conventional reactance tube.
The
speed of response needs improving, as it takes about 0. 15
sec to go from 10 percent
to 90 percent of the total frequency change.
This figure should be around 0. 08 tsec or
better. A modulation monitor working over a band about 12 Mc/sec wide was built for
checking the frequency dynamically.
From the construction of this unit it would seem
possible that a discriminator 60 Mc/sec can be built for the receiver. However, the
current requirement for fast action is such that 829B tubes would have to be used.
A few preliminary calculations have been made on the possibility of limiting the
over-shoot due to pre-emphasis in video signals by the use of phase shifting networks.
The
64-(VII. COMMUNICATION RESEARCH)
phase of the video signal is distorted in the transmitter and restored in the receiver.
The system shows promise. W. Hatton
B. STATISTICAL THEORY OF COMMUNICATION
Prof. J. B. Wiesner P. E. A. Cowley A. J. Lephakis Prof. W. B. Davenport, Jr. L. Dolansky H. E. Singleton
Prof. R. M. Fano E. H. Gibbons O. H. Straus
Prof. Y. W. Lee P. E. Green, Jr. C. A. Stutt
Prof. J. F. Reintjes L. G. Kraft I. Uygur
Dr. E. E. David, Jr. L. Weinberg
1. Analogue Electronic Correlator
A design for the analogue electronic correlator has been worked out, and most of the circuits constructed and tested.
In the present design, master timing pulses are formed in a blocking-oscillator type of pulse generator, and sampling pulses are obtained from the trailing edges of two phantastron delay circuits. The sampling pulses are separated by a time interval which is controllable between 0. 5 t sec and 2000 [isec. Each sampling pulse is used to
store, on a capacitor, a charge proportional to the input-signal function at the instant of sampling. During each sampling interval, the storage capacitor is charged or
dis-charged to the proper voltage level through a triode which is held cut-off except during the time of sampling. The circuit has been designed for a charge and discharge time
constant of approximately 0.2 [sec. The sampling pulses have a duration of 1 [sec. One of the variable-amplitude capacitor voltages produced is converted to a pulse-duration-modulated signal by means of an overdriven cathode-coupled amplifier, a sawtooth generator, and a bistable multivibrator. The sawtooth-voltage wave is
initiated at the instant the input signal is sampled, and the sawtooth wave, together with the variable-amplitude voltage produced across the storage capacitor by the input signal, is applied to the cathode-coupled amplifier. An output pulse delayed (with respect to the instant of sampling) by an amount proportional to the input-signal amplitude is ob-tained from the cathode-coupled amplifier. This pulse and the sampling pulse trigger the bistable multivibrator, which provides a rectangular-voltage wave having a duration proportional to the amplitude of the input-signal function at the instant of sampling.
The pulse-duration-modulation circuit has been designed for a maximum modulation
of + 50
psec
about a quiescent value of 100 lisec. Maximum modulation is obtained foran input-signal voltage of 60 peak-to-peak volts.
The duration-modulated and variable-amplitude waves are combined in a coincidence circuit, and the combined pulses are integrated to produce the correlation function. Circuits for performing these two operations are now being constructed.
T IN MILLISECONDS
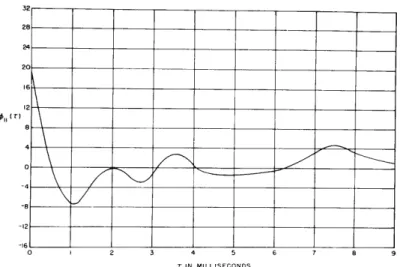
Fig. VII-4 Autocorrelation of speech, male voice.
0"1 (T
T IN MILLISECONDS
Fig. VII-5 Autocorrelation of speech, male voice, for a smaller range of T.
(VII. COMMUNICATION RESEARCH)
2. Autocorrelation of Speech
Three determinations of long time speech correlation have been made. Magnetic
tape recordings 15 minutes in length were used for speech samples. Figure VII-4 is
the autocorrelation of a male voice over a T-range of 25 milliseconds. Approximately
14, 000 product pairs were averaged for each point obtained on the curve. Figure VII-5
is an autocorrelation obtained from the same speech recording over the smaller range
of T indicated. Approximately 28, 000 product pairs were averaged in obtaining this
curve. Figure VII - 6 is a similar curve for a female voice.
Y. W. Lee, L. G. Kraft, I. Uygur
3. Dete ction of Small Signals in Noise
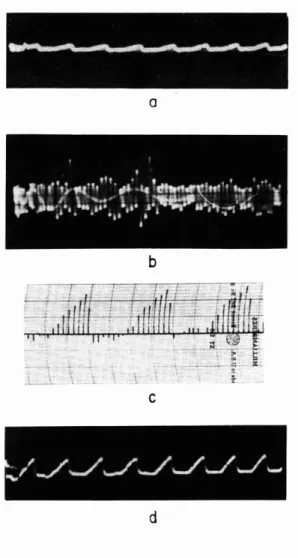
The digital electronic correlator has been used to detect the waveshape of several
small periodic signals mixed with noise. In addition to the detection of a square wave,
as reported in the Quarterly Progress Report, April 15, 1950, sawtooth, exponential, and staircase waveforms have been detected.
Figure VII-7 shows the results in the case of the sawtooth waveform.
Y. W. Lee, L. G. Kraft, 1. Uygur
a
b
c
~I/'JJJJJJJ..,
d
Fig. VII-7 Detection of periodic
wave-form in noise.
a. Sawtooth (actual size)
b. Sawtooth plus noise (input to correlator) c. Output of correlator
(VII. COMMUNICATION RESEARCH)
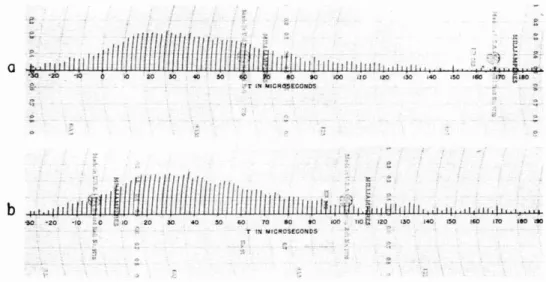
4. Experimental Determination of System Functions by the Method of Correlation
The theoretical result that internal noise should not affect the determination of
system functions by the method of correlation has been experimentally verified. An
a
b
~..
~ -,~ '" ;,::-
::~
:: " ~~..
~-:" ;; ~.GO .,Yo leo ~
" - :;:
c: ;:
e
Fig. VII-8 Crosscorrelation curves obtained (a) without inte rnal noise (b) with inte rnal noise.
amplifier incorporating an internal source of noise was constructed and its system re-sponse found on the correlator as described in the Quarterly Progress Report, April 15,
1950. Figure VII-8 shows the results obtained when the internal noise source is set at
zero and at the maximum value consistent with linearity considerations of the theory.
J.
B. Wiesner, Y. W. Lee, L. G. Kraft5. Noise in Nonlinear Devices
The statistical characteristics of the output of a nonlinear device for a noise input or an input of noise plus a sinusoidal signal (modulated or unmodulated) have been known
for a number of years. An attempt is being made to verify the theoretical results
experi-mentally. A band-pass filter with variable Q and a noise amplifier have been built. The
output of the amplifier is fed to a linear rectifier. It is intended that the correlation
functions of the input and the output of the rectifier will be obtained by means of the elec-tronic correlator; it will then be possible to obtain the power-spectrum curves through
use of the electronic differential analyzer.. Y. W. Lee, L. Weinberg
6.
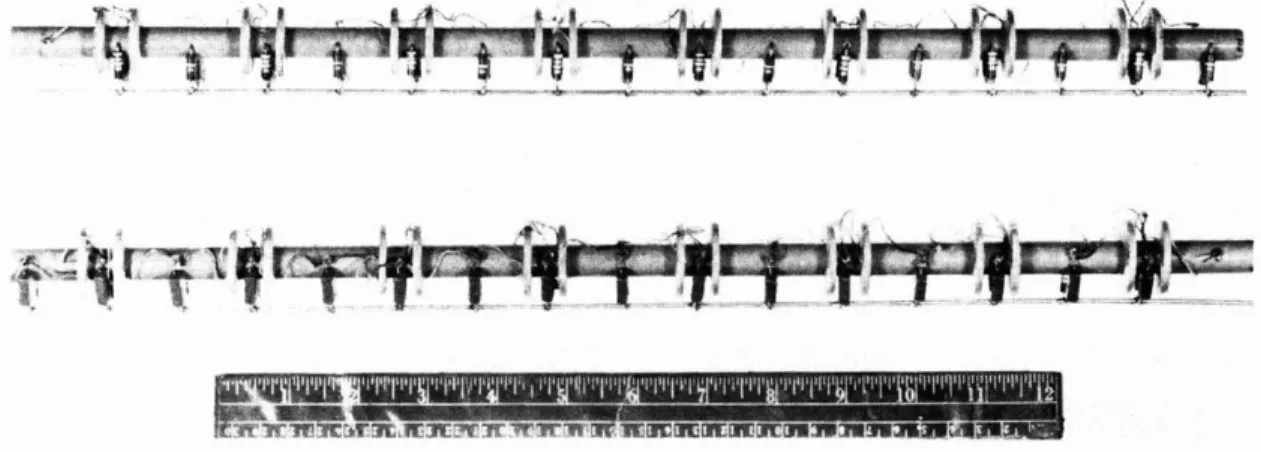
Techniques of Optimum Filter DesignThe flexible transmission system for approximating arbitrary transient responses
is nearing completion. The basic feature of the device is a tapped delay line having a
total delay of 500 IJ.sec with tap points at 10-lJ.sec intervals. This line is made up of
-68-(VII. COMMUNICATION RESEARCH)
100 line sections similar to those pictured in Fig. VII-9. Each section provides a 5-tJ. sec
delay, and is made up of sixteen prototype and m-derived sections. The nominal
charac-teristic impedance of the line is 1000 ohms, and the cut-off frequency is 1
Mel
sec. TheFig. VII-9 Typical line sections in delay-line filter.
relatively high cut-off frequency is used so that the shape of the pulses used in setting
up a desired impulse response will be preserved as they progress along the line. To
insure further that the pulse shape is preserved, and to insure proper functioning of the line as a filter in the audio frequency range, sufficient shunt loading is inserted to pro-duce distortionless transmission.
A section of line 60 tJ.sec in length has been completed. Its performance in affording
a seven-point approximation of arbitrary time responses of that duration has been quite satisfactory.
In addition to its primary function as a flexible linear system, the delay-line filter has seve ral other applications of interest in communication and network theory problems.
For example, it may be used as
a. Computer of Fourier transforms. By observing the frequency response of
the line when set up for an arbitrary time function, one automatically computes or
meas-ures the Fourier transform of the time function. Power spectrum functions may be
obtained from correlation functions in this manner.
b. Computer of convolution integrals. On account of attenuation the line is split
into two sections with interposed amplifier. Each section may be adjusted for a
particu-lar impulse response, then, when connected in cascade, the over-all time response is the convolution of the two functions.
c. Function generator.
d. Storage device.
e. Delay device for computing correlation functions.
(VII. COMMUNICATION RESEARCH)
7. Theory of Nonlinear Transducers
Scope of the Theory. A useful theory of nonlinear transducers need not have as great a degree of generality as the present linear theory. Since a given transducer is designed to work only for a well-defined input ensemble governed by a set of probability distribution functions, its behavior need be specified only for the ensemble under con-sideration. This is in contrast to the linear theory, which applies to any input whatever. The linear theory is also very complete with respect to energy considerations. Insofar as the processing of information is concerned, these energy considerations are irrele-vant. What is important from the point of view of information theory is how the
trans-ducer operates on the input signal to produce the output signal. By concentrating on this aspect of the transducer's behavior, it seems likely that a useful theory can be developed. Such a theory should be helpful in the study of existing or projected nonlinear networks, in the design of encoding and decoding equipment, and in the design of noise discrimi-nators, predictors, and other operators.
Basis for the Theory. In the linear case the principle of superposition has led to a very general theory based on exponential functions and Fourier techniques. The failure of superposition for nonlinear transducers leads to a search for another base on which to build a theory. A possible answer suggested by Wiener lies in the concept of time-invariance. According to this point of view, the past of the input to a transducer is represented by a series of numbers ul(t), u2(t), ... , un(t), and the output of the
trans-ducer is a function of the several variables ul, u2 , .... un:
Output = F(ul, . .. ., u n)
Since the transducer is time-invariant, its output for any prescribed test input will be the same, independent of when the test input is applied, provided only that transients or other effects due to previous inputs are clear prior to application of the test.
The function F represents the behavior of the transducer under all conditions which are to be encountered, and it can accordingly be considered as the system function of the transducer. For purposes of mathematical manipulation and physical representation F may be expanded in a series (such as a power series, or a series of Hermite functions*); or the multi-dimensional space of the variables ul, ... , un, which is the domain of F,
may be broken up into cells such that F may be taken as constant in any one cell, thus permitting a graphical representation of the system function.
Applications of the Theory. By means of the theory it appears possible to show that any time-invariant transducer can be approximated arbitrarily closely by means of a network composed of resistors, inductors, condensers, rectifiers, and direct-current *The expansion in Hermite functions and its application to the experimental study of transducers are due to N. Wiener.
-70-(VII. COMMUNICATION RESEARCH)
sources. The theory also indicates methods for experimentally determining the system function of unknown nonlinear networks. A central problem which needs study is: Given a specified transducer and an input having a specified set of probability
distribu-tions, what is the set of probability distributions of the output ? This is a problem of analysis. The corresponding synthesis problem is: Given the probability distributions of the input and output of a transducer, what is the system function of the transducer? The question of physical realizability comes in here, as does also the question as to the conditions under which a transducer has an inverse.
The theory is also applicable to the problem of channel matching and to the problem of noise discrimination. The performance of a noise discriminator may be optimized on the basis of the minimum mean square error criterion, or on the basis of minimizing the probability that the error will be greater than a predetermined maximum. A specific example of the use of the theory to determine the optimum noise discriminator on the basis of the minimum mean square error criterion is given below.
Example. We consider the discrete quantized case, i. e. the case in which an ergodic source generates at regular intervals one of a finite set of possible symbols (numbers). The source drives an encoding transducer which has a finite memory. The transducer produces an output symbol un for each input symbol xn,
un = F(xn, Xn-l , . ., Xn-m+I)
so that the encoding transducer operates on a finite set m of the past input symbols. If the transducer is time invariant, F may be expanded in a series:
F = a. x xj .. h
, n n-l " Xn-m+l
The purpose of the encoding transducer is to predistort the input signal in such a way as to combat most effectively the noise on the transmission channel. At a repeater
station it will generally be desirable to make use of a nonlinear noise-removing trans-ducer G in order to avoid the cumulative effects of noise. The optimum system function (in the least mean square error sense) of such a transducer may be found as follows: Let v be the received time series. Let
n
w = G(v , v _1 , ... -V ) = c. v . .
v
n n' n- n-q+l i, . n n-1 n-q+l
be the output of the noise-removing transducer G. Then, since un is the input to the channel,
w =u +e or e =w -u
n n n n n n
(VII. COMMUNICATION RESEARCH)
e
2
Zlim
1
n
N-oo 2N + I
-N (w n - u nand by minimizing this error we obtain the constants [c] which define the optimum
trans-ducer G.
We first rewrite w :
n
n
T
C
aVQ(n)
where each V (n) represents one of the products vi vnl
c
n n-1corresponding c. ci, j,... , " Then
= lim N -. o0
Vn-q+l'
and C is the Ca Va(n) - unl N1 2N 1TN
CL N lim 1 N-+ co 2N + 1 -N+
Q u -2 C C lim Q LN- oo
lim 1 a N->-c 2N + 1 N -NN
2N + 1
V
V(n) V (n)
-N
The limits in the above equation are statistical parameters which will be denoted by cuu' cuV" and cVV, so that
uu(0) - 2
C
C
CpV(a)
+
CL
a
ap
Ca CL
CVV(a,
p)In order for to be minimum, we must have 8/8C = 0 for all y.
7 = -2 uV(,Y ) +
2
C CVV(a,y)) C VV( ) = 1.
V>)3 CVV ( a Y ) = 1.. .M
where M is the largest value of y.
This is a set of M simultaneous equations in M
un-knowns, and hence leads to the evaluation of the C
aand of the system function G.
H. E. Singleton
-72-un Va(n)
(VII. COMMUNICATION RESEARCH)
8.
Short-Time Correlation Functions and Power Spectra
The use of short-time autocorrelation functions to represent speech sounds, brings
up the theoretical question of how such a representation is related to the spectrographic
representation which has been used in the past.
By properly defining the short-time autocorrelation function t(T) and power spectrum
Gt(w) it has been possible to obtain an extension of Wiener's theorem in the form
p(T) e2''
Gt(w) cos
cidT
-- 03:
Gt(w
)=
e-
t(T) cos WT dT
-oOA paper on this subject is to be published by the Journal of the Acoustical Society of
America.
A study has been made of the effectiveness of correlators in separating a periodic
signal from noise when the averaging process in the correlator is performed by means
of an RC filter. The results will be presented in a forthcoming paper.
R. M. Fano
9.
Speech Studies
a.
A short-time correlator for speech waves
Progress has been mainly in mechanical construction and assembly. The delay line
has been designed to occupy a 24-inch panel on a standard 19-inch rack. This panel
also contains the amplifiers associated with each filter section. The filter coils have
been wound and assembly of the components is now in progress.
Other completed work includes redesign and reconstruction of the carrier oscillator
and distribution panel, alignment of the product filter amplifiers and adjustment of the
switching circuit.
It should be possible shortly to obtain visual short-time correlation patterns
corre-sponding to the speech sounds spoken into a microphone.
111111111111111·
.r::/
Fig. VII-IO Fig. VII-II Fig. VII-13 -74-Fig. VII-12 Fig. Vll-14Fig. VII-15
(VII. COMMUNICATION RESEARCH)
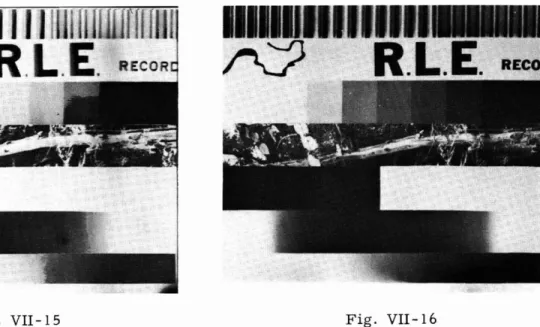
Fig. VII-16
Fig. VII-IO - Fig. VII-16 Original picture (Fig. VII-IO) was coded successively with an
increasing number of digits in test to determine the number of digits required.
10. Pulse-Coding of Picture Signals
Several tests have been made with the coding equipment. The three which gave the
most conclusive results were first, the determination of the number of density levels
required to transmit a high-q~ality picture; second, the amount and type of information
in each digit channel; and third, the necessary sampling rate for a given type picture. The running of these tests also brought to light the need for a precise, reproducible photographic process as well as the need for more suitable methods of quality determi-nation.
The first test was made by transmitting the same picture (Fig. VII-IO) eight times,
each time at a different level in the order 21, 22, 23, ... 28. The first six of these
pic-tures are shown in Figs. VII-II to VII-I6. The seventh and eighth were exactly like the
sixth indicating that between 48 and 64 levels were required to transmit a picture
con-taining gradual transitions from one density level to another. When the transitions were
less gradual, fewer levels were needed as evidenced by the picture of the tree which
appears as good at 16 levels as it does at 64. Since the average
lowest-perceptible-difference of the eye corresponds to about lout of 50 levels from black to white, any greater refinement than this would be of value only at brightness densities where the
actual lowest-perceptible-difference is smaller than the average. Hence unless there is
some additional integration in the equipment or in the photographic process it would seem
that 64 levels are adequate to transmit any type of picture over this system. The
I -J 0"-I Fig, VII-17 , 1', Fig. VII-I8
..
" Fig, VII-19,.
\\..
(VII. COMMUNICATION RESEARCH) ~~~~~"':::':N!~Pf'I"F'~!>i':7'C'("~-d;';!'*';'''~ "':;"~r ".,~ ~. ;. J ~l' ..~ II Fig. VII-22 Fig. VII-24 Fig. VII-23 Fig. VII-25
Fig. VII-I? - Fig. VII-25 Original picture (Fig. VII-I?) with black and white pictures
corresponding to the output of each of the 8-digit channels.
The second test consisted of making a series of black and white pictures
correspond-ing to the output of each of the eight digit channels. Fig. VII -1 ? is the original picture
used in this test. Each of the lines from the reader was successively used as the No. 8
(VII. COMMUNICATION RESEARCH)
being the most significant digit, provided sufficient drive to produce a black and white picture. Figures VII-18 to VII-25 indicate what torpe of information is carried by each digit, i.e. overall contrast, main detail, fine detail, etc. Conversely they show in what contrast range or ranges various elements of the pictures lie. If all the detail were found in the largest (No. 8) digit, then the picture would be a silhouette, or if it were found in digit No. 7, the picture would be considered "hard" or "contrasty. " Since this picture is "soft" the main details appear in digits Nos. 6 and 5. The overall contrast appears in digits 7 and 8, and the fine detail and shadings in 3 and 4. Digits 1 and 2 sist almost entirely of uniform gray dots and so add very little to the picture, thus con-firming the results of the first test.
The third test was made by varying the sampling rate from 400 to 1800 cycles in four steps. Fig. VII-10 was used so that bandwidth of 1 1/2 cycles for the strip containing the sinusoidal black-to-white variation to 200 cycles or more for the strip containing the tree would be available. The maximum bandwidth of the equipment was 600 cycles which theoreticall- required a 1200-cycle sampling rate. It was found that a sampling rate of 400 cycle wvas adequate to reproduce faithfully the picture of the tree as well as the re-maining strips which had lower bandwidths. The only noticeable difference between the pictures at the various rates was that noise effects were accentuated as the sampling frequency was decreased. Therefore it could be concluded that 600 cycles provides sufficient bandwidth for the exceptional picture, but that normally about 300 cycles is all that is needed, so that a sampling rate of 600 cycles would be sufficient. This can be further substantiated by the fact that though theoretically a 140-line/in definition would produce at the most a 900-cycle square wave (for the Times-Photo equipment), the maximum physically realizable square wave repetition rate as found in a chopper pattern is about 471 cycles. Such a pattern is seldom found in a normal picture. Since the pic-ture of the tree contains a more than average amount of fine detail it would seem reason-able to assume that normally a sampling frequency lower than 1200 cycles would be ade-quate in the interest of conserving bandwidth.
A standard photographic procedure was evolved to insure that errors in the received picture would be caused by the coding process alone. It consisted of calibrating the
re-ceiver output current in terms of the gray shades on the photographic paper used for reception. Then by comparing portions of the picture to be transmitted with the gray shades, the receiver and transmitter were adjusted to expose the paper properly. The proper development of the paper was insured by making use of a set of exposed, unde-veloped, step-tablet test strips, one of which was developed just prior to the print to
make certain that the developer was correctly mixed and at the right temperature. The quality of the received picture was measured with respect to density levels by means of a recording spectrophotometer and with respect to detail reproduction by means of oscilloscope waveforms. The first measurement permitted the transfer characteristic
-78-O.Iu f
I /Lf FROM CODERT
TO
E
TO
o7
ALL 6AS6 ... -- !0
ALL AU7's NE51
Fig. VII-26 Recording circuit
+150
27//z f
6ASI100
150 K 50K 50K IOK-150V
,uf--(VII. COMMUNICATION RESEARCH)
of the equipment to be made and discrepancies to be discerned. The second allowed cor-rections for the transient response of the system. While such measurements help to make certain that the equipment is properly adjusted as far as the link between the trans-mitter and the receiver is concerned, and can reveal what information can be left out in the coding process, such as the Ist and 2nd digits, they say little about the link between the picture and the observer. It is felt that as the study progresses of what type of in-formation can be left out of a picture, the development of adequate methods of making observer tests will be mandatory.
The actual circuits of the equipment and a description of their operation and limita-tions may be found in the thesis, "Transmission of Picture Signals by Pulse-Code" by E. H. Gibbons, M.I.T., 1950. J. B. Wiesner, E. H. Gibbons
11. Pulse-Code Magnetic Recorder
Because of the high inductance of the recording heads it was difficult to obtain a recording current waveform which would be independent of the pulse repetition rate and yet strong enough to secure a sufficient signal-to-noise ratio. To meet the requirements, the series connection of the recording coil halves was changed into a parallel one, there-by reducing the inductance there-by a factor of four; and a special recording circuit (shown in Fig. VII-26) was designed.
These modifications made it possible to obtain a pulse with a steep rise and an ex-ponential decay with a time constant of less than 8 sec so that, even at the highest pos-sible repetition rate of the system (i.e. 25 kc), no pulse can be affected appreciably by the preceding pulse. The peak current is about 5 ma which is quite sufficient since reliable playback has been obtained with a peak current of only 2 ma.
As an incidental result it was found that the playback voltage waveform does not de-pend very much upon the recording current. The playback waveforms do not differ from the ones shown in Fig. IX-18 and IX-19, pp. 66-67, Quarterly Progress Report, July 15,
1949, although those waveforms were produced by square pulses. Reduction in ampli-tude for frequencies above 10 kc occurred in both types of recording waveforms. The conclusion was that, at high frequencies, no region of zero magnetization exists between two successive pulses.
The timing, coding and recording circuits have been built in permanent form, and most of them have been tested. J. B. Wiesner, L. Dolansky
12. Twin-Track Recorder for Slow Phenomena
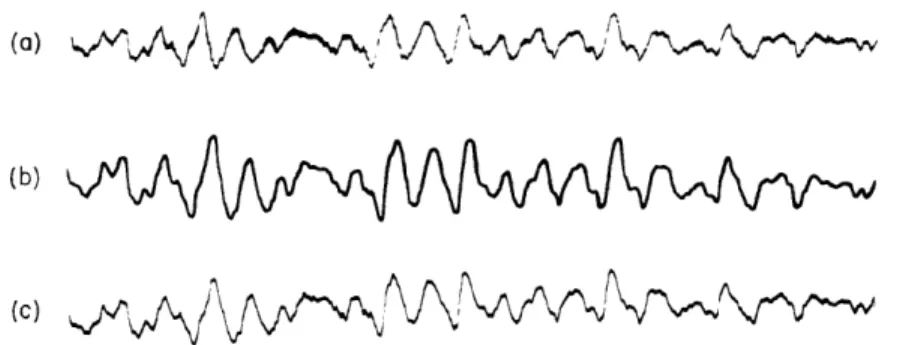
Tests of the recording system have been made using brainwave signals. Typical results are reproduced in Fig. VII-27, in which (a) represents the input signal, (b) the pen record made by conventional electroencephalographic equipment, and (c) the speeded-up playback from the tape recording system. The time duration of the traces is 2.25
-80-(VII. COMMUNICATION RESEARCH)
(b)
(C) ,,
Fig. VII-27 Performance of one channel of the recorder with a brainwave signal. (a) Electrical input to both pen recorder and tape recorder. (b) Record made by conventional pen recorder. (c) Playback from tape recorder.
seconds for (a) and (b), and 0. 45 seconds for (c). Details of the equipment will be given
in a later progress report. J. B. Wiesner, P. E. Green
C. HUMAN COMMUNICATION SYSTEMS*
Prof. A. Bavelas A. Simmel Prof. J. B. Wiesner F. L. Skinner R. P. Abelson S. L. Smith W. H. Huggins N. O. Sokal
L. Levine O. H. Straus
1. Human Communication Networks
The problem of an efficient group effort is an old one, and in the operation of a group, or team, the effective exchange of information is a critical factor. In many instances, it is quite clear that the quality of performance that may be expected from a team is de-termined primarily by the limitations of the communication net in which it operates. While many of these limitations are of the technical sort which traditionally concern the electrical engineer, there is a set of limiting factors which may be called psychological and which appear to derive from the pattern properties, or topology, of the existing com-munication net.
Criteria of "efficiency" of group performance include: (a) The speed and accuracy of performance of a given task. (b) The volume and distribution of messages within the network per unit task completed. (c) The adaptability of the group to changes of task. This includes the notions of "group learning. " (d) The emergence and stability of organi-zation, including the development of "leader-follower" relationships. (e) Individual and group morale of network members. Earlier work has shown that the above measures
(VII.
COMMUNICATION RESEARCH)
vary among different communication networks, all of which are logically adequate for
the successful completion of the given tasks.
Observed values of a set of measures such as these will be some function of (a) the
topology of the communication links in the network, (b) the location of the driving points,
where information is injected, and of the output points, where the results of the group
activity leave the network, (c) the nature and the variability of the assigned group task,
and (d) constraints placed upon the content of messages within the network.
Other
variables, such as the effect of given individual personalities in given positions in the
net, are of secondary interest for now, and their effects can be diminished by appropriate
statistical methods.
A. Bavelas
a.
Structure and function in human networks
The topological structure of a human network may be characterized by the number
of individuals in the net (roughly, junction points, or nodes) and the number and
arrange-ment of links connecting the nodes.
If each link is considered to be directional, and not
more than one link connects a node pair in a given direction, the set of all possible
topo-logical structures composed of N individuals can be described by an N X N matrix. The
non-diagonal elements are equal to zero wherever direct communication between node
pairs is made impossible by external constraints, such as one-way telephone lines,
instructions, or social custom.
The remaining non-diagonal elements, representing the
rate of message flow, are in general not equal; where nothing is known about the density
of message flow, the entries may be unity, and the matrix completely represents the
structure imposed by external constraints.
This corresponds to the usual notion of
organization of a group.
The number of such structures equals
2N(N-1)/ N! (removing
the N! duplications due to permutations of labelling the nodes), and this grows rapidly
as N increases. An attempt is being made to reduce this set to subsets which may show
common behavior.
The subset of networks being studied is that in which messages can get from any node
to any other node, including itself. This condition means that the consequences of any
message can potentially be felt by the originator of that message.
This seems to be a
useful and reasonably precise criterion for what is commonly meant by the term,
"mem-bership" in a group or organization.
It is equivalent to saying that among the "members"
of a human organization, the coupling between every node pair is significantly greater
than zero.
The whole net then forms a single feedback system.
In order to get a description that yields a determinate system, every new piece of
information, including ideas from the memory of its members, must be represented
explicitly as a driving function at a definite driving point.
The information flowing around
a task-oriented human network, after it has been operating for a little while, is, however,
of two sorts. "First-order information" can be defined as the original information, or
-82-(VII. COMMUNICATION RESEARCH)
the same thing after elements of the net have operated upon it. This is like target infor-mation in a servo-mechanism. "Second-order information" refers to information about the sequence of messages, or the channel over which they arrive, etc., irrespective of their immediate content. This is information about the functioning of the net itself, which induces the members to change their individual "transfer functions, " and hence the
over-all "transfer function, " or performance characteristic, of the total group. This comes close to an operationally meaningful definition of "group learning. " Second-order infor-mation corresponds to difference measurements and correction factors derived from them in a servo.
In order to describe in an orderly fashion the activity of a network, whose task, for instance, is the distribution or combination of information, the index notation for n-dimensional matrices is useful. Let the general element be Papy6' where a ranges over
the senders of the message,
p
over the receiver, y over the original input points of the information, and 6 over the contents of the information, which may be thought of as quantized. The matrix, P, represents the probabilities that a given message charac-terized by the subscripts will occur.Once formulated in this way, a new notion emerges. Not only what is usually called information, but also structure or organization, or topology, all appear in a single co-ordinate system. What is called organization is precisely those probability elements, or portions of them, which are predictable in advance of any actual input to drive the system. What is called information, is those elements which are not predictable in ad-vance. It is to be noted that this method provides for variable handling of messages depending on their content, the variable index 6.
A network system of this type using binary inputs, messages and outputs, consisting of electrical switches operated by human subjects, is under construction. The logical design is such as to allow testing of the notions presented here.
O. H. Straus
b. Electrical network analysis and human networks
Although it is recognized that human group behavior is transitory and nonlinear on the microscopic level, there is a possibility that linear methods may be used to study phenomena which involve so many events that the constituent processes may be defined adequately by their Markoff probabilities. When this is possible, the highly developed techniques of linear network theory are applicable and the interaction of the various mem-bers within the group may be expressed in terms of admittance and impedance functions. Furthermore, it is possible to express the stress patterns throughout the group in terms of a set of modes which are characteristic of the structure of the group. These suggest measures of the "coupling" between a member and the group as well as the tendency for
(VII. COMMUNICATION RESEARCH)
toward a reformulation of the problem on a microscopic, nonlinear basis using the
mathe-matics of game theory. This more concise formulation will then be used to determine
the conditions under which the treatment by linear methods is permissible when the
num-ber of subevents becomes large.
W. H. Huggins
c.
Communication in networks required to do collective reasoning
A series of experiments has dealt with the effect of communication networks upon
cer-tain aspects of group behavior.
A communication network can be best represented by a
picture constructed as follows: each individual is represented by a "cell,
"
or "node, "
and a directed arrow from cell x to cell y indicates a channel from cell x to cell y over
which some form of communication may proceed. The existence of a directed link from
x to y does not necessarily imply the existence of a link from y to x.
The absence of an
arrow originating at cell x and terminating at cell y indicates that individual x is unable
to contact individual y directly. Any such picture, or "topological complex,
"
of cells
and arrows represents some particular communication network.
When research on this subject began it was supposed that the communication network
imposed upon a group of people would tangibly affect their performance of experimental
tasks. This was found to be the case with group morale, speed, accuracy, and other
attributes for a group performing a task which involved the collection of simple
informa-tion at a central point. The present experiment dealt with an experimental task requiring
organizational and evaluative activity as well as information-collecting.
The problem posed to the group was that of hitting a numerical target by having each
member contribute some portion to the numerical total. The
o _a contributions were made with tokens of two colors; however,
the group was not told the numerical worth of each color.
o
After each shot on a target, the group numerical total was
announced,
and a new target was given.
Thus the
perform-CHAIN CIRCLE
ance of the task required first that the color code be broken,
and second that a leader be chosen who would assign proper numerical quotas to each
member so that the target could be hit.
Six five-man groups were tested in each of two different networks, the "chain" and
the "circle, " shown in the accompanying figure.
The members of the group
communi-cated with each other by means of written messages without constraint as to content.
A
preliminary analysis of the data yields a provocative result: All six of the groups with
the circular communication network broke the color code by agreeing that all members
would contribute only tokens of one color as a "test. " Only three of the six chain groups
did this, two of the remaining three relying on arithmetical calculations based upon how
many tokens of each color the members had sent, and one of them never breaking the
code at all. This result can be very neatly explained on the basis of certain mathematical
-84-(VII. COMMUNICATION RESEARCH)
models we have developed. In a chain, information tends to collect faster than in a cir-cle, but the circle allows for more rapid spread of information (and suggestions) than the chain. Broadly speaking, the circle is better adapted to simple planning, the chain better adapted to compiling information in order to decide thereby upon a course of action.
There are other suggestive indications of network differences in our data, but more important, we have recently devised a scheme of message analysis with many promising applications. This scheme divides messages into two classifications: "original" and "reactive. " All messages which stem from a thought initiated by someone else are con-sidered reactive, and all messages with no obvious prior referent are concon-sidered origi-nal. A "reactivity matrix, " R, can be constructed, where the element rij equals the number of messages by j which react to original messages by i, divided by the number of original messages by i. Over and above individual differences, this matrix seems to be a strong function of the network pattern; it is possible to regard it as a network impedance matrix. Given the input at each node, (the number of original messages) the matrix allows us to calculate the resulting reactive flow (current) of messages. Further analysis of data will be made. R. P. Abelson, A. Simmel
d. Pattern recognition
A study of the logical structure of pattern recognition, and its quantitative formula-tion in terms of probability funcformula-tions, is being attempted. Experimental equipment for testing the notions on human subjects has been constructed and is being used to collect
data. F. L. Skinner, O. H. Straus
2. Sensory Replacement
a. Guidance device for the blind
A study has been undertaken to determine how a guidance device for the blind can best present environmental information through one or more of the blind person's re-maining sensory channels, at a rate sufficient to allow him to walk confidently through environments of familiar type. Such a device collects and encodes information; its effi-ciency can be no greater than the ability of the user to decode the signals it presents.
Previous work on guidance devices (1, 2) was with sound or light beams projected from a device carried in the hand. A tone varying in pitch or pulse repetition rate indi-cated the range of objects as the device was directed, like a flashlight, point by point over the environment. This method of presentation required that the user integrate the point-by-point range signals over the spatial field, and in the time domain. The low rate at which information, thus coded, could be perceived, decoded, and integrated into a picture of the environment, was the bottleneck which limited the usefulness of the
(VII. COMMUNICATION RESEARCH)
previous devices.
This project is an attempt to break open the bottleneck by a better method of coding
and presenting information. Information is presented in the form of a relief map which
can be read with the fingertips, similar to the reading of Braille text. The map will be
constructed from an array of seventy pegs which can project through holes in a board;
a projecting peg indicates the presence of an obstacle; a retracted peg indicates a clear
area. At present, it is planned to map a
450
sector of the environment, to a range of 12
feet; the map scale will be 0. 150 inch
=1 foot, and the resolution will be one foot.
The
peg-board will be carried by the blind subject; for the present, the pegs will be actuated
by solenoids controlled through a cable by a human operator who will replace the
scan-ning device of a complete system.
As the subject moves in translation or rotation
through an obstacle course, the obstacles on the peg map will move correspondingly.
Continuous and simultaneous display of range and azimuth in a sector of the environment
will allow exploration of the sector by the fingertips, using both touch and finger position
sense in a manner similar to the normal activity of the eyes.
Equipment is under construction, and obstacle-course testing by blind subjects will
be made available through the co-operation of the Perkins Institution and the
Massachu-setts School for the Blind, Watertown, MassachuMassachu-setts.
N. O. Sokal, O. H. Straus
References
1.
Research on Guidance Devices for the Blind, a progress report prepared by the
Haskins Laboratories, New York, N. Y., for the Committee on Sensory Devices of
the National Academy of Sciences (Dec. 1, 1946).
2.
Research on Guidance Devices and Reading Machines for the Blind, a final report
by the same authors (Dec. 31,
1947).
b. Felix
Felix has had an operational shortcoming.
Whenever the subject's ability to receive
words varied substantially from one test to another, we could not ascertain to what degree
this was the fault of the subject or of the equipment.
We have now installed a monitoring circuit which makes a continuous record of the
word patterns received by the subject. The monitor consists of a trigger, relay, and
Esterline-Angus recording pen for each of the seven channels. When the voltage input
level in a channel exceeds a specified value (adjusted to correspond to the subject's
threshold of feeling for that channel), the trigger closes the relay. The relay, which
re-mains closed as long as the input to the trigger exceeds the threshold, controls a voltage
fed to the pen. We are thus able to obtain a seven-channel on-off pattern for each word.
By comparing this pattern with others of the same word, we will be able to measure the
relative degree of variability of the subject and the apparatus.
J. B. Wiesner, L. Levine, O. Straus
-86-(VII.
COMMUNICATION RESEARCH)
D. TRANSIENT PROBLEMS
Prof. E. A. Guillemin W. H. Kautz Dr. M. V. Cerrillo H. M. Lucal
L. Weinberg
1. Synthesis in the Time Domain Approach
An attempt is being made to find an adequate solution to the transient synthesis prob-lem which is concerned with the design of electrical networks for specified transient behavior. The solution is carried out in two steps; first, an approximation in which the given specifications are converted into a realizable "system-function" of a physical net-work; and second, the actual synthesis of the network from this system-function. The latter step can usually be carried out without excessive difficulty by means of one or more of a large number of synthesis methods available.
Various attempts to solve the more challenging approximation problem have met with little success except in isolated special cases. The problem is one of passing from a given, desired time response f(t) to a system-function of frequency F*(s) which is rational and meets certain other restrictions which depend upon the type of system de-sired. Two methods of attack are available. Either the given function f(t) may be Laplace-transformed immediately into F(s), and the approximation carried out in the s (frequency) domain to obtain F*(s); or, f(t) may be approximated by a sum of complex exponentials f*(t) of the proper type, which, when transformed, yield a realizable sys-tem-function F*(s). Each solution has numerous disadvantages; the principal difficulty in the first method is the almost complete lack of correlation between approximation errors in the s-domain and those in the t -domain; with the second method it is difficult to obtain expansions of f(t) which converge sufficiently rapidly to be useful for economi-cal approximations.
The technique of solution to be investigated is based on a single fact which is an out-growth of a long period of research on approximate theories of integration carried out in the Laboratory. Briefly, a definite correlation between the time and frequency domains has been found for a very large class of general and typical transients, each of which corresponds in the frequency domain to a particularly simple frequency function or "prototype transform. " The transition from f(t) to F*(s) may now be carried out by representing f(t) in terms of the appropriate generating function, g(t), which has a Laplace transform G(s), the prototype transform. G(s) is now approximated by the ra-tional system-function F*(s). It is anticipated that this division of the approximation problem into two smaller ones will permit a greater control over approximating errors, and will facilitate the introduction of those additional constraints on the time or frequency function which often accompany specific problems. In addition, the use of more powerful
(VII. COMMUNICATION RESEARCH)
and more rapidly convergent expansions is appropriate because of the fundamental and
simple character of the generating functions and their prototype transforms.
2.
Condensed Basic Aspects on the Problem of Integral Approximation
One basic task of this group is the investigation and development of methods of
ap-proximate integration of a class of integrals of the type
f(T71 ... , Tn) 1 F(s) eW(s, T1' T
n
ds (1)particularly the subclass associated with transient phenomena in electrical networks and
other linear systems.
Several methods have been investigated and developed.
They can be classified into
three basic groups: Open methods, Cliff methods and Pocket methods. This
classifi-cation is in accordance with the way in which the contour of integration, "y, encircles the
singularities or passes in their vicinity.
Other subclassification has been made depending on the method in which we
approxi-mate the function F(s), or W(s, T1, . . . , Tn) or both. These subclassifications are:
stationary phase, saddle point, extended saddle point, plain and mixed cliff, plain pocket,
essential and substitutional methods.
They are listed in the order of increasing
general-ity. The last method is by far the most complete theoretically. It has been found that
the substitutional method possesses powerful potentialities because it is a sort of
gener-alization of the preceding ones.
Investigation of this last method began about a year ago in a rather limited extent.
Even at that time extensive applications of the method were foreseen in connection with
the synthesis problem, and as a consequence considerable attention has been given to the
method during the last few months.
The basic ideas contained in this powerful method which will be investigated
thor-oughly in future work are outlined here in a condensed form.
We are all aware that the singularities of F(s) and W(s,
T1,...
,Tn), their branch
cuts, etc., have a canonical role in the genesis of the integral formation.
With certain
conditions on the contour -y, which type (1) may satisfy, it happens that the complete
integral contribution comes directly from the neighborhood of the singularities of the
integrand and along the banks of the cuts, around which we deform the contour of
inte-gration.
The theoretical experience with these integrals indicates that the net quantitative
effect of the singularities on the integral solution depends strongly on their nature and
more strongly still upon their relative position in the s-plane.
Because of the
relation-ship of the parameters, , .' . ., Tn and the functions in the integrand, it becomes clear
-88-(VII. COMMUNICATION RESEARCH)
that these parameters influence, in general, the position, or sometimes the nature, of the above-mentioned singularities.
In our integrals, the parameters T1, ... Tn possess a variable nature (independent,
of course, of s). When they change, the singularities of the integrand may move in the s-plane, changing their relative position, or sometimes their nature, and therefore changing their effect on the process of the integral formation.
We may naturally wonder if this motion of the singularities of the integrand as a func-tion of T1, ... "
n
can be exploited as a possible basic idea for a method of approximate integration. To illustrate this possibility we must describe the process in more precise terms.Suppose that we are interested in an approximate solution of an integral contained in class (1), which will be valid in a certain domain of variation of
71
, .. ., n, say G,.* When -71, ... -n vary in G,, the singularities of the integrand will, in general, move in the s-plane. They follow certain orbits with a definite law of motion, thus changing theirrelative position. It may happen that during relative motion a certain group of singulari-ties have, or may attain, an almost dominant quantitative control on the building up of the integral solution when
71'
. . . Tn are in Gv; while other singularities have, or mayattain, a small or secondary quantitative effect on the integral when T1'' ... Tn are in G,. Let us assume momentarily that this is the case.
The following notation is now convenient. Let T1, . . . TTn be in Gz. "Primary" singularities (in G,) are those which have a strong quantitative influence and "secondary" singularities (in Gv) are those which have a minor quantitative effect on the integral solution.
Now, let us follow the motion in the s-plane of the singularities of the integrand, with particular attention given to the primary ones. Let us trace in the s-plane the orbits and find their laws of motion**, in terms of T1 . . . . Tn , for each singularity.
The segments of the orbits, corresponding to the displacements of the primary sin-gularities for T1, .. . , T
n
in Gy, will occupy one or several regions of the s-plane, D,. The union of these s-plane regions will be denoted by DV. This situation clearly estab-lishes a certain correspondence (not necessarily one-to-one) between GY and one, or*We can think of G, as follows: the n-tuple of variable numbers (T, . .. , Tn) defines an n-dimensional vector space, say Rn, over the field of definition of the numbers
T1, T2, . .. , Tn . Hence Gj is a subdomain of Rn .
**The reader may have a clearer picture of this process if we particularize the general case by considering that T1, . . . -Tn are, for example, continuous functions of the real
variable t and set
Tk Tk(t); k = 1, ... , n
in the interval ta < t < tb(Gv is tb - ta) The above equations define a line immersed
-(VII. COMMUNICATION RESEARCH)
several regions of the s-plane, Dy.
The final wave shape produced by the contributions of the primary singularities
strongly depends upon the combined effect of every primary singularity. We may
there-fore look at them as a group rather than as isolated singularities.
This group
considera-tion is important particularly because: (a) For a given set and disposiconsidera-tion of primary
singularities, the relative displacement of one of them may cause, and this is often the
case, a considerable change of the wave shape of the integral solution. (b) In some cases
we can replace the group by some other analytical entities* of simpler structure whose
effect with regard to the integral solution is equivalent or almost equivalent, and vice
versa. These entities sometimes define points in the s-plane which also move as
func-tions of T1, ... , Tn'
We will agree that when at least one of the primary singularities of a given group
drops to a secondary rank, or as soon as at least one new singularity rises to the
pri-mary rank, then the given group must be considered as a different one.
Past experience with the approximate integration of a large subclass of integrals of
type (1) has revealed and confirmed:
(a) The reality of the primary and secondary singularities associated with a given
domain G,, of variation of T, . .. ,
n'
(b) The raising or lowering in rank of certain singularities in different domains,
say G and Gv+
n(c) The decisive influence on the wave form of the primary singularities when
they are considered as a group rather than in their individual roles.
(d) A basic structural composition of the primary group. For example, the
improper modification of the group elements, say, by cancellation of one or several
sin-gularities, alteration of orbits or laws of motion, may produce an incorrect integral
approximation.
In the light of all these observations, the following two questions arose.
Let Fe*(s)
and W*(s, T1, . . , Tn) be two functions which satisfy the requisites: (a) They approximate respectively F(s) and W(s, 1, ... , T n), i.e.
F*(s) ~ F(s)
s E D
W*(s, Tl
....
T n) NW(s, T1, Tn) TkGz; k =l, ... , n(b) The functions F*(s) and W(s, T1, . . . Tn) contain the primary singularities
(or corresponding analytical entities) respectively of F(s) and W(s, T1, ... , Tn) for TkEG,;