HAL Id: hal-00371435
https://hal.archives-ouvertes.fr/hal-00371435
Submitted on 27 Mar 2009
HAL is a multi-disciplinary open access
archive for the deposit and dissemination of
sci-entific research documents, whether they are
pub-lished or not. The documents may come from
teaching and research institutions in France or
abroad, or from public or private research centers.
L’archive ouverte pluridisciplinaire HAL, est
destinée au dépôt et à la diffusion de documents
scientifiques de niveau recherche, publiés ou non,
émanant des établissements d’enseignement et de
recherche français ou étrangers, des laboratoires
publics ou privés.
compounds : A3BFe3D2O14 with A=Ba, Sr, Ca, B=Ta,
Nb, Sb and D=Ge, Si
Karol Marty, Pierre Bordet, Virginie Simonet, Mickael Loire, Rafik Ballou,
Céline Darie, Jakob Kljun, Pierre Bonville, Olivier Isnard, Pascal Lejay, et al.
To cite this version:
Karol Marty, Pierre Bordet, Virginie Simonet, Mickael Loire, Rafik Ballou, et al.. Magnetic and
dielectric properties in the langasite-type compounds : A3BFe3D2O14 with A=Ba, Sr, Ca, B=Ta,
Nb, Sb and D=Ge, Si. Physical Review B: Condensed Matter and Materials Physics (1998-2015),
American Physical Society, 2010, 81 (5), pp.054416. �10.1103/PHYSREVB.81.054416�. �hal-00371435�
with A=Ba, Sr, Ca, B=Ta, Nb, Sb and D=Ge, Si
K. Marty,1 P. Bordet,1, ∗ V. Simonet,1 M. Loire,1 R. Ballou,1 C. Darie,1 J.
Kljun,1 P. Bonville,2 O. Isnard,1 P. Lejay,1 B. Zawilski,1 and C. Simon3
1
Institut NEEL
CNRS & UJF, BP 166, 38042 Grenoble Cedex 9, France
2
CEA-Saclay, IRAMIS/Service de Physique de l’Etat Condens´e, 91191 Gif-sur-Yvette, France
3
Laboratoire CRISMAT, UMR CNRS ENSICAEN, 1450 Caen, France (Dated: March 27, 2009)
The Fe-based langasites are the first reported compounds presenting a magnetic ordering in this rich family, besides being well known for piezo-electric properties and optical activity. The struc-tural, magnetic and dielectric properties of the Fe langasite compounds, with various substitution of non-magnetic cations, have been studied with x-ray and neutron diffraction, magnetostatic mea-surements, M¨ossbauer spectroscopy, and dielectric measurements. The title compounds (trigonal, space group P 321) display a helical magnetic order with signatures of frustration below TN ≈24-35 K where an anomaly of the dielectric permittivity is observed. The influence of the cationic substitutions and the nature of the magnetoelectric coupling is hereafter addressed.
PACS numbers: 75.25.+z, 71.27.+a
Keywords: magnetic frustration, helical magnetic order, langasite, dielectric properties
I. INTRODUCTION
Multifunctional materials, in which coexist different physical properties (optical activity, laser properties, piezo- and/or ferroelectricity, ferroelasticity, magnetic or-dering, etc), are the subject of an intense research effort owing to their strong potential for various industrial ap-plications. To date, the basic mechanisms at the origin of the coupling between these properties inside a single compound are still poorly understood. Experimental re-alizations of such materials are rare, and this is particu-larly the case in the field of multiferroics, i.e. compounds which display both ferroelectric and magnetic ordering1.
Proper multiferroics are defined as ferroelectric com-pounds which undergo a magnetic ordering at lower tem-perature, as for example BiFeO32. In these compounds,
there is a large temperature gap between the ferroelec-tric and magnetic transition, and the coupling between the two properties is generally weak. For improper mul-tiferroics (for example TbMn2O53), the electric
polar-ization is induced by the onset of a complex magnetic order within a paraelectric and generally centrosymmet-ric phase. Such materials therefore present a naturally strong coupling between magnetization and electric po-larizations thus giving the opportunity to study the mi-croscopic mechanisms driving such couplings.
The langasite family, the prototype of which is La3Ga5SiO14, has been widely studied for the
strik-ing piezoelectric and non-linear optical properties of its members4,5,6,7, related to the non-centrosymmetric
na-ture of its Ca3Ga2Ge4O14 structure type8. These
com-pounds have generated a strong interest for applications in bulk acoustic waves (BAW) and surface acoustic waves (SAW) devices, as well as in non-linear optics and electro-optics4,9,10.
The langasite structure belongs to the trigonal
non-centrosymmetric P 321 space group. The general formula is A3BC3D2O14, thus containing four different cationic
sites. The decahedral A site and the octahedral B site form a layer at z=0, while the two tetrahedral sites C and D are located on the plane z=1/2 (see Figure 1)4,15.
Due to its atomic arrangement, this structure type is able to accommodate a large number of different cations with various sizes and valences, leading to a wide va-riety of isostructural compounds4,11,13. Among these,
some contain magnetic cation sublattices. Therefore, this
FIG. 1: Polyhedral representation of the langasite structure with its four different cation sites on two layers.
family might provide interesting examples of coexisting magnetic order and optical or electrical properties. Re-cently, we have undertaken the general investigation of the magnetic langasites14. In this article, we present
the study of the magnetic and dielectric properties of several Fe-containing langasite compounds with formula A3BFe3D2O14, with A=Ba, Sr, Ca, B=Ta, Nb, Sb and
D=Ge, Si.
II. EXPERIMENTAL
A. Synthesis and structural characterization
Powder samples were synthesized by solid state reac-tions. The initial components of the powder mixtures were high purity oxides or carbonates in stoichiometric quantity. The mixtures were ground, compacted and heated up to 1150 - 1250˚C in Al2O3 crucibles in air
for 7 hours. The pellets were heated at a rate rang-ing from 200˚C/h to 300˚C/h. The samples contain-ing GeO2 were kept at 1000˚C for 2h before reaching
the final temperature to prevent the loss of the relatively volatile germanium oxide. The synthesis conditions were chosen taking into account some properties of the ini-tial and final compounds, such as the decomposition of the carbonates, the oxidation of Sb2O3, the fusion
tem-peratures of GeO2, SrO and of the final product. The
products were analyzed with x-ray diffraction using a D8 Brucker diffractometer in transmission geometry with the CuKα1 radiation, to check the presence of possible impu-rities. As some of the products showed minor impurities (max. 3 %), they were ground, compacted again and an-nealed for 10-50h, up to three times in order to decrease the impurity content.
Rietveld refinements with the program Fullprof17were
carried out on the final products diffractogramms. In all cases, the expected stoichiometry and the full occupation
TABLE I: Refined structural parameters obtained from x-ray powder diffraction on BNFS with a D8 Brucker diffrac-tometer. a. d. p. is the atomic displacement parameter. The agreement factor of the fit is given by RBragg = 3.2 ;
Rwp= 27.0 ; χ2= 1.5 .
Atom Wyckoff x y z a.d.p. Ba 3e 0.4339(2) 0 0 1.04(1) Sb 1a 0 0 0 0.9(1) Fe 3f 0.7513(6) 0 1/2 0.9(1) Si 2d 1/3 2/3 0.459(3) 0.4(3) O1 2d 2/3 1/3 0.774(6) 1.4(3) O2 6g 0.477(3) 0.300(2) 0.649(3) 1.4(3) O3 6g 0.209(2) 0.098(2) 0.236(3) 1.4(3) a = 8.5227(2) ˚A c = 5.2353(1) ˚A
TABLE II: Structural parameters and agreement factors of Fe-langasites as refined from x-ray powder diffraction data at room temperature with a D8 Brucker diffractometer.
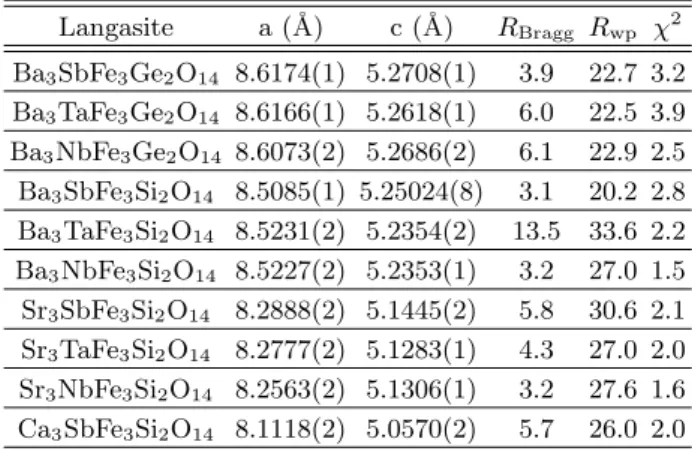
Langasite a (˚A) c (˚A) RBragg Rwp χ2 Ba3SbFe3Ge2O14 8.6174(1) 5.2708(1) 3.9 22.7 3.2 Ba3TaFe3Ge2O14 8.6166(1) 5.2618(1) 6.0 22.5 3.9 Ba3NbFe3Ge2O14 8.6073(2) 5.2686(2) 6.1 22.9 2.5 Ba3SbFe3Si2O14 8.5085(1) 5.25024(8) 3.1 20.2 2.8 Ba3TaFe3Si2O14 8.5231(2) 5.2354(2) 13.5 33.6 2.2 Ba3NbFe3Si2O14 8.5227(2) 5.2353(1) 3.2 27.0 1.5 Sr3SbFe3Si2O14 8.2888(2) 5.1445(2) 5.8 30.6 2.1 Sr3TaFe3Si2O14 8.2777(2) 5.1283(1) 4.3 27.0 2.0 Sr3NbFe3Si2O14 8.2563(2) 5.1306(1) 3.2 27.6 1.6 Ca3SbFe3Si2O14 8.1118(2) 5.0570(2) 5.7 26.0 2.0
of all sites was found, without any sign of intersite substi-tution. As an example, the results for Ba3NbFe3Si2O14
(hereafter referred to as BNFS) are reported in Table I. Table II summarizes the principal structural parameters for the investigated samples.
Single crystals of Ba3NbFe3Si2O14 and
Ba3TaFe3Si2O14 (BTFS) were grown by the
floating-zone method in a Cyberstar image furnace, under a 99% Ar + 1% O2 atmosphere, at a growth rate of
10 mm/h18. This technique has the advantage of being
fast and exempt of contamination from a crucible. The single crystals were cut out of the grown ingot with a size roughly of 3 mm in diameter and 8 mm in length for the neutron diffraction measurements. The crystal-lographic quality were checked by La¨ue photographs. No impurity phase could be detected by x-ray powder diffraction of crushed crystal pieces. A small crystal piece of each compound was used for single crystal x-ray diffraction analysis using a Kappa ApexII Bruker diffractometer equipped with graphite monochromatized AgKα radiation. This confirmed the crystal quality and the langasite type structure and allowed to determine the handedness of each of these chiral crystals by use of anomalous scattering sensitivity.
FIG. 2: Magnetic network of Fe3+cations projected along the
c-axis (left), with the different intra-plane (left) or inter-plane (right) exchange paths (dashed lines).
In all the compounds under study, the magnetic Fe3+
cations form a peculiar array of triangles on a triangular lattice, in the plane at z=1/2 (figure 2). Two consecu-tive planes are separated from each others by a layer of A2+ and B5+ cations. The Fe3+triangles are equilateral
by symmetry. The distance between the Fe3+ cations
is 3.662(8) ˚A for BNFS. Two equivalent super-exchange interactions J1 between two nearest neighbor magnetic cations on one triangle are each mediated via an O3 an-ion. The Fe-O3-Fe angle 100.1(9)˚and the Fe-O3 dis-tances are 1.73(2) and 2.93(2) ˚A for BNFS. One Fe3+
cation of a triangle interacts with four neighbors in the nearest triangles within the plane by the super-super-exchange paths J2 through two O2 anions forming an edge of a DO4 tetrahedron (figures 1 and 2). The Fe-O2-O2 angles are 144(1)˚and 140(1)˚, and the Fe-Fe-O2-O2 and O2-O2 distances are respectively 1.93(2) and 2.59(4) ˚A in BNFS. The shortest distance between two Fe3+ cations
from neighbouring planes is the c parameter (5.2353(1) ˚
A), with also two O2 oxygens in the exchange path form-ing an edge of the BO6octahedron. But one needs to
dis-tinguish three different inter-plane interactions, each one with multiple possible super-super-exchange paths. J4 is the interaction between a Fe3+cation and the cation just
above or below in the adjacent plane, while J3 and J5 are the diagonal interactions between this Fe3+ cation and
the two other Fe3+ cations of the neighbouring triangle
(figure 2). It is worth noticing that due to the struc-tural chirality, J3 and J5 are obtained through different exchange paths and expected not to be equal.
B. Magnetization measurements
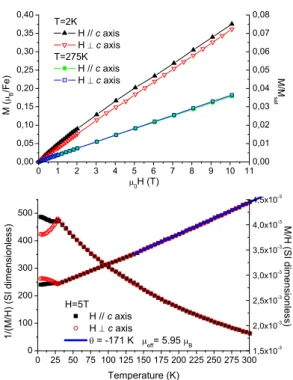
The magnetostatic properties of BNFS and BTFS sin-gle crystals and of all the powder title compounds were investigated under magnetic fields up to 5 T in the tem-perature range from 2 K to 300 K with a commercial Quantum Design MPMS SQUID magnetometer, and up to 10 T from 1.6 K to 300 K with a purpose-built mag-netometer using the anti-Helmholtz two-coil axial extrac-tion method. Figure 3 illustrates for BNFS the thermal evolution of the magnetization divided by the magnetic field (i.e. equal to the linear susceptibility χ for tem-peratures greater than ≈ 26 K), and of its inverse, mea-sured under a magnetic field of 5 T applied both per-pendicular to the c-axis and parallel to it. A cusp in the M/H measurements suggested the onset of a mag-netic transition at 26 K, further corroborated by a sharp peak in the specific heat19. Above this temperature, no
significant anisotropy is observed within the accuracy of the measurements, which is expected for Fe3+ions
with-out orbital contribution. Below the magnetic transition, whereas M/H is almost constant for H parallel to the c axis, the in-plane susceptibility drops, although not to zero as would be the case for a canonical antiferromag-netic transition. This implies a more complex magantiferromag-netic arrangement. This is also illustrated on the
magneti-zation curves M (H) shown on figure 3. At high tem-perature (275 K), the magnetization is the same for the two orientations of the applied field. On the contrary, at low temperature (2 K), an anisotropy of the magne-tostatic properties comes out: the magnetization mea-sured with an applied field parallel to the c axis is no longer linear and shows a slight curvature at small fields. This curvature would indicate the rise of a small compo-nent along the c axis. At high temperatures (150 K to 300 K), a linear fit of the inverse of M/H yields, in a Curie-Weiss model χ = C/(T − θ), an effective moment µeff = gpS(S + 1)=5.95 µB, compatible with the value
of the Fe3+ free ion (3d5, J=5/2, µ
eff=5.92 µB, Msat=5
µB), and a negative Curie-Weiss temperature of -171 K,
characteristic of antiferromagnetic interactions.
The magnetic behavior of a BTFS crystal was found essentially similar to that of BNFS, and this was also the case for all the investigated compounds prepared as powders : all of them undergo an antiferromagnetic or-dering transition in the 24-35 K range. As an example, the magnetic susceptibility for the Ba3SbFe3Si2O14
pow-der compound is shown in Figure 4 where the magnetic transition is clearly visible at TN=35 K. The values of
TN, θ and Fe3+magnetic effective moments obtained in a
Curie-Weiss fit of the inverse magnetic susceptibilities are
0 1 2 3 4 5 6 7 8 9 10 11 0,00 0,05 0,10 0,15 0,20 0,25 0,30 0,35 0,40 M /M sa t M ( B /F e ) 0 H (T) T=2K H // c axis H c axis T=275K H // c axis H c axis 0,00 0,01 0,02 0,03 0,04 0,05 0,06 0,07 0,08 0 25 50 75100125150175200225250275300 0 100 200 300 400 500 M /H ( S I d im e n sio n le ss) 1 /( M /H) ( S I d im e n sio n le ss) Temperature (K) H=5T H // c axis H c axis = -171 K eff = 5.95 B 1,5x10 -3 2,0x10 -3 2,5x10 -3 3,0x10 -3 3,5x10 -3 4,0x10 -3 4,5x10 -3
FIG. 3: Magnetization measurements on a Ba3NbFe3Si2O14
single crystal under a magnetic field applied parallel and per-pendicular to the c-axis. Top: Magnetic isotherms at 2 K and 275 K. Bottom: Thermal variation of the M/H and its inverse under an applied magnetic field of 5 T. The continuous line represents the linear fit of H/M in a Curie-Weiss model.
0 30 60 90 120 150 180 210 240 270 300 0,002 0,003 0,004 0,005 0,006 0,007 0,008 0,009 M /H ( S I d im e n sio n le ss) Temperature (K) Ba 3 SbFe 3 Si 2 O 14 H = 0.1T
FIG. 4: Thermal variation of the M/H of a powder sample of Ba3SbFe3Si2O14under an applied magnetic field of 0.1 T.
TABLE III: Magnetic parameters obtained from magnetiza-tion measurements of Fe-langasites: N´eel temperatures and Curie-Weiss temperatures. Langasite TN (K) θ (K) Ba3NbFe3Si2O14 26 -173 Ba3NbFe3Ge2O14 24 -177 Ba3TaFe3Si2O14 28 -160 Ba3TaFe3Ge2O14 24 -165 Ba3SbFe3Si2O14 35 -114 Ba3SbFe3Ge2O14 34 -111 Sr3NbFe3Si2O14 26 -242 Sr3SbFe3Si2O14 36 -128
summarized in Table III. All compounds, whatever the cations on sites A, B and D, present a N´eel temperature around 25 K, except those containing Sb5+ cations on
site B. These latter display a magnetic transition around 35 K, and at the same time a noticeably smaller abso-lute value of the Curie-Weiss temperature. In order to understand the microscopic origin of this difference, and more generally to further our understanding of the mag-netic order in these compounds, microscopic probes such as neutron scattering and M¨ossbauer spectroscopy were used.
C. Neutron diffraction study
Neutron powder diffraction (NPD) measurements were performed at the Institut La¨ue Langevin on samples of the compounds Ba3NbFe3Si2O14 (BNFS),
Ba3SbFe3Si2O14 (BSFS), Sr3NbFe3Si2O14 (SNFS) and
Sr3SbFe3Si2O14 (SSFS) using the D1B instrument
(λ=2.52 ˚A). These four compounds were chosen in order to track, via the structural and magnetic arrangements determination, the influence of large cell parameter vari-ation (Sr versus Ba) and the microscopic origin of the dif-ferent transition temperatures (Nb versus Sb). A BNFS
TABLE IV: Refined lattice parameters, magnetic moment value, overall isotropic atomic displacement parameter, z-component of the propagation vector and goodness of the fit parameters obtained from neutron powder diffraction data of Fe-langasites at 1.8 K (1.5 K for BNFS) on D1B.
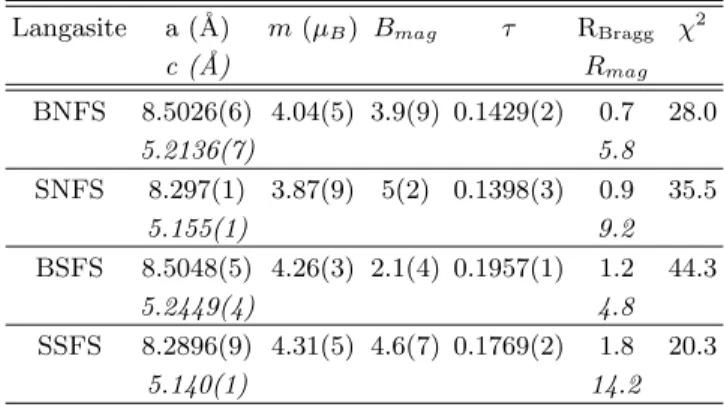
Langasite a (˚A) m (µB) Bmag τ RBragg χ2
c (˚A) Rmag BNFS 8.5026(6) 4.04(5) 3.9(9) 0.1429(2) 0.7 28.0 5.2136(7) 5.8 SNFS 8.297(1) 3.87(9) 5(2) 0.1398(3) 0.9 35.5 5.155(1) 9.2 BSFS 8.5048(5) 4.26(3) 2.1(4) 0.1957(1) 1.2 44.3 5.2449(4) 4.8 SSFS 8.2896(9) 4.31(5) 4.6(7) 0.1769(2) 1.8 20.3 5.140(1) 14.2
single crystal was also studied on the D15 diffractometer of the Institut La¨ue Langevin (λ=1.1743 ˚A). The ther-mal evolution of the diffraction patterns were measured on D1B using an orange cryostat by increasing the tem-perature at a rate of 0.42 K/min with 75 scans of 10 minutes each. In order to obtain sufficient statistics at 30 K (above the magnetic transition), 20 K (below the magnetic transition) 1.8 K (for BSFS, SNFS and SSFS) and 1.5 K (the lowest reachable temperature, for BNFS), 6 scans of 20 minutes were summed at each tempera-ture. The magnetic structure was solved from refine-ment of the D15 and D1B diffractograms measured on BNFS19,20. The magnetic structures of the three other
compounds were refined using the same ordering scheme (see figure 5). The magnetic peaks could be indexed us-ing an incommensurate propagation vector (0, 0, τ ), with τ ranging from 0.14 for SNFS to 0.19 for BSFS, and the magnetic structure was found to be a helical spin arrange-ment propagating along the c axis from equal moarrange-ments lying in the (a,b) plane at 120˚from each other within each triangle (see figure 6). This 120˚arrangement re-sults from the usual compromise of frustrated Heisenberg spins on a triangle-based lattice. All spins rotate around c by ±2πτ between to consecutive Fe3+layers. It is worth
noting that a helical magnetic order often results either from the presence of frustration of interactions in the helix direction28, or from Dzyaloshinskii-Moriya
interac-tions in a ferromagnetic structure29. In the present case,
it was shown that the helical stucture is generated by the twist in the magnetic super-super-exchange paths from plane to plane. Furthermore, the in-plane 120˚magnetic arrangement and the helical propagation both possess a definite sense of rotation defined as chirality, which is re-lated to the structural chirality. A thorough investigation of this interesting aspect has been previously reported in ref. 20 and will not be discussed further here.
The main results of the NPD refinements carried out for the four samples at 1.8 K are summarized in Table IV.
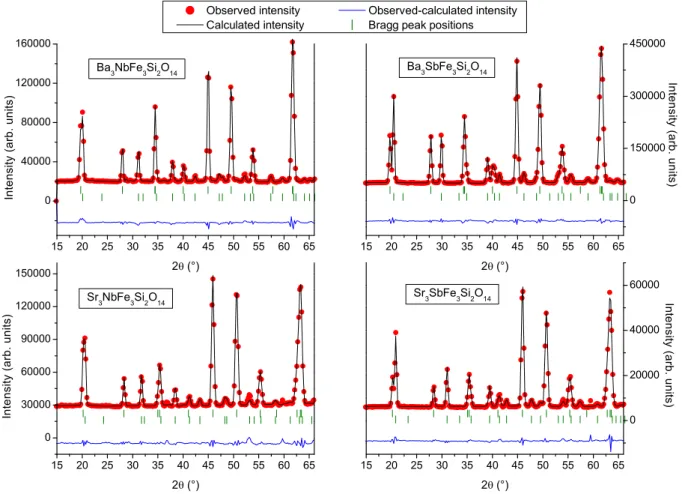
15 20 25 30 35 40 45 50 55 60 65 0 40000 80000 120000 160000 I n t e n s i t y ( a r b . u n i t s ) 2 (°) Ba 3 NbFe 3 Si 2 O 14 15 20 25 30 35 40 45 50 55 60 65 0 150000 300000 450000 I n t e n s i t y ( a r b . u n i t s ) 2 (°) Ba 3 SbFe 3 Si 2 O 14 15 20 25 30 35 40 45 50 55 60 65 0 30000 60000 90000 120000 150000 I n t e n s i t y ( a r b . u n i t s ) 2 (°) Sr 3 NbFe 3 Si 2 O 14 15 20 25 30 35 40 45 50 55 60 65 0 20000 40000 60000 I n t e n s i t y ( a r b . u n i t s )
Observ ed intensity Observ ed-calculated intensity
Calculated intensity Bragg peak positions
2 (°) Sr 3 SbFe 3 Si 2 O 14
FIG. 5: Rietveld plot for Ba3NbFe3Si2O14 (top left), Ba3SbFe3Si2O14 (top right), Sr3NbFe3Si2O14 (bottom left) and
Sr3SbFe3Si2O14 (bottom right) neutron powder data at 1.8 K (1.5 K for BNFS) from D1B, including nuclear and magnetic
phases.
The magnetic moment values are close to 4 µB and they
are smaller for Nb compounds than for Sb ones. This is markedly smaller than the expected value for a sat-urated Fe3+ magnetic moment (5 µ
B). An explanation
for this behavior could be the strongly covalent nature of the Fe-O bonds for Fe3+ cations in tetrahedral
coordi-nation, which is known23 to favor spin transfer towards
the oxygen orbitals and therefore decrease the apparent magnetic moment on the Fe3+ cations. Indeed, in
or-der to obtain accurate refinements of the NPD data, we had to introduce an ad-hoc ”magnetic Debye-Waller fac-tor”, similar to an overall isotropic atomic displacement term. The refined values of the corresponding Bmag
pa-rameters are given in Table IV. The effect of this term can be viewed qualitatively as a modification of the mag-netic form factor with increased spin density at larger distances from the center of the electron cloud, as would be expected in the presence of spin transfer to the oxy-gen orbitals. Another qualitative information is given by the diffractograms measured at temperatures up to 20 K above the magnetic transition, where some diffuse scat-tering centered on the first nuclear peak is visible. This signal is characteristic of the onset of short range
mag-netic correlations in the (a, b) planes. The width of the signal decreases, i.e. the correlation length of this short-range order increases, down to the magnetic transition where it disappears at the expense of the magnetic Bragg peaks characteristic of the 3-dimensional long-range or-der (see figure 7).
As seen in Table IV, the τ values of the antimony com-pounds are higher (between 0.177 and 0.196) than those of the niobium compounds (around 0.14). The τ val-ues appear also slightly larger for the barium compounds than for the strontium ones, especially in the Sb com-pounds. However, the τ values are much less sensitive to the Sr/Ba substitution than to the Sb/Nb one, although the former have a much larger effect on the lattice param-eter due to the big difference of their ionic radius (1.56 ˚
A for Ba versus 1.4 ˚A for Sr). After examination of the refined structures of the four compounds, and especially focusing on the lengths and bonds angle of the magnetic exchange paths, no systematic trends could be extracted from the data that would explain the peculiarity of the Sb based compounds magnetic properties on pure struc-tural grounds. The influence of the Sb cation in the Fe-langasites is therefore more probably ascribable to the ion
FIG. 6: Magnetic structure of the Fe-langasites: within each triangle of the (a,b) plane, the Fe3+ magnetic moments are
rotated by 2π/3 from each other. The global phase factor, which cannot be determined by neutron diffraction, was arbi-trary chosen equal to zero in this representation (one moment pointing towards the center of the triangles). Along the c-axis, the helix propagates with a period of 1/τ in cell unit.
15 20 25 30 35 40 45 50 55 20000 40000 60000 80000 100000 120000 In te n sity ( a r b . u n its) 2 (°) Ba 3 NbFe 3 Si 2 O 14 1.5 K 30 K
FIG. 7: Powder neutron diffraction patterns of the compound Ba3NbFe3Si2O14, below the magnetic transition, at 1.5 K,
and above the magnetic transition, at 30 K.
electronic state than to induced structural distortion. We will come back to this aspect in the discussion.
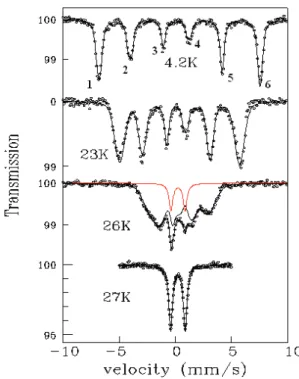
D. M¨ossbauer measurements
M¨ossbauer absorption spectra on the isotope57Fe (E 0
= 14.4 keV) were recorded for the BNFS compound at room temperature and in the temperature range 4.2 to 30 K, in zero external magnetic field (see figure 8). At 27 K and above, the spectrum consists of a quadrupolar hyper-fine doublet characteristic of the paramagnetic phase. At 27 K, the isomer shift with respect to the α-Fe reference is δ = 0.35(1) mm/s (1 mm/s corresponds to 11 MHz) and the quadrupolar hyperfine splitting is ∆EQ= |eQVZZ| /2
= 1.29(1) mm/s, where Q is the quadrupole moment of the nuclear excited state and VZZis the principal
compo-FIG. 8: 57Fe M¨ossbauer absorption spectra in
Ba3NbFe3Si2O14 at selected temperatures. The spectra
at 4.2, 23 and 26 K (circles) are fitted (black lines) to the helical magnetic structure model determined by neutron scattering. At 26 K, a quadrupolar subspectrum contribution (represented in red) overlapping the magnetic signal suggests that the magnetic transition is first order.
nent of the electric field gradient (EFG) tensor at the57Fe
nucleus site. These values are typical of a Fe3+ ion,
al-though the ∆EQvalue is somewhat larger than generally
found in ferric insulators, indicating a strongly distorted Fe site, compared to a perfect tetrahedral environment, in agreement with crystal analysis. The point symmetry at the Fe site is low (a two-fold axis along the crystal a axis), and thus the directions of the EFG tensor axes can-not be determined from symmetry considerations alone. Below 27 K, a magnetic hyperfine structure appears, with 6-line characteristic spectra showing the presence of a magnetic hyperfine field acting on the nuclear mo-ment. This is the fingerprint of a long range magnetic order. The 4.2 K spectrum (see figure 8) corresponds to a single saturated hyperfine field Hhf = 440(2) kOe;
considering the hyperfine proportionality constant typi-cal for Fe3+insulators of 110 kOe/µ
B, this yields a unique
Fe3+magnetic moment value of 4 µ
B, in agreement with
the neutron derived value. Close inspection of the 4.2 K spectrum reveals slight inhomogeneous line broadenings, most clearly seen when comparing the widths of the two central lines (labelled 3 and 4 in figure 8) and of the two intermediate lines (2 and 5). This spectral effect is due to a distribution of one or more hyperfine parameters. The magnetic structure determined by neutron diffraction be-ing an incommensurate transverse spiral with
propaga-tion vector along c, then the angle between the hyperfine field, proportional to the Fe3+ moment, and the
princi-pal axis OZ of the EFG tensor, linked to the crystal axes, shows a distribution. The second order shifts of the hy-perfine energies due to the quadrupolar coupling then lead to a broadening which is different for each line12.
The line fits in the magnetic phase in Fig.8 were per-formed using this model, the key parameter determining the size of the broadenings being the angle Θ between OZ and the propagation vector, which is found to be Θ ≃ 36◦. On heating, the lines become broader and
the overall magnetic splitting decreases, indicating that the mean hyperfine field decreases and that a distribu-tion in hyperfine field values appears. The broadenings are significant near TN (see the spectra at 23 and 26 K
in figure 8). At 26 K, a small intensity paramagnetic doublet (13% relative weight) is present together with the magnetic order spectrum. This coexistence of para-magnetic and para-magnetically ordered regions near TN is
usually associated with a certain degree of first order for the magnetic transition. At 27 K, the sample as a whole is paramagnetic.
E. High resolution X-ray diffraction
The remarkable magnetic properties of the Fe-langasites underlined in the previous sections may also have consequences on their dielectric behaviour. Indeed, the non-centrosymetric P 321 space group symmetry of the langasites does not allow the existence of an elec-tric polarization. However, we have established that the Fe-langasite compounds undergo a transition towards a magnetic helical order whose symmetries are compatible with ferroelectricity: preservation of the 3-fold axis and loss of the 2-fold axes. It is therefore interesting to deter-mine whether a structural phase transition and a lowering of symmetry authorizing a ferroelectric order appear in the temperature region of the magnetic transition. The D1B data have not revealed any such modification in
FIG. 9: Rietveld plot for Ba3SbFe3Si2O14x-ray powder data
at 250 K from ID31; RBragg = 2.58, Rwp= 23.4, χ2 = 3.6.
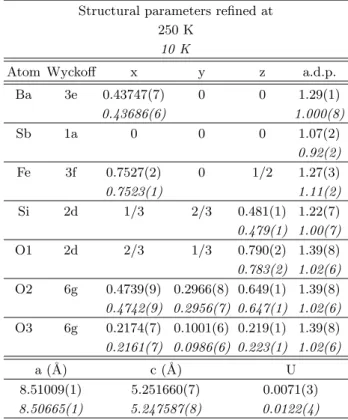
TABLE V: Refined structural parameters obtained from high resolution x-ray powder diffraction on BSFS on ID31, at 250 K (RBragg= 2.58 ; Rwp= 23.4 ; χ2= 3.6) and 10 K (RBragg=
2.35 ; Rwp= 22.0 ; χ2= 0.95). a.d.p. and U are respectively
the atomic displacement parameter and the quadratic term of the Gaussian peak width.
Structural parameters refined at 250 K
10 K
Atom Wyckoff x y z a.d.p. Ba 3e 0.43747(7) 0 0 1.29(1) 0.43686(6) 1.000(8) Sb 1a 0 0 0 1.07(2) 0.92(2) Fe 3f 0.7527(2) 0 1/2 1.27(3) 0.7523(1) 1.11(2) Si 2d 1/3 2/3 0.481(1) 1.22(7) 0.479(1) 1.00(7) O1 2d 2/3 1/3 0.790(2) 1.39(8) 0.783(2) 1.02(6) O2 6g 0.4739(9) 0.2966(8) 0.649(1) 1.39(8) 0.4742(9) 0.2956(7) 0.647(1) 1.02(6) O3 6g 0.2174(7) 0.1001(6) 0.219(1) 1.39(8) 0.2161(7) 0.0986(6) 0.223(1) 1.02(6) a (˚A) c (˚A) U 8.51009(1) 5.251660(7) 0.0071(3) 8.50665(1) 5.247587(8) 0.0122(4)
the four samples studied. However the limited Q-range and spatial resolution make this instrument moderately suitable for the detection of subtle structural anomalies. In order to follow the structure as function of tempera-ture with a much higher sensitivity, we have used high resolution synchrotron powder diffraction at the ID31 beam line of the ESRF, equipped with a Ge(111) multi-analyzer stage. This experiment was performed on the Ba3SbFe3Si2O14compound. The sample contained in a 1
mm diameter quartz capillary was placed inside a helium flow horizontal cryostat allowing sample rotation. Data collections were carried out in the range 2θ=5˚to 35˚at 26 temperatures between 250 K and 10 K at an incident energy of 30 keV (λ=0.39816(2) ˚A). The diffractograms were analyzed by Rietveld refinement using the Full-prof program. The background was interpolated and the Bragg reflection shapes were described using a Thomson-Cox-Hastings profile function and a uniaxial description of anisotropic peak broadening about the [001] direction. All positional parameters in the P 321 space group de-scription were refined, and all atoms were given isotropic atomic displacement parameters (a.d.p.), those of all oxy-gen atoms being constrained to be equal. The Rietveld plot for the 250 K data refinement is shown in figure 9.
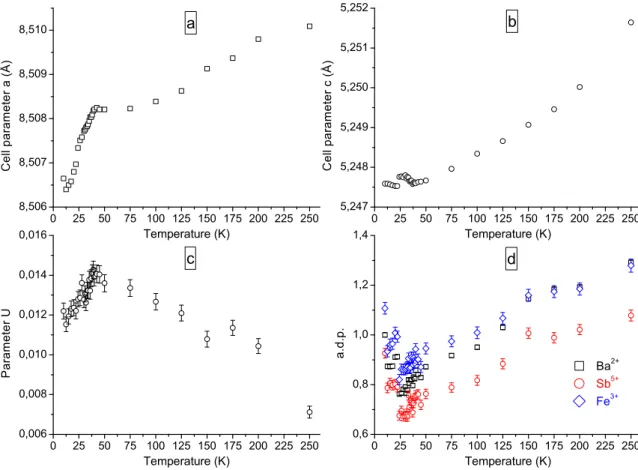
0 25 50 75 100 125 150 175 200 225 250 8,506 8,507 8,508 8,509 8,510 a C e l l p a r a m e t e r a ( Å ) Temperature (K) 0 25 50 75 100 125 150 175 200 225 250 5,247 5,248 5,249 5,250 5,251 5,252 b C e l l p a r a m e t e r c ( Å ) Temperature (K) 0 25 50 75 100 125 150 175 200 225 250 0,006 0,008 0,010 0,012 0,014 0,016 c P a r a m e t e r U Temperature (K) 0 25 50 75 100 125 150 175 200 225 250 0,6 0,8 1,0 1,2 1,4 Ba 2+ Sb 5+ Fe 3+ a . d . p . Temperature (K) d
FIG. 10: Thermal variation of some refined parameters from ID31 x-ray powder diffraction data on Ba3SbFe3Si2O14: a) cell
parameter a (˚A). b) cell parameter c (˚A). c) quadratic term U of the Gaussian peak width function. d) a.d.p.’s of Ba2+, Sb5+
and Fe3+cations.
The refined parameters at 250 K and 10 K are given in table V and do not exhibit any anomalous difference, the only marked variations being the expected cell con-traction and the decrease of the a.d.p.’s with tempera-ture. Figure 10 a, b, c and d display the temperature evolution of the cell parameters, quadratic term U of the Gaussian peak width function, and a.d.p.’s of the cations. An obvious anomaly is detected in the a-parameter vari-ation below 35 K (i.e. the magnetic ordering transition temperature for this compound). However the ampli-tude of the anomaly is quite small since the cell parame-ter change between 40 K and 10 K is only about 0.0015 ˚
A. The U parameter depends on the instrumental reso-lution (which does not vary with temperature) and the presence of strain in the sample. This parameter, related to Gaussian strain, increases on cooling and then starts decreasing below about 40 K. This could be related to the building up of strain in the compound followed by a relaxation at lower temperature due to a structural reor-ganisation associated to a phase transition. In this con-text, the increase of the cation isotropic a.d.p.’s could be due to the accommodation of atomic displacements associated to this structural transition.
If a structural phase transition coupled to the onset
of magnetic order was present, then the symmetry of the low temperature phase should keep the three-fold axis and loose the two-fold axis. The expected symme-try would then be P 3, which allows an electric polar-ization. In this space group, the silicon and each of the oxygen sites are split into two positions. Refinements of the 10 K synchrotron data with the P 3 symmetry were attempted, but did not lead to conclusive results. How-ever, the departure from the P 321 symmetry may be very small leading to hardly detectable atomic displacements. As a conclusion, the results of this temperature depen-dent high resolution structural study might indicate the presence of a structural phase transition coupled to the onset of magnetic order. Single crystal x-ray diffraction experiments are underway to determine the nature of the low temperature phase.
F. Dielectric measurements
In order to test the possible influence of the magnetic ordering on the dielectric properties of Fe-langasites, di-electric measurements were performed at the N´eel Insti-tute by measuring the complex impedance of our samples
using a commercial HP 4284A LCR-meter. The purpose-built experimental setup consists of a sample holder pro-tected by a dewar for a direct immersion in liquid helium of an helium container. Four coaxial cables linked to the electronic devices allow the complex impedance measure-ment. A model of capacitor and resistance in parallel was selected to extract the dielectric permittivity constant proportionnal to the capacitance of the sample, designed to approach the ideal geometry of a parallel plate capac-itor. The metallic electrodes are realized by sputtering with a silver target. Systematic check of the amplitude and frequency dependence were undertaken to establish the better conditions of measurements ruling out extrin-sic effects. The chosen conditions were finally an am-plitude voltage of 1V and a frequency within the range of 10-100 kHz. The measurements under magnetic field were performed at the CRISMAT laboratory, with a sim-ilar experimental setup designed to work in a commercial Quantum Design PPMS and allowing to reach magnetic fields of 9 T.
The powder samples of BNFS, BTFS and BSFS were prepared by pressing thin pellets which were annealed at 1100˚C during 78 hours. Single crystal samples of BNFS and BTFS were oriented and cut within the rods obtained in the image furnace in order to have two differ-ent oridiffer-entations for the applied electric field: along the c axis and along the a* axis.
The thermal variation of the dielectric permittivity constant of all the powder samples shows a small cusp near the temperature associated with the magnetic tran-sition (24 K for BNFS and BTFS, 30 K for BSFS). This cusp is a contribution from the dielectric permittivity within the (a,b) plane. It is indeed clearly visible in the single crystal samples with the electric field applied along the a* axis (also reported in ref.32), while it is absent
for the other orientation perpendicular to the (a,b) plane which only shows a broad variation at higher temper-ature without any slope discontinuity (see figure 11 for BNFS). For a powder sample (see BSFS measurement on figure 12), the observed cusp is obviously smaller than for a single crystal, as crystallites of every orientation, even
10 15 20 25 30 1,845 1,850 1,855 Ba 3 NbFe 3 Si 2 O 14 E c axis f=100 kHz E l e c t r i c c a p a c i t y ( 1 0 -1 2 F ) Temperature (K) 5 10 15 20 25 30 5,025 5,050 5,075 5,100 Ba 3 NbFe 3 Si 2 O 14 E // c axis f=100kHz Temperature (K) E l e c t r i c c a p a c i t y ( 1 0 -1 2 F )
FIG. 11: Thermal variation of the electric capacity (propor-tional to the dielectric permittivity) of BNFS single crystal for an electric field applied perpendicular to the c axis (left) and parallel to it (right).
0 10 20 30 40 50 5,18 5,20 5,22 5,24 5,26 E le ctr ic ca p a city ( 1 0 -1 2 F ) Temperature (K) powder Ba 3 SbFe 3 Si 2 O 14 f=30 kHz
FIG. 12: Thermal variation of the electric capacity (propor-tional to the dielectric permittivity) of a pellet of BSFS pow-der. The red line is a linear extrapolation of the data above 30 K, shown to emphasize the cusp.
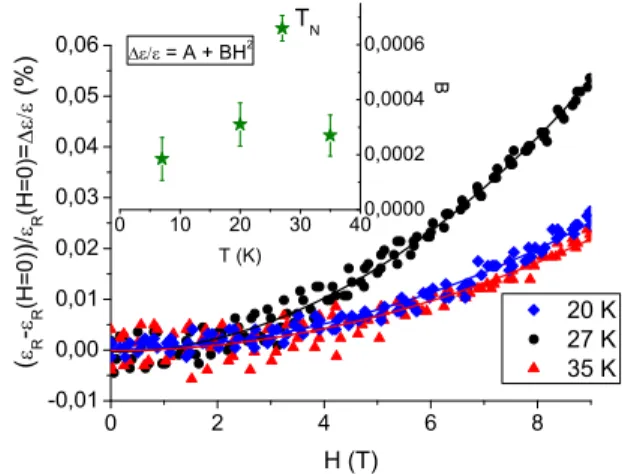
0 2 4 6 8 -0,01 0,00 0,01 0,02 0,03 0,04 0,05 0,06 0 10 20 30 40 0,0000 0,0002 0,0004 0,0006 20 K 27 K 35 K ( R -R ( H = 0 ) ) / R ( H = 0 ) = ( % ) H (T) B T (K) = A + BH 2 T N
FIG. 13: Magnetic dependance of the relative variation of the BNFS single crystal dielectric permittivity, for several temperatures. Both magnetic and electric fields are applied perpendicular to the c axis. The lines are parabolic fits. The inset shows the quadratic coefficient versus temperature.
those not presenting this effect, contribute to the signal. The variation of the relative increase of the dielectric permittivity as a function of the magnetic field applied in the direction of the electric field, perpendicular to the c axis, is illustrated for different temperatures by the fig-ure 13. It shows mainly a quadratic dependence with the field. As the dielectric permittivity is the second partial derivative of the free energy with respect to the electric field, the magneto-electric coupling terms measured here correspond to the terms of second order in electric field within the free energy development:
−1 2ǫ0ǫijEiEj− 1 2γijkEiEjHk− 1 2ηijklEiEjHkHl− ... The results obtained for the Fe-langasite means that only ηijkl contributes to the measured magneto-electric
present in the free energy development, as it is of second order in both electric and magnetic field, so no particu-lar symmetry conditions determine its existence, unlike for γijk. This quadratic coefficient however varies with
the temperature, being maximum close to the N´eel tem-perature. This variation reflects the critical behavior of the magneto-electric effect describable in the frame of the fluctuation-dissipation theory31. Other magneto-electric
coupling terms are accessible when measuring the mag-netic dependence of the electric polarisation (which is the first partial derivative of the free energy with respect to the electric field). Such experiments are underway.
III. DISCUSSION A. Magnetic properties
Our investigations of the Fe-langasites magnetic properties have revealed an original magnetic order at low temperature associated to the triangular array of triangles of magnetic Fe3+. The magnetic moments are
orientated at 120˚from each other within the triangles and propagate helically perpendicular to the triangular planes. There are at least two energy scales in this sys-tem since the intra-triangle super-exchange is expected to be much stronger than the in-plane and out-of-plane inter-triangle interactions which are mediated by two oxygens. The Curie-Weiss temperature mainly reflects this intra-triangle interaction which also gives rise to magnetic fluctuations above the ordering temperature (see figure 7). The Curie-Weiss temperature is larger than the N´eel temperature by almost an order of magnitude. The 3 dimensional ordering sets in when the temperature becomes of the order of the super-super exchange paths within the planes and between them. We have previously shown20 that this helical arrangement
results from a twist of the interplane interaction: the strongest interaction among the three that link one Fe3+
of a triangle to the three Fe3+ of the triangle of the
next plane is diagonal (J3 or J5). If, moreover, the two other interactions are zero, it is easily shown that the z-component of the propagation vector would be exactly τ =1/6=0.167, i.e. a rotation of the moments of 60˚from plane to plane20. The departure of the propagation
vector from 1/6 arises when the two other inter-plane interactions are no more negligible.
In the present study, we have focused on the effect on the magnetic properties of different non-magnetic cations on sites A, B and D. The most striking result is that all the magnetic characteristics are roughly identical for all compounds even when the substitution produces a large variation of the cell parameters, except for those con-taining Sb (in place of Nb or Ta). The presence of this cation systematically increases the N´eel temperature, de-creases the Curie-Weiss one, inde-creases the value of the ordered magnetic moment, and increases the τ value (i.
e. shortens the helical modulation period). The origin of this effect could be structural, the Sb5+ radius
be-ing slightly smaller than the Ta5+ or Nb5+ ones.
How-ever, no systematic trend on exchange path geometry was revealed by the structural investigation performed with powder neutron scattering on chosen compounds. The microscopic mechanism at play should therefore be of electronic origin. It could be related to the larger Paul-ing electronegativity of Sb5+(2.05) with respect to Nb5+
(1.6) and Ta5+(1.5)30. The departure of this value from
the oxygen electronegativity (3.44) gives the degree of ionicity/covalency and polarisation of the cation-oxygen bond involved in the magnetic exchange paths. This should therefore give a more covalent character to the Sb-O bond. The electronic structure of the Sb5+ cation
is also different from the Nb/Ta ones (different column of the periodic table) with in particular a full outermost 4d shell.
Remembering that two consecutive Fe3+ triangles
along the c axis are coupled via oxygen anions forming the octahedral coordination of the D site cation (see fig-ure 2), it is not surprising that a change of the electronic affinities of this cation has consequences onto the mag-netic coupling within and between the planes. For in-stance, the increased covalence of the Sb-O bond seems in turn to decrease the strength of the J1 Fe-O-Fe bond involving the same oxygen ions. The consequence of this is the observed lowering of the Curie-Weiss temperature and smaller spin transfer from the Fe3+ to the oxygen
(hence a larger ordered moment).
The influence of the electronic properties of Sb on the N´eel temperature and on the helix propagation vector is more difficult to track since it implies more complicated exchange paths between two planes. It is however in-teresting to note that the angle of rotation of the spin is larger than 60˚for Sb compounds and smaller than 60˚for the Nb/Ta ones. This implies a contribution of the two weaker interplane interactions, whose ratio would be inverted between Sb compounds and Nb/Ta ones.
B. Dielectric properties
It is of course of interest to address the question of the influence of this increased Sb-O bond covalence on the dielectric properties of the Fe-langasites. The dielec-tric measurements on all powder samples have not shown significant difference though, with a similar cusp of the dielectric permittivity close to TN, suggesting the same
kind of magneto-electric coupling for the different com-pounds. This comparative study will be carried on with electric polarisation measurements.
The dielectric properties reported here for the Fe-langasites are strikingly similar to those of YMnO3. The
magnetic structure of this compound presents some re-semblance with the Fe-langasite one : a triangular array of in-plane magnetic moments oriented at 120˚from each other in the ordered phase. The dielectric measurements
performed on this multiferroic compound show a com-parable anomaly in the thermal variation of the (a,b) in-plane dielectric permittivity while nothing is visible for the dielectric permittivity measured along the c axis, and a quadratic dependence of the dielectric permittivity close to this anomaly with the magnetic field (note how-ever that in the YMnO3study, the magnetic field was
ori-ented perpendicular to the electric one). This anisotropic dielectric behaviour of YMnO3 has been described in a
phenomenological Landau description of ferroelectric an-tiferromagnets including a fluctuative part31. Unlike the
langasites, YMnO3 is already ferroelectric at
tempera-tures well above the magnetic transition (proper multifer-roic). Anyway, the magnetic ordering still induces an ad-ditional contribution to the overall electric polarisation. The rise of electric polarisation at the N´eel temperature has also been claimed very recently in the Fe-langasite by Zhou et. al.32 from polarization measurements
per-formed along the c-axis. This would imply that, at vari-ance with YMnO3, these langasite compounds should be
classified as improper multiferroics, the magnetic transi-tion driving a paraelectric-ferroelectric transitransi-tion. Such behaviour has already been reported in another com-pound containing an Fe triangular lattice where the elec-tric polarisation is induced at the N´eel transition in the c direction along the axis of the helix and perpendicular to the plane of the moments oriented at 120˚from each other33.
IV. CONCLUSION
The Fe Langasites are the first compounds of this fam-ily to evidence a magnetic ordering whose peculiar
ar-rangement reflects magnetic frustration and the chirality of the structure. This rich family offers several Fe-based compounds with different cationic substitutions among which we have highlighted the singular role of the Sb cation on the magnetic properties. The langasite struc-ture is non-centrosymmetric and a further loss of symme-try elements is achieved in the magnetic structure that leave an overall polar structure authorising the appear-ance of a spontaneous electric polarisation. This would then be associated to a structural phase transition as suggested by high resolution x-ray diffraction. Dielec-tric measurements reveal the presence of magneto-elecDielec-tric coupling through an anomaly at the N´eel temperature in the thermal variation of the dielectric permittivity and its quadratic dependance with the magnetic field. The Fe-langasite could then be a new example enlarging the class of magnetoelectric/multiferroic triangle-based anti-ferromagnets.
Acknowledgments
This work has benefited from the financial support of the ANR contract BLAN06-1 140756. We would like to thank J. Marcus, J. Debray and B. Kundys for their help during the dielectric measurements, and E. Ressouche for his contribution to the single crystal neutron diffraction experiment.
∗ Electronic address: pierre.bordet@grenoble.cnrs.fr 1 N. A. Hill, J. Phys. Chem. B104, 6694 (2000).
2 I., T. Peterlin-Neumaier and E Steichele,J. Phys. C: Solid
State Phys. 15, 4835 (1982)
3 N. Hur, S. Park, P. A. Sharma, J. S. Ahn, S. Guha and
S-W. Cheong, Nature 349, 392 (2004)
4 B. V. Mill and Y. V. Pisarevsky, Proc. 2000 IEEE Int.
Freq. Contr. Symp., 133 (2000).
5 J. Bohm, R. B. Heimann, M. Hengst, R. Roewer, and J.
Schindler, J. Crystal Growth 204, 128 (1999).
6 J. Sato, H. takeda, H. Morikoshi, K. Shimamura, P.
Rudolph, and T. Fukuda, J. Crystal Growth 191, 746 (1998).
7 T. Iwataki, H. Ohsato, K. Tanaka, H. Morikoshi, J. Sato,
and K. Kawasaki, J. Eur. Ceram. Soc. 21 1409 (2001).
8 B. V. Mill, A. V. Butashin, G. G. Kodzhabagyan, E. L.
Belokoneva, and N. V. Belov, Dokl. Akad. Nauk. SSSR 264, 1395 (1982).
9 J. Stade, L. Bohaty, M. Hengst, and R. B. Heimann, Cryst.
Res. Technol. 37, 1113 (2002).
10 Y. Xin, W. Jiyang, Z. Huaijin, Z. Shaojun, H. Rongjiang,
and C. Tingxiou, Jpn. J. Appl. Phys. 41, 7419 (2002).
11 W. Eysel, U. Lambert, B. E. Mayer, and C. Renkenberger,
Zeitschrift f¨ur Kristallographie 201, 135 (1992).
12 D. Lebeugle, D. Colson, A. Forget, M. Viret, P. Bonville,
J.F. Marucco, S. Fusil, Phys.Rev.B 76, 024116 (2007)
13 B. V. Mill, E. L. Belokoneva, and T. Fukuda, Russian J.
Inorg. Chem. 43, 1168 (1998).
14 P. Bordet, I. Gelard, K. Marty, A. Ibanez, J. Robert, V.
Si-monet, B. Canals, R. Ballou, and P. Lejay, J. Phys. Cond. Mat. 18, 5147 (2006).
15 B. A. Maksimov, V. N. Molchanov, B. V. Mill, E. L.
Be-lokoneva, M. K. Rabadanov, A. A. Pugacheva, Y. V. Pis-arevsky, and V. I. Simonov, Crystallography Reports 50, 751 (2005).
16 K. Tezuka, K. Henmi, and Y. Hinatsu, J. Solid State Chem.
154, 591 (2000).
17 J. Rodriguez-Carvajal, Physica B192, 55 (1993). 18 P. Lejay et al in preparation (2009).
19 K. Marty, V. Simonet, P. Bordet, R. Ballou, P. Lejay, O.
Isnard, E. Ressouche, F. Bourdarot and P. Bonville, to be published in J. Magn. Magn. Mat. (2009).
20 K. Marty, V. Simonet, E. Ressouche, R. Ballou, P. Lejay
21 I. E. Dzyaloshinskii, Sov. Phys. JETP, 19, 960 (1964). 22 F. Tasset, Physica B, 156-157, 627 (1989).
23 V. C. Rakhecha and N. S. Satya Murthy, J. Phys. C: Solid
State Phys., 11 (1978).
24 S. V. Maleyev, Phys. Rev. Lett., 75, 4682 (1995). 25 E. F. Bertaut, J. Phys. Chem. Solids, 21, 256 (1961). 26 B. Coqblin, The Electronic Structure of Rare-Earth Metals
and Alloys: the Magnetic Heavy Rare-Earths, Academic Press ed., 122-126 (1977).
27 E. Ressouche, Introduction to Physical Techniques in
Molecular Magnetism-YESA, (1999).
28 A. Yoshimori, J. of the Phys. Soc. of Japan 14, 807 (1959).
29 I. Dzyaloshinskii, Zh. Eksp. Teor. Fiz. 46, 1420 (1964). 30 Dunmin Lin, K. W. Kwok, K. H. Lam, and H. L. W. Chan,
J. Phys. D: Appl. Phys., 40, 3500 (2007).
31 A. A. Nugroho, N. Bellido, U. Adem, G. N´enert, Ch.
Si-mon, M. O. Tjia, M. Mostovoy, and T. T. M. Palstra, Phys. Rev. B 75, 174435 (2007).
32 H. D. Zhou, L. L. Lumata, P. L. Kuhns, A. P. Reyes, E. S.
Choi, N. S. Dalal, J. Lu, Y. J. Jo, L. Balicas, J. S. Brooks, and C. R. Wiebe, Chem. Mater., 21, 156-159 (2009).
33 M. Kenzelmann, G. Lawes and A. B. Harris, et al., Phys.