HAL Id: hal-00375581
https://hal-paris1.archives-ouvertes.fr/hal-00375581
Submitted on 15 Apr 2009
HAL is a multi-disciplinary open access
archive for the deposit and dissemination of
sci-entific research documents, whether they are
pub-lished or not. The documents may come from
teaching and research institutions in France or
abroad, or from public or private research centers.
L’archive ouverte pluridisciplinaire HAL, est
destinée au dépôt et à la diffusion de documents
scientifiques de niveau recherche, publiés ou non,
émanant des établissements d’enseignement et de
recherche français ou étrangers, des laboratoires
publics ou privés.
Clustering in Fisher Discriminative Subspaces
Charles Bouveyron, Camille Brunet
To cite this version:
Charles Bouveyron, Camille Brunet. Clustering in Fisher Discriminative Subspaces. 13th
Interna-tional Conference on Applied Stochastic Models and Data Analysis (ASMDA 2009), Jun 2009, Vilnius,
Lithuania. (elec. proc). �hal-00375581�
Charles Bouveyron1 and Camille Brunet2
1
SAMOS-MATISSE, CES, UMR CNRS 8174, University Paris 1
90 rue de Tolbiac, F-75013 Paris (e-mail: [email protected])
2
IBISC TADIB, FRE CNRS 3190, University Evry Val d’Essonne
Bvd F. Mitterand, F-91025 Evry (e-mail: [email protected])
Abstract. Clustering in high-dimensional spaces is nowadays a recurrent problem
in many scientific domains but remains a difficult problem. This is mainly due to the fact that high-dimensional data usually live in low-dimensional subspaces hid-den in the original space. This paper presents a model-based clustering approach which models the data in a discriminative subspace with an intrinsic dimension lower than the dimension of the original space. An estimation algorithm, called Fisher-EM algorithm, is proposed for estimating both the mixture parameters and the discriminative subspace. Experiments show that the proposed approach out-performs existing clustering methods and provides a useful representation of the high-dimensional data.
Keywords: Model-based clustering, dimension reduction, discriminative subspaces,
latent mixture model.
1
Introduction
In many scientific domains, the measured observations are nowadays high-dimensional and clustering such data is a challenging problem. Indeed, the most popular clustering methods are based on the Gaussian mixture model and show a disappointing behavior in high-dimensional spaces. They suf-fer from the well-known curse of dimensionality [1] which is mainly due in clustering to the specificities of high-dimensional data. On the one hand, high-dimensional data have intrinsic dimension lower than the dimension of the original space and, on the other hand, they can be noisy.
Since the dimension of observed data is usually higher than its intrinsic dimension, it is theoretical possible to reduce the dimension of the origi-nal space without loosing any information. Therefore, dimension reduction methods are traditionally used before the clustering step. Feature extraction methods such as Principal Component Analysis (PCA) [2] or feature selec-tion methods (see [3] for a review) are very popular. However, these methods of dimension reduction do not consider the classification task and provide a sub-optimal data representation for the clustering step. Only few approaches combine dimension reduction and classification. Fisher Discriminant Analy-sis (FDA) (see Chap. 4 of [4]) is one of them in the supervised classification framework. FDA is a powerful tool for finding the subspace which best dis-criminates the groups and reveals the structure of the data. This subspace is
2 Bouveyron et al.
spanned by the discriminative axes which maximize the ratio of the between class variance and the within class variance.
This work proposes a method which adapts traditional procedures of clus-tering based on the Gaussian Mixture Model (GMM) for modeling and classi-fying data in discriminative subspaces. The approach proposed in this paper has three main objectives: firstly, it aims to improve clustering performances with the use of discriminative subspaces, secondly, it avoids estimation prob-lems linked to high dimensions and, finally, it provides a low-dimensional discriminative representation of the data.
2
Model-based clustering in discriminative subspaces
The main idea of our approach is that real data live in a latent subspace with an intrinsic dimension lower than the dimension of the observed data and that a subspace of K − 1 dimensions is theoretically sufficient to dis-criminate K groups. We therefore propose to model and classify the data in a discriminative subspace with K − 1 dimensions. The proposed approach will thus provide an optimal partition of the data as well as a discriminative representation of the partition.
2.1 The latent mixture model
Clustering aims to divide a given dataset of n observations {y1, . . . , yn} into
Khomogeneous groups (see [5] for a review). In this work, the observed data {y1, . . . , yn} ∈ Rp are assumed to be a linear transformation of latent (non
observed) data {x1, . . . , xn} ∈ Rd:
y= x V + ǫ,
where x ∈ Rd, y ∈ Rp, d < p, V is the d × p transformation matrix and
ǫ∈ Rp is a noise term. Popular clustering techniques use Gaussian Mixture
Models (GMM), which assume that each class is represented by a Gaussian probability density. Let us therefore assume that the data {x1, . . . , xn} are
independent realizations of a random vector X ∈ Rd with density function f :
f(x) =
K
X
k=1
πkφ(x, θk),
where K is the number of clusters, φ is the Gaussian density function param-eterized by θk= (µk, Σk), and πk, µk and Σk are respectively the proportion,
2.2 Estimation procedure: the Fisher-EM algorithm
The parameters of a mixture model are usually estimated by the maximum likelihood method through the iterative Expectation-Maximization (EM) al-gorithm [6]. Since, in this work, the data are not modelled in the space of observed data but in a latent subspace of dimension d < p, the estimation procedure has to be modified to take into account these specificities. Due to the nature of the model described above, the estimate procedure alternates between three steps: an E-step in which posterior probabilities of each ob-servation are computed, a F-step which estimates the inverse transformation conditionally to the posterior probabilities and a M-step in which parame-ters of the mixture model described in the latent subspace of dimension d are determined by maximizing the conditional likelihood. This estimation procedure, called hereafter Fisher-EM algorithm, has the following form: E-step: This step computes, at each iteration (q), the posterior probabili-ties tik that an observation belongs to the kth component of the mixture (in
the subspace of dimension d):
t(q)ik = π (q−1) k φ(xi, θ(q−1)k ) PK k=1πk(q−1)φ(xi, θ (q−1) k ) ,
where φ is the Gaussian density, and π(q−1)k and θ(q−1)k are the parameters of the kth mixture component estimated in the latent subspace at the previous iteration.
F-step: At the iteration (q), this step computes the discriminative axes, so-called Fisher axes, by estimating the inverse transformation conditionally to the posterior probabilities tik. These axes are determined by maximizing the
ratio of the between-class variance and the within-class variance. According to the Huygens’ theorem, this optimization problem resumes to:
maxu utB(q)u utSu , where S = 1 n Pn
i=1(yi− m)t(yi− m) and m = n1Pni=1yi are respectively the
covariance matrix and the mean of the observed data, and:
B(q)(tik) = 1 n K X k=1 n(q)k (m(q)k − m)t(m(q) k − m), n(q)k = N X i=1 t(q)ik , m (q) k = 1 N N X i=1 t(q)ik yi .
The solutions of this optimization problem are the eigenvectors associated to the K − 1 largest eigenvalues of the matrix S−1B(q).
4 Bouveyron et al.
M-step: This step estimates the parameters of the mixture model by max-imizing the conditional likelihood: the prior probabilities πk, the means µk
and the covariance matrix Σkof the K components in the space of the Fisher
discriminative axes: µ(q+1)k = PN i=1t (q) ik x (q) i PN i=1t (q) ik , π(q+1)k = PN i=1t (q) ik N Σk(q+1)= PN i=1t (q) ik (x (q) i − µk)t(x (q) i − µk) PN i=1t (q) ik ,
with x(q)i = y U(q)where U(q)is the p×d inverse transformation matrix which
contains the eigenvectors associated with the d largest eigenvalues of S−1B(q).
Traditionally, such an estimation approach on high-dimensional data yields to problems for estimating the mixture model parameters. Conversely, the current approach computes very few parameters since their estimates are determined in a subspace of dimension d = K − 1 smaller than the dimension of the original space, and independent from the dimension of the original space.
3
Experimental results
In this section, the Fisher EM algorithm is applied on simulated data. The following experiments aim to highlight the main features of the proposed clustering method: visual representation and clustering performance in high-dimensions.
3.1 Visual representation of the partition
For this first experiment, 600 observations have been simulated following the mixture model considered in the previous section. The simulated dataset is made of 3 groups and each group is modeled by a Gaussian density in a 2-dimensional space completed by 23 dimensions of Gaussian noise. Fig-ure 1(a) shows the simulated data in their 2-dimensional latent space whereas Figure 1(b) presents the projection of the 25-dimensional observed data on the two first principal components of PCA. As we can observe, the PCA repre-sentation of the data is actually not well suited for clustering these data even so it exists a representation which discriminates perfectly the three groups. Figure 1(c) shows the partition provided by the Fisher-EM algorithm on the estimated discriminative subspace. On the one hand, the result of the Fisher-EM algorithm appears to be a very informative representation. On the other hand, the partition provided by the Fisher-EM algorithm is an optimal par-tition (96% correct) since it equals the Bayes’ classifier (computed with the true densities).
−10 −5 0 5 10 −10 −5 0 5 10 axe 1 axe 2 −30 −20 −10 0 10 20 30 −30 −20 −10 0 10 20 30 axe 1 axe 2 −10 −5 0 5 10 −10 −5 0 5 10 axis 1 axis 2
(a) Data in the latent space. (b) Projection on 2 axis of PCA. (c) Estimated Fisher axis.
Fig. 1. Clustering of simulated data ∈ R25
with an intrinsic dimension equals to 2.
3.2 Effect of the dimension
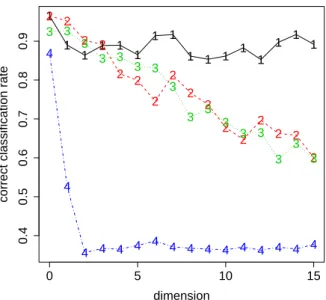
This second experiment aims to compare on a simulated dataset the perfor-mances of the Fisher-EM algorithm with traditional clustering methods such as the classical EM algorithm, the EM algorithm calculated on the principal components of PCA (hereafter PCA+EM) and the k-means algorithm. As before, the simulated dataset is made of 3 groups where each group is mod-eled by a Gaussian density in a 2-dimensional space completed by 1 to 15 dimensions of Gaussian noise. The same initial conditions have been used for each method and we have chosen, for this study, an initialization on pa-rameters proposed by McLachlan and Peel [7]. Finally, the experiment has been repeated 20 times in order to average the classification results. Fig-ure 2 presents the effect of the dimension on the classification performances obtained with Fisher-EM, EM, PCA+EM and k-means. Firstly, the perfor-mances of EM and PCA+EM algorithms decrease proportionally when the dimension increases. Secondly, k-means algorithm has a lower performance than other methods in the initial space and becomes worse when the dimen-sion increases. Finally, the dimendimen-sion appears to have no significant influence on the Fisher-EM performances. The correct classification rate is 0.90 on av-erage whatever the dimension is. However, Fisher-EM turns out to have the same weakness as the EM algorithm: it has a slight instability due to the ini-tial conditions. Nevertheless, the correct classification rate of the Fisher-EM algorithm remains very satisfying for the whole range of dimensions.
4
Conclusion
In this work, a model-based clustering method in Fisher discriminative sub-spaces has been proposed. This approach is based on a latent mixture model in a discriminative subspace. An EM-like estimation procedure, called Fisher-EM algorithm, is proposed to estimate both the discriminative subspace and
6 Bouveyron et al. 1 1 1 1 1 1 1 1 1 1 1 1 1 1 1 1 0 5 10 15 0.4 0.5 0.6 0.7 0.8 0.9 dimension
correct classification rate
2 2 2 2 2 2 2 2 2 2 2 2 2 2 2 2 3 3 3 3 3 3 3 3 3 3 3 3 3 3 3 3 4 4 4 4 4 4 4 4 4 4 4 4 4 4 4 4
Fig. 2. Influence of the dimension on the correct classification rate for Fisher-EM
(1-black), EM (2-red), PCA+EM (3-green) and k-means (4-blue).
the mixture model parameters. Experiments on simulated data have shown that the proposed approach outperforms traditional clustering methods and that the Fisher-EM algorithm seems not sensitive to high dimensions. More-over, the proposed latent mixture model is parsimonious since the number of estimated parameters is independent of the initial dimension of the data. Finally, this approach provides as well a comprehensive representation of the structure of high-dimensional data.
References
1.R. Bellman. Dynamic Programming. Princeton University Press, 1957. 2.I. Jolliffe. Principal Component Analysis. Springer-Verlag, New York, 1986. 3.I. Guyon and A. Elisseeff. An introduction to variable and feature selection.
Journal of Machine Learning Research, 3:1157–1182, 2003.
4.T. Hastie, R. Tibshirani, and J. Friedman. The elements of statistical learning. Springer, New York, 2001.
5.A. Jain, M. Marty, and P. Flynn. Data Clustering: a review. ACM Computing Surveys, 31(3):264–323, 1999.
6.A. Dempster, N. Laird, and D. Robin. Maximum likelihood from incomplete data via the em algorithm. Journal of the Royal Statistical Society, 39(1):1–38, 1977. 7.G. McLachlan and D. Peel. Finite Mixture Models. Wiley Interscience, New York,