HAL Id: hal-01614971
https://hal.archives-ouvertes.fr/hal-01614971
Submitted on 11 Oct 2017HAL is a multi-disciplinary open access
archive for the deposit and dissemination of sci-entific research documents, whether they are pub-lished or not. The documents may come from teaching and research institutions in France or abroad, or from public or private research centers.
L’archive ouverte pluridisciplinaire HAL, est destinée au dépôt et à la diffusion de documents scientifiques de niveau recherche, publiés ou non, émanant des établissements d’enseignement et de recherche français ou étrangers, des laboratoires publics ou privés.
Distinct alterations in Parkinson’s Medication-state and
Disease-state Connectivity Running Title: PD altered
connectivity
Bernard Ng, Gaël Varoquaux, Jean Baptiste Poline, Bertrand Thirion,
Michael Greicius, Kathleen Poston
To cite this version:
Bernard Ng, Gaël Varoquaux, Jean Baptiste Poline, Bertrand Thirion, Michael Greicius, et al.. Dis-tinct alterations in Parkinson’s Medication-state and Disease-state Connectivity Running Title: PD altered connectivity. Neuroimage-Clinical, Elsevier, 2017. �hal-01614971�
Distinct alterations in Parkinson’s Medication-state and Disease-state Connectivity
Bernard Ng1,2,3, Gael Varoquaux2, Jean Baptiste Poline2, Bertrand Thirion2, Michael D. Greicius3, Kathleen L. Poston4,5*
Affiliations:
1. Mostafavi Lab, Department of Statistics, University of British Columbia, Vancouver, BC, Canada
2. Parietal team, INRIA Saclay, Gif-sur-Yvette, France
3. Functional Imaging in Neuropsychiatric Disorders (FIND) Lab, Department of Neurology & Neurological Sciences, Stanford University School of Medicine, Stanford, CA
4. Department of Neurology & Neurological Sciences, Stanford University School of Medicine, Stanford, CA
5. Department of Neurosurgery, Stanford University School of Medicine, Stanford, CA
*Corresponding Author Kathleen L. Poston Stanford Medical Center
300 Pasteur Dr., Room A343. MC-5235 Stanford, CA 94305
Abstract
Altered brain connectivity has been described in people with Parkinson’s disease and in response to dopaminergic medications. However, it is unclear whether dopaminergic medications primarily ‘normalize’ disease related connectivity changes or if they induce unique alterations in brain connectivity. Further, it is unclear how these disease- and medication- associated changes in brain connectivity relate differently to specific motor manifestations of disease, such as bradykinesia/rigidity and tremor. In this study, we applied a novel covariance projection approach in combination with a bootstrapped permutation test to resting state functional MRI data from 57 Parkinson’s disease and 20 healthy control participants to determine the Parkinson’s medication-state and disease-state connectivity changes associated with different motor manifestations of disease. First, we identified brain connections that best classified Parkinson’s disease ON versus OFF dopamine and Parkinson’s disease versus healthy controls, achieving 96.9 ± 5.9% and 72.7 ± 12.4% classification accuracy, respectively. Second, we investigated the connections that significantly contribute to the classifications. We found that the connections greater in Parkinson’s disease OFF compared to ON dopamine are primarily between motor (cerebellum and putamen) and posterior cortical regions, such as the posterior cingulate cortex. By contrast, connections that are greater in ON compared to OFF dopamine are between the right and left medial prefrontal cortex. We also identified the connections that are greater in healthy control compared to Parkinson’s disease and found the most significant connections are associated with primary motor regions, such as the striatum and the supplementary motor area. Notably, these are different connections than those identified in Parkinson’s disease OFF compared to ON. Third, we determined which of the Parkinson’s medication-state and disease-state connections are associated with the severity of different motor
symptoms. We found two connections correlate with both bradykinesia/rigidity severity and tremor severity, whereas four connections correlate with only bradykinesia/rigidity severity, and five connections correlate with only tremor severity. Connections that correlate with only tremor severity are anchored by the cerebellum and the supplemental motor area, but only those connections that include the supplemental motor area predict dopaminergic improvement in tremor. Our results suggest that dopaminergic medications do not simply ‘normalize’ abnormal brain connectivity associated with Parkinson’s disease, but rather dopamine drives distinct connectivity changes, only some of which are associated with improved motor symptoms. In addition, the dissociation between of connections related to severity of bradykinesia/rigidity versus tremor highlights the distinct abnormalities in brain circuitry underlying these specific motor symptoms.
Keywords: Parkinson’s disease, classification, functional magnetic resonance imaging, dopamine, Riemannian geometry
Abbreviations:
FDR: false discovery rate fMRI: functional MRI HC: healthy control
MDS-UPDRS: Movement Disorders Society-Unified Parkinson’s disease Rating Scale PCC: posterior cingulate cortex
OAS: Oracle Approximating Shrinkage ROI: region of interest
1. Introduction
In Parkinson’s disease, depletion of dopaminergic neurons in the substantia nigra leads to the hallmark motor symptoms of bradykinesia, rigidity, and tremor (Kalia and Lang 2015). However, the degree to which individual patients’ manifest these different motor symptoms is so widely variable that some patients are labeled as tremor-dominant subtype with minimal bradykinesia/rigidity and others do not exhibit any tremor at all (Marras and Lang 2013). While dopaminergic replacement generally provides substantial improvement in these primary motor symptoms, many other symptoms do not necessarily benefit from dopamine, such as gait disturbance and postural instability, and other symptoms can be worsened by dopamine, such as hallucinations, impulsivity, and dyskinesia (Fahn et al. 2004; Hely et al. 2005).
Over the past decade resting state functional MRI (fMRI) studies have sought to uncover whether these different hallmark Parkinson’s disease motor symptoms are associated with distinct changes in brain circuitry and whether there is a relationship between dopaminergic medications and changes in brain circuitry (Tahmasian et al. 2015). Some studies have suggested a dopaminergic ‘normalization’ of abnormal Parkinson’s disease connectivity (Szewczyk-Krolikowski et al. 2014; Wu et al. 2009; Wu et al. 2012) but other studies suggest dopamine can alter connectivity outside of the cortico-striatal circuitry (Tahmasian et al. 2017). One placebo controlled experiment showed administration of a single dose of levodopa to drug-naïve patients restored altered supplementary motor area (SMA) functional connectivity (Esposito et al. 2013), which conformed to prior investigations of dopamine-induced changes in Parkinson’s disease resting state connectivity (Kwak et al. 2010; Kwak et al. 2012; Tahmasian et al. 2015; Wu et al. 2009). In addition, overall motor severity has been associated with connectivity changes between
the subthalamic nucleus and the primary motor cortex (Kurani et al. 2015), with reductions in striatal connectivity with other subcortical/brainstem regions, such as the thalamus, midbrain, pons, and cerebellum (Hacker et al. 2012), and with increased striatal connectivity with parietal, occipital, and temporal cortical (Agosta et al. 2014). A few studies have investigated the connectivity changes specific to tremor by identifying differential changes in subcortical-cortical connectivity between tremor and non-tremor patients (Baudrexel et al. 2011). Parkinson’s disease tremor has also been associated with changes in cerebello-pallidal connectivity (Helmich
et al. 2011), and dopamine associated connectivity changes have been described within
cerebello-thalamo-cortical networks (Dirkx et al. 2017; Festini et al. 2015; Kwak et al. 2012). Therefore, it is clear that Parkinson’s disease patients show altered functional connectivity specific to different motor symptoms; however, few studies have explored how these changes are associated with the severity of tremor versus the severity of bradykinesia/rigidity or whether these changes predict dopaminergic improvement in the motor symptom severity.
To address these important clinical questions, we employed a novel covariance projection approach (Ng et al. 2016) to resting state fMRI data, in combination with a bootstrapped permutation test (Ng et al. 2015), and identified specific connections that best discriminate Parkinson’s disease participants ON versus OFF dopaminergic medications (Parkinson’s medication-state), and Parkinson’s disease versus age-matched healthy control (HC) participants (Parkinson’s disease-state). To then identify connections specifically related to tremor or to bradykinesia/rigidity, we correlated symptom severity with the significant connections driving the above classifications in an independent cohort of Parkinson’s disease participants. In this study, we applied a methodology that aims to enhance sensitivity without compromising
statistical rigor. For example, the employed covariance projection approach explicitly deals with how elements of connectivity matrices are inherently inter-related (Varoquaux et al. 2010), which degrades classification performance (Tolosi and Lengauer 2011) and complicates inference of significant brain connections. Also, prior Parkinson’s disease studies have identified altered connectivity not only in primary motor regions, such as the primary motor cortex, SMA, and cerebellum, but also non-motor regions in the frontal, parietal, and temporal cortex. Therefore, we used an unbiased whole brain parcellation scheme to define regions of interest (ROIs) to ensure the inclusion of both traditional motor and non-motor regions.
2. Materials and methods
2.1 Participants
We recruited 57 Parkinson’s disease and 20 HC participants from the Stanford Movement Disorders Clinic and from the surrounding community for our classification cohort. All patients were diagnosed with Parkinson’s disease by a board-certified neurologist with specialty training in movement disorders (KLP) based on UK Parkinson’s Disease Society Brain Bank criteria (Litvan et al. 2003) and meet the more recent criteria for ‘Clinically Probable Parkinson’s disease’ (Postuma et al. 2015). Parkinson’s disease participants underwent a comprehensive neurological screening exam and the Movement Disorders Society-Unified Parkinson’s disease Rating Scale motor assessment (MDS-UPDRS part III) (Goetz et al. 2008) both OFF and ON dopaminergic medications. The MDS-UPDRS part III was performed just prior to the MRI scan. According to published protocols (Poston et al. 2016a), the ‘practical’ off medication state (Parkinson’s disease OFF) for both clinical and imaging assessments was defined as ≥ 72 hours off extended release dopamine agonists, selective MAO-inhibitors, and long-acting levodopa,
and ≥ 12 hours off short acting dopamine agonists and levodopa. The on medication state (Parkinson’s disease ON) for both clinical and imaging assessments was defined as the patients taking their normal daily medications in the optimally medicated state, as determined by both the patient and the movement disorders neurologist. To maximize diagnostic specificity, we only included subjects with at least two years of a Parkinson’s disease diagnosis and at least 20% improvement in the MDS-UPDRS part III score when ON medications. Further inclusion criteria for all Parkinson’s disease and HC participants were as follows: 1) Age between 45-90 years, 2) no contraindications to MRI, 3) no history of significant neurological disease (other than Parkinson’s disease), hospitalization for psychiatric illness, or current substance abuse, and 4) no history of severe cognitive impairment during phone screening. In addition, all HC were evaluated as healthy in a neurological screening exam, and obtained a score on the Mini Mental State Exam (MMSE) ≥ 27 (Folstein et al. 1975). We further subdivided the MDS-UPDRS part III into a Tremor Subscore (items 3.15 – 3.18) and a Bradykinesia/Rigidity Subscore (items 3.3 – 3.8).
We recruited a second, independent cohort of 14 Parkinson’s disease for the motor severity analysis and 14 HC for base correlation matrix estimation (see Methods: Connectivity-based classification). Inclusion criteria, exclusion criteria, and all analysis were identical to the original classification cohort.
The Stanford University Institutional Review Board approved all study protocols. All study participants provided written consent according to the Declaration of Helsinki.
2.2 Image acquisition
Functional images were acquired on two 3 Tesla General Electric scanners using an 8-channel head coil. Identical scanning parameters were used on both scanners, and have been described elsewhere (Shirer et al. 2012). To reduce blurring and signal loss arising from field inhomogeneities, an automated high-order shimming method based on spiral acquisitions was used (Kim et al. 2002). Thirty-one axial slices (4 mm thick, 0.5 mm skip) covering the whole brain were imaged using a T2*-weighted gradient-echo spiral pulse sequence (time repetition = 2000 ms, time echo = 30 ms, flip angle = 80°, and one interleave) (Glover and Lai 1998; Glover and Law 2001). The field of view was 220x220 mm2, and the matrix size was 64x64, giving an in-plane spatial resolution of 3.44 mm.
Parkinson’s disease participants completed two resting state fMRI sessions; one OFF and one ON dopaminergic medications (as defined above), which were counter-balanced and always acquired on the same scanner for each Parkinson’s disease participant. The HC participants completed one fMRI session. The data from 20 Parkinson’s disease participants were acquired on scanner 1 and the data from 37 Parkinson’s disease participants were acquired on scanner 2. The data from HC participants were all acquired on scanner 1; hence, we only included the subset of 20 Parkinson’s disease participants for the Parkinson’s disease versus HC analysis, who had data from scanner 1.
2.3 Preprocessing
Each participant’s fMRI data were first motion corrected and co-registered to the T1 volume. Spatial normalization was then performed by non-rigidly registering the T1 volume to MNI
space and applying the estimated warp to the co-registered fMRI volumes using SPM8. Motion artifacts (the six parameters estimated during motion correction), white matter and cerebrospinal fluid confounds, principal components from high variance voxels extracted using CompCor (Behzadi et al. 2007) and their one time sample shifted variants were regressed out from the voxel time courses (see Supplemental material). All subjects had a mean frame-wise displacement < 0.35 mm and a maximum displacement < 2.0 mm (Supplemental Table), with no significant differences between groups. A bandpass filter with cutoff frequencies at 0.01 and 0.1 Hz was subsequently applied.
2.4 Whole-brain parcellation
Functional connectivity estimated at voxel level (~50,000 by 50,000 matrices) is not very reliable due to the typical small number of time samples (~hundreds). Clustering voxels into spatially-contiguous, functionally-homogeneous parcels provides a logical means of reducing the high dimensionality (Thirion et al. 2014). To generate a whole-brain parcellation, we first divided the cortex and cerebellum into two halves (left and right). We then separately parcellated the left and right halves into Nl and Nr parcels, respectively, by temporally concatenating voxel time series across the twenty-one subjects (two scans each) of the multimodal Kirby 21 dataset (Landman et al. 2011), and applying spatially-constrained, hierarchical Ward clustering (Thirion
et al. 2014). We further added the subcortical regions from the Harvard Oxford atlas (Desikan et
al. 2006) into our parcellation. Nl is set to round(nl · N / Ng), where nl is the number of gray matter voxels in the left half, Ng is the total number of gray matter voxels within the cortex,
cerebellum, and subcortical regions, and N (set to 100) is the user-defined number of parcels. Nr is similarly set. Note that we opted to use an independent dataset for functional parcellation to
avoid introducing any potential bias by “seeing” our Parkinson’s disease subjects’ data prior to classification. Gray matter voxel time courses within each parcel were averaged to generate brain parcel time courses. These time courses were normalized by subtracting the mean and dividing by the standard deviation.
2.5 Connectivity-based classification
Given the parcel time courses, the standard way for estimating functional connectivity is to compute the Pearson’s correlation between all parcel pairs. These connectivity estimates are then taken as features for classifier learning (Richiardi et al. 2013). A fundamental limitation to this standard approach is that elements of the Pearson’s correlation matrix are inherently inter-related by virtue of being a positive semidefinite matrix (Ng et al. 2014), but the performance of most classifiers tend to degrade when the input features are correlated (Tolosi and Lengauer 2011). To remove the positive semidefinite constraint, we recently proposed an approach based on concepts from Riemannian geometry (Milazzo et al. 2014; Ng et al. 2014; Ng et al. 2016). The core idea is that correlation matrices live on a certain manifold. By projecting the correlation matrices onto the tangent space of this manifold, elements of the resulting correlation matrices are no longer linked by the positive semidefinite constraint (Supplemental Fig. 1). Our proposed projection is given by: dCc(s) = logm(Cb(s)-1/2Cc(s)Cb(s)-1/2), where Cc(s) is the correlation matrix of subject s associated with condition/group c, Cb(s) is the base correlation matrix at which projection is performed, logm(·) denotes matrix logarithm, and X-1/2 denotes matrix inverse square root of a matrix X. Details of this approach are provided in the Supplementary materials. Computing
dCc(s) requires Cc(s) and Cb(s) to be positive definite. Well-conditioned, positive definite estimates of Cc(s) and Cb(s) were obtained using Oracle Approximating Shrinkage (OAS), which
is a regularization technique for covariance estimation with a closed-form solution for determining the optimal level of l2 regularization (Chen et al. 2010). For classification, we used a
linear support vector machine with the soft margin parameter left at its default value of 1.
The meaning of c, the choice of Cb(s), and the method for estimating classification accuracy depend on the classification task at hand: classifying whether a Parkinson’s disease participant is OFF or ON medication versus classifying whether a participant is Parkinson’s disease or HC. For the former, c = 1 or 2 corresponded to OFF or ON medication (Supplemental Fig. 1). Cb(s) was computed by temporally concatenating the parcel time series of conditions 1 and 2 together for each subject s, and applying OAS. Classification accuracy was estimated using repeated subsampling over 10,000 random splits: 50 subjects used for training and seven subjects used for testing. Subsampling on subjects prevents dCc(s) of different c from the same subject s to be used for training and testing, which avoids introducing correlations between the training and test samples. To examine whether our classification was driven by medication-induced differences in the amount of motion, we applied a paired t-test to the mean frame-wise displacement (Power et
al. 2012) to test for significant motion differences (Supplemental Table).
As for the latter classification task, c = 1 or 2 corresponded to Parkinson’s disease OFF medication or HC (Supplemental Fig. 2). Cb(s) was computed by applying OAS to parcel time series temporally concatenated across 14 age-matched HC from the independent cohort, which were similarly preprocessed. Hence, Cb(s)=Cb was the same across subjects (i.e. not dependent on s). This choice avoids having a different Cb(s) and re-performing projection for each training set. Classification accuracy was estimated using repeated subsampling over 10,000 random splits:
15 Parkinson’s disease OFF and 15 HC for training, five Parkinson’s disease OFF and five HC for testing. To examine whether our classification was driven by differences in the amount of motion between Parkinson’s disease OFF and HC, we applied a two-sample t-test to the mean frame-wise displacement (Power et al. 2012) to test for significant motion differences.
2.6 Discriminative connection identification
An open question in pattern classification is how to identify the statistically significant features from the classifier weights. The underlying problem is that the null distribution of classifier weights is typically unknown. We thus cannot apply classical inference, e.g. a t-test, to statistically isolate the relevant features. The conventional way for dealing with this problem is to permute the class labels of the samples to generate a null distribution of what the classifier weights would be if there were no distinctions between samples of the different classes. If the original classifier weight of a feature (without class label permutation) is e.g. larger than the 95th percentile of the null distribution, then this feature would be declared as significant. However, given limited number of subjects the learned classifier weights would have high variance. To identify the more stable discriminative features, we recently proposed a procedure that incorporates bootstrapping into permutation testing (Ng et al. 2015; Ng et al. 2016). Details of this procedure are presented in the Supplementary materials. This procedure exploits the intuition that classifier weights associated with relevant features are presumably more variable when the class labels of the samples are permuted. Thus, dividing the classifier weights with and without permutation by their respective standard deviation should magnify their magnitude differences. This intuition is incorporated by using Studentized statistics as our test statistics, which we generated by taking the mean of bootstrapped classifier weights and dividing it by the
standard deviation. The p-value of each brain connection was estimated by comparing its original classifier weight against the null distribution. Significance was declared at p < 0.05 with false discovery rate (FDR) correction (Genovese et al. 2002).
2.7 Statistical analysis of connectivity-symptom severity
To analyze the association between the identified significant connections and severity of bradykinesia/rigidity and tremor, we examined an independent cohort of 14 Parkinson’s disease subjects (similarly preprocessed), who were matched for disease severity. We assessed the association between the projected connectivity OFF medication, i.e. dCOff, for each significant connection identified in our classification cohort (57 Parkinson’s disease OFF versus ON medication and 20 Parkinson’s disease OFF versus 20 HC) and the Tremor and Bradykinesia/Rigidity Subscores OFF medication in the independent cohort. We also examined the association between dCOff ‒ dCOn and the relative differences in Tremor and Bradykinesia/Rigidity Subscores between OFF and ON medications. As a measure of association, we computed the partial Spearman’s correlation between the projected connectivity and each motor subscore with sex and age regressed out. We opted to use Spearman’s correlation since the motor subscores were non-Gaussian. Significance was declared at p < 0.05 with FDR correction. Note that in computing p-values from partial Spearman’s correlations, it is important to reduce the degrees of freedom by the number of covariates regressed out, otherwise, the p-values would be over-optimistic.
3. Results
See Table 1 for complete demographic characteristics of all participants. The participants included in the classification analysis for Parkinson’s disease versus HC were matched for age and gender. The Parkinson’s disease participants in the independent cohort were older than the Parkinson’s disease participants in the classification cohort, but were matched for MDS-UPDRS part-III OFF and ON, disease duration, and total levodopa-equivalency daily dose (Tomlinson et
al. 2010).
Table 1: Demographics and clinical characteristics Healthy Controls (Scanner 1) PD (Scanner 1 Only) t-test or χ2 * All PD (Scanner 1 and 2) Independent Cohort PD (Scanner 2) t-test or χ2 ** mean
(range) (range)mean
mean (range) mean (range) # participants 20 20 57 14 Age (years) 60.0 (38-80) 63.5 (45-83) 0.22 66.1 (45-84) 72.4 (56-85) 0.04 Gender (M/F) 8/12 11/9 0.34 29/28 7/7 0.95 Duration (years) NA 4.5 (0.3-11.4) 6.1 (0.3-21.5) 4.7 (0.2-14.6) 0.29 MDS-UPDRS III OFF NA 25.6 (12-43) 34.7 (6-62) 34.2 (24-48) 0.76 ON NA 11.5 (5-21) 19.3 (4-50) 20.2 (8-36) 0.94 Tremor Subscale OFF NA 7.3 (1-18) 6.5 (0-18) 5.8 (1-17) 0.52 ON NA 3.1 (0-6) 3.2 (0-13) 3.2 (0-9) 0.73 Bradykinesia/Rigidity Subscale OFF NA 12.5 (6-24) 19.1 (5-37) 20.7 (8-29) 0.55 ON NA 6.4 (2-14) 11 (1-28) 12.7 (5-18) 0.42 LEDD NA 636.5 (100.0-1299.7) 674.6 (100.0-1580.0) 626.6 (225.0-1450.0) 0.65
# Levodopa Only NA 14 31 9
# Agonist Only NA 2 4 0
# Levodopa&Agonist NA 4 22 5
*Healthy Controls versus PD Scanner1, **All PD versus Independent Cohort PD
PD, Parkinson’s disease; MDS-UPDRS III, Movement Disorders Society-Unified Parkinson’s’ disease Rating scale, part-III motor score; LEDD, levodopa equivalent daily dose; NA, not applicable
3.2 Classification accuracy
The classification accuracy achieved with our method in separating Parkinson’s disease OFF versus ON medication was 96.9 ± 5.9%. The sensitivity was 97.2 ± 6.2% and specificity was 96.8 ± 6.6% (sensitivity defined as the percentage of Parkinson’s disease ON medication correctly identified). We confirmed that motion differences between Parkinson’s disease OFF and ON medication based on mean frame-wise displacement was not statistically significant (p = 0.18, Supplemental Table). To ensure that the high accuracy was not due to potential bias introduced by our method, we further applied our method to the multimodal Kirby 21 dataset (Landman et al. 2011), which comprised two 7 minutes resting state fMRI scans collected from each of 21 healthy subjects. The two scans of each subject were acquired at two separate sessions with no intervention in between. The attained accuracy in classifying whether a scan was from session 1 or session 2 was 51.0 ± 20.0%, which confirms that the high accuracy achieved with our method in classifying Parkinson’s disease OFF versus ON medication was not due to method-induced bias. For comparison, we found that using Pearson’s correlation as input features obtained an accuracy for separating Parkinson’s disease OFF versus ON of merely 50.7 ± 12.2%.
When classifying Parkinson’s disease OFF medication versus HC, the classification accuracy was 72.7 ± 12.4%, the sensitivity was 71.1 ± 20.5% and the specificity was 75.8 ± 18.4% (sensitivity defined as percentage of Parkinson’s disease OFF correctly identified). We confirmed that motion differences between Parkinson’s disease OFF medication and HC based on mean frame-wise displacement was not statistically significant (p = 0.103, Supplemental Table).
3.3 Connections that discriminate Parkinson’s medication-state and disease-state
We next identified the significant connections associated with the classification of Parkinson’s medication-state (OFF versus ON dopaminergic medications) (Table 2). Significant connections were found between several basal ganglia and cortical motor regions, including the right and left putamen, left caudate, and right SMA/premotor cortex (Fig. 1). Notably, all the connections that were greater in the OFF state included at least one motor-related region (putamen, cerebellum, caudate, and SMA); by contrast connections that were greater in the ON state included the frontal lobes. Specifically, the connection between the right and left medial prefrontal cortex and connections with the lateral frontal cortex were greater in the ON medication state.
Fig.1: Significant connections between Parkinson’s disease OFF versus ON dopaminergic medication. Circles represent the centroid for each region of interest. Red lines represent Parkinson’s disease ON connectivity greater than OFF, Blue lines represent Parkinson’s disease ON connectivity less than OFF. L = left, R = right, Cau = caudate, Cer = cerebellum, Inf Temp = interior temporal lobe, MPFC = medial prefrontal cortex, PCC = posterior cingulated cortex, Put = putamen, and SMA = supplementary motor area.
Table 2: Significant connections between groups
Parkinson's disease OFF versus Parkinson's disease ON dopaminergic medications
Right Putamen Left PCC Off > On
Right Cerebellum Left PCC Off > On
Left Caudate Left Insula Off > On
Right SMA & Premotor Right Angular gyrus Off > On Right Medial Prefrontal Cortex Left Medial Prefrontal Cortex On > Off
Left Putamen Right Middle Frontal On > Off
Right Inferior Temporal Gyrus Left Angular gyrus On > Off Healthy Controls versus Parkinson's disease OFF dopaminergic medications
Left Putamen Right Putamen HC > Off
Left Putamen Right Angular gyrus HC > Off
Left Pallidum Left Medial PFC HC > Off
Right SMA Right Occipital Pole HC > Off
Right SMA & Medial Prefrontal Cortex Right Supramarginal gyrus HC > Off Left Amydala Left Superior Frontal Cortex HC > Off
Right Angular gyrus Right Precuneus HC > Off
Off > On: greater connectivity in Parkinson’s disease off dopaminergic medications On > Off: greater connectivity in Parkinson’s disease on dopaminergic medications
HC > Off: greater connectivity in the healthy control group compared to Parkinson’s disease off dopaminergic medications
Significant connections associated with the classification of Parkinson’s disease-state (Parkinson’s disease OFF medication versus HC) were all greater in HC (Fig. 2). Most of these connections included at least one basal ganglia or cortical motor region (right and left putamen, left pallidum, right SMA).
Fig.2: Significant connections between Parkinson’s disease OFF medication versus Healthy Controls. Circles represent the centroid for each region of interest. Connectivity in Healthy Controls was greater than Parkinson’s disease OFF medication for all significant connections. L = left, R = right, Amy = amydala, MPFC = medial prefrontal cortex, Occ Pole = occipital pole, Put = putamen, Pal = pallidum, SMA = supplementary motor area, Sup Front = superior frontal gyrus, and Supramarg = supramarginal gyrus.
3.4 Associations between connectivity and motor symptom severity
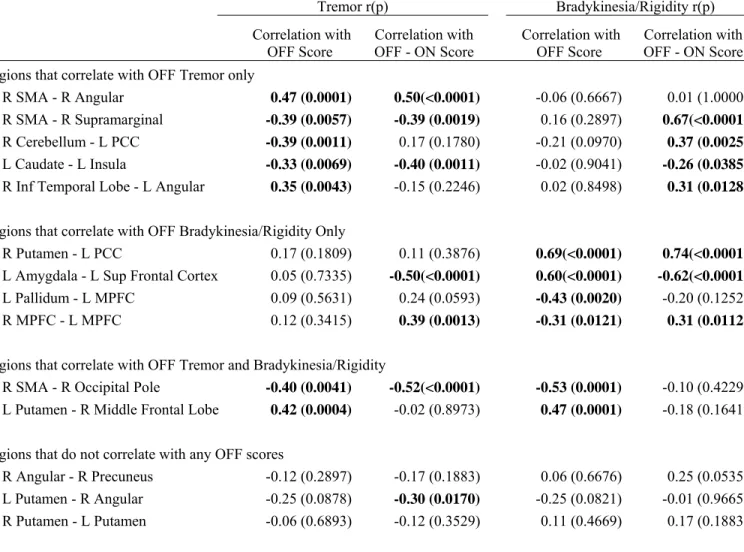
We determined the associations between the projected connectivity of the significant Parkinson’s medication-state and disease-state connections and clinical measures of disease severity in the independent cohort of 14 Parkinson’s disease participants. The partial Spearman’s correlation between OFF medication projected connectivity and OFF Tremor and Bradykinesia/Rigidity Subscores are in Table 3 and Supplemental Fig.5.
Table 3: Partial Spearman’s correlations between projected connectivity and motor subscores
Tremor r(p) Bradykinesia/Rigidity r(p)
Correlation with OFF Score Correlation with OFF - ON Score
Correlation with
OFF Score OFF - ON Score Correlation with
Regions that correlate with OFF Tremor only
R SMA - R Angular 0.47 (0.0001) 0.50(<0.0001) -0.06 (0.6667) 0.01 (1.0000)
R SMA - R Supramarginal -0.39 (0.0057) -0.39 (0.0019) 0.16 (0.2897) 0.67(<0.0001)
R Cerebellum - L PCC -0.39 (0.0011) 0.17 (0.1780) -0.21 (0.0970) 0.37 (0.0025)
L Caudate - L Insula -0.33 (0.0069) -0.40 (0.0011) -0.02 (0.9041) -0.26 (0.0385)
R Inf Temporal Lobe - L Angular 0.35 (0.0043) -0.15 (0.2246) 0.02 (0.8498) 0.31 (0.0128)
Regions that correlate with OFF Bradykinesia/Rigidity Only
R Putamen - L PCC 0.17 (0.1809) 0.11 (0.3876) 0.69(<0.0001) 0.74(<0.0001)
L Amygdala - L Sup Frontal Cortex 0.05 (0.7335) -0.50(<0.0001) 0.60(<0.0001) -0.62(<0.0001)
L Pallidum - L MPFC 0.09 (0.5631) 0.24 (0.0593) -0.43 (0.0020) -0.20 (0.1252)
R MPFC - L MPFC 0.12 (0.3415) 0.39 (0.0013) -0.31 (0.0121) 0.31 (0.0112)
Regions that correlate with OFF Tremor and Bradykinesia/Rigidity
R SMA - R Occipital Pole -0.40 (0.0041) -0.52(<0.0001) -0.53 (0.0001) -0.10 (0.4229)
L Putamen - R Middle Frontal Lobe 0.42 (0.0004) -0.02 (0.8973) 0.47 (0.0001) -0.18 (0.1641)
Regions that do not correlate with any OFF scores
R Angular - R Precuneus -0.12 (0.2897) -0.17 (0.1883) 0.06 (0.6676) 0.25 (0.0535)
L Putamen - R Angular -0.25 (0.0878) -0.30 (0.0170) -0.25 (0.0821) -0.01 (0.9665)
Partial Spearman’s correlations after regressing out and age. Significant correlations are bolded. L = left, R = right, MPFC = medial prefrontal cortex, PCC = posterior cingulated cortex, and SMA = supplementary motor area.
The connections most highly correlated with only OFF Tremor Subscore include the right SMA and right angular gyrus (r=0.47, p<0.0005, Fig.3A), the right SMA and right supramarginal gyrus (r=-0.39, p<0.05, Fig.3B), the right cerebellum and left posterior cingulate cortex (PCC) (r =-0.39, p≤0.005), and the left caudate and left insula (r=-0.33, p≤0.05).
Fig.3. Relationship between SMA connectivity and Tremor severity. Partial Spearman’s correlation (adjusted for gender and age). (A, B, C) Show the correlation between OFF medication projected connectivity and OFF Tremor whereas (D, E, F) show the correlation between relative medication-induced differences in projected connectivity, i.e. dCOff-dCOn, and
dopaminergic improvement (OFF minus ON) in Tremor Subscore.
The connections most highly correlated with only OFF Bradykinesia/Rigidity Subscore include the right putamen and left PCC (r=0.69, p<0.0005, Fig4A), the left amygdala and left superior frontal gyrus (r=0.60, p<0.0005), and the left pallidum and left medial prefrontal cortex (r=-0.43, p≤0.001).
Fig.4. Relationship between Putamen connectivity and Bradykinesia/Rigidity severity. Partial Spearman’s correlation (adjusted for gender and age). (A) Shows the correlation between OFF medication projected connectivity and OFF Bradykinesia/Rigidity whereas (B) shows the correlation between relative medication-induced differences in projected connectivity, i.e. dCOff
-dCOn, and dopaminergic improvement (OFF minus ON) in Bradykinesia/Rigidity Subscore.
The connection most highly correlated with both OFF Tremor and Bradykinesia/Rigidity Subscore include the left putamen and right middle frontal cortex (r=0.42, p<0.0005; r=0.47,
p<0.0005, respectively), and the right SMA and right occipital lobe (r=-0.40, p≤0.005, Fig.3C; r=-0.53, p<0.0005, respectively).
3.5 Associations between connectivity and dopaminergic improvement in motor symptoms
Next, we determined whether dopaminergic change in connectivity predicts dopaminergic improvement of specific motor symptom severity in the independent cohort of 14 Parkinson’s disease participants. We focused on the connections with at least a moderate (Spearman’s correlation coefficient ≥ 0.3) or strong (Spearman’s correlation coefficient ≥ 0.6) correlation between OFF medication connectivity and OFF medication motor severity. Using these connections, we determined the partial Spearman’s correlation between relative medication-induced differences in projected connectivity, i.e. dCOff-dCOn, and dopaminergic improvement
(OFF minus ON) in Tremor Subscore and Bradykinesia/Rigidity Subscore, which are shown in Table 3 and Supplemental Fig. 6.
The connections that show a moderate to strong correlation with OFF Tremor Subscore that also show dopaminergic connectivity change is correlated with dopaminergic Tremor Subscore change include the right SMA and right occipital lobe (r=-0.52, p<0.0005, Fig.3F), the right SMA and right angular gyrus (r=0.50, p<0.0005, Fig.3D), the right SMA and right supramarginal gyrus (r=-0.39, p<0.001, Fig.3E), and the left caudate and left insula (r=-0.40, p≤0.001), but not the right cerebellum and left posterior cingulate cortex.
The connections that show a moderate to strong correlation with OFF Bradykinesia/Rigidity Subscore that also show dopaminergic connectivity change is correlated with dopaminergic Bradykinesia/Rigidity Subscore change include the right putamen and PCC (r=0.74, p<0.0005, Fig.4B), and the left amygdala and left superior frontal cortex (r=-0.62, p<0.0005), but not the left pallidum and left medial prefrontal cortex.
4. Discussion
In this study, we applied a novel covariance projection approach to classify Parkinson’s medication-state and Parkinson’s disease-state. We achieved substantially more accurate classification using this approach versus traditional Pearson’s correlations. Additionally, using a bootstrapped permutation test we showed that the connections discriminating Parkinson’s disease-state are different than those discriminating Parkinson’s medication-state, confirming that dopaminergic medications do not necessarily ‘normalize’ Parkinson’s disease related connectivity changes. Rather, these medications uniquely alter connectivity by decreasing connectivity with the striatum, SMA, and cerebellum and increasing connectivity between the right and left medial prefrontal cortex. We then determined that connections between the right putamen and PCC correlate with severity of bradykinesia/rigidity and that dopaminergic changes in this connection predict dopaminergic improvement in bradykinesia/rigidity severity. By contrast, connections with both the cerebellum and the SMA correlate with severity of tremor, but only dopaminergic changes in the connections with the SMA predict dopaminergic improvement in tremor severity. Together, these findings provide novel understanding of the distinct connections underlying Parkinson’s disease bradykinesia/rigidity and tremor.
4.1 Accuracy with covariance projection versus Pearson’s correlations
Applying our covariance projection approach resulted in a classification accuracy of 97% in distinguishing Parkinson’s disease OFF and ON, whereas directly using Pearson’s correlation as classification features attained a merely above chance accuracy of 51%. We observed similar accuracy gain with other datasets pertaining to different domains, namely classifying whether subjects were thinking happy thoughts as opposed to ruminating sad thoughts (Milazzo et al. 2014), separating connectivity patterns before and after a memory consolidation task (Ng et al. 2014), and distinguishing the subjects’ cognitive state in multiple self-driven tasks (Ng et al. 2016). Thus, the gain with the proposed approach was broadly observed. Importantly, to eliminate the possibility that there is a method-induced bias in our approach, we tested it on scans acquired at two sessions with no intervention in between. The chance level accuracy obtained confirms there is no method-induced bias. We note that the inferior classification performance in separating Parkinson’s disease from non-Parkinson’s disease was partly due to the smaller sample size and partly due to an important assumption in our approach (see Supplementary materials). In brief, the correlation matrices to be projected need to be close (i.e. similar) to the base correlation matrix. For the Parkinson’s medication-state case, the subject specific base correlation matrix estimated by concatenating the time series of the OFF and ON states would by construction be close to the correlation matrix of each of these states. In contrast, the base correlation matrix estimated from an independent set of matched HC participants would unlikely be close to all Parkinson’s disease OFF and HC correlation matrices due to the high inter-subject variability typically observed, hence the inferior classification performance. This distinction, however, highlights how this technique is particularly advantageous for within-subject paradigms. For instance, this covariance projection approach could provide unique
insight into changes in connectivity associated with disease-specific neurodegeneration if applied to longitudinal within-subject data.
4.2 Distinct connections for Parkinson’s medication-state versus disease-state
In this study, we sought to identify unique connections that distinguish Parkinson’s medication-state and disease-medication-state. To do this, we used an unbiased approach for defining ROIs without restricting our analysis to motor ROIs. Nevertheless, the majority of connections identified were associated with primary motor brain regions. The surprising finding was that the specific connections showing significance for classifying Parkinson’s disease OFF versus ON were essentially non-overlapping with the significant connections for classifying Parkinson’s disease OFF versus HC. Further, the directionality of the relationship was different in the two comparisons; the HC participants always had greater connectivity than Parkinson’s disease participants OFF, but only half the connections were greater when Parkinson’s disease participants were ON compared to OFF dopamine replacement. This dissociation suggests that dopamine replacement in Parkinson’s disease does not simply restore abnormal connectivity caused by the underlying disorder, but rather alters other brain connections. This is an important consideration for future resting state functional connectivity studies in Parkinson’s disease, as almost half of the published studies include patients only off dopamine or only on dopamine (Tahmasian et al. 2015). It has been argued that increased head movement occurs in patients not taking dopamine and therefore resting state fMRI studies should be collected when patients are taking dopamine to limit this confounder; however we found no significant differences in head motion between the two medications states (Supplemental Table). Indeed, Parkinson’s disease patients are more bradykinetic when they are off of their medications and therefore show less
random movements; however dampening tremor transmission to the head is necessary to control unwanted movement. Our data argues that the confounding effects of dopamine replacement are diffuse and nonlinear, and therefore need to be seriously considered in all Parkinson’s disease fMRI studies. Finally, it is worth noting that only some of the identified connections are associated with clinical benefit with dopaminergic medications (Supplemental Fig. 5). Most strikingly, between right and left putamen connectivity distinguished HC from Parkinson’s disease, but was not associated with tremor severity, bradykinesia/rigidity severity, or medication responsiveness. Thus, our data confirm that connectivity changes associated with the primary disease-state are not necessarily associated with the specific motor manifestations of the disease.
4.3 Dopamine-associated connectivity in Parkinson’s disease
We found four connections with lower connectivity when Parkinson’s disease patients were ON dopaminergic medications, each of which connected a motor region (striatum, cerebellum, SMA/pre-motor cortex) to a posterior cortical integration hub, including key regions of the default mode network (PCC and angular gyrus) (Greicius et al. 2003) and the salience network (insula) (Menon and Uddin 2010). Dopaminergic modulation of default mode connectivity has been shown in both task and resting state fMRI studies (de Leeuw et al. 2013; Delaveau et al. 2010; Flodin et al. 2012; Poston and Eidelberg 2012; Putcha et al. 2015), but the mechanisms are still poorly understood. The default mode network is considered a ‘task-negative’ network that deactivates during goal-oriented activities and is negatively correlated with other brain networks, such as the frontal executive network. One study found dopamine transporter availability modulates neural activity in the ventral parietal default mode network, such as the angular gyrus (Tomasi et al. 2009). The angular gyrus has rich structural connectivity throughout brain regions,
including the basal ganglia, the ventral premotor areas, the prefrontal cortex, and the PCC (Uddin et al. 2010). This region is greatly expanded in humans compared with non-human primates (Binder et al. 2009) and is considered a cross-modal hub where converging multisensory information is combined and integrated in order to comprehend and give meaning to stimuli while reorienting attention (Seghier 2013). Prior studies have found dopaminergic modulation of between network connectivity could influence motor learning (Argyelan et al. 2008), as well as other cognitive functions such as working memory (Braskie et al. 2011; Poston
et al. 2016b). Our study shows unique connections between default mode network and primary
motor regions, which are weaker when Parkinson’s disease patients take dopamine. We also found that dopaminergic changes to these connections correlated with dopaminergic improvement in motor symptoms. Future studies will focus on the relationship between these connections and non-motor symptoms.
By contrast, most of the connections displaying higher connectivity when Parkinson’s disease patients were ON medications included nodes in the frontal cortex (medial prefrontal cortex and middle frontal gyrus). There are substantial dopaminergic projections directly from the ventral tegmental area to the frontal cortex, as well as secondary projections through the anterior basal ganglia through the limbic loop. These projections are most associated with reward circuitry and addiction, however a recent autopsy study showed Parkinson’s disease related dopamine neuron degeneration in the ventral tegmental area, albeit less so than in the substantia nigra (Alberico et
al. 2015). In our study, the connectivity between the right and left medial prefrontal cortex was
specifically higher ON dopaminergic medication. This is in line with the ‘dopamine overdose’ hypothesis, which suggests that a dose of dopamine associated with beneficial motor effects can
overload the frontal cortex and cause deleterious effects on specific cognitive tasks (Vaillancourt
et al. 2013). Further studies investigating the relationship between connectivity changes ON
versus OFF dopamine and dopamine dependent cognitive tasks are needed to understand the repercussion of dopamine associated increased medial prefrontal cortex connectivity.
4.4 Connectivity association with bradykinesia/rigidity and tremor severity
Clinicopathological studies have shown that, unlike the other cardinal motor symptoms of Parkinson’s disease, tremor severity does not correlate with substantia nigra dopamine neuron degeneration at autopsy (Bernheimer H et al. 1973; Jellinger 1999; Paulus and Jellinger 1991; Rinne 1991). Therefore, it is hypothesized that tremor has a unique pathophysiology from bradykinesia and rigidity (Zaidel et al. 2009), which is supported by clinical data (Jankovic and Kapadia 2001; Lewis et al. 2005; Stochl et al. 2008). For instance, bradykinesia and rigidity are more consistently and more dramatically responsive to dopaminergic medications compared to tremor (Marjama-Lyons and Koller 2000) suggesting that while dopamine deficiency is necessary for parkinsonian tremor, it is not sufficient. To explore potential differences in brain connectivity that might explain this phenomenon, we correlated the significant classification connections with the Bradykinesia/Rigidity Subscore and the Tremor Subscore separately. To minimize bias, we performed this analysis on an independent cohort of Parkinson’s disease patients. Indeed, we found only two connections correlate with both Subscores, whereas four connections correlate with bradykinesia/rigidity severity, but not tremor, and five connections correlate with tremor severity, but not bradykinesia/rigidity. Thus, our data support both overlapping and distinct connections associated with the cardinal motor manifestations of Parkinson’s disease.
One proposed mechanism for the motor dichotomy between tremor and bradykinesia/rigidity in Parkinson’s disease are differences in cerebello-thalamo-cortical versus striatal-thalamo-cortical circuitry (Dirkx et al. 2017; Helmich et al. 2011; Lewis et al. 2011). We found that, in addition to the cerebellum-PCC connection, the SMA-angular gyrus, SMA-supramarginal gyrus, and SMA-occipital pole connections all correlated with tremor severity, whereas the putamen-PCC connection had the strongest correlation with bradykinesia/rigidity. The cerebellum and SMA have been identified as critical to Parkinson’s disease tremor production using several diverse imaging techniques. For instance, a Parkinson’s disease tremor-specific spatial-covariance pattern was recently described using FDG-PET, which includes increased metabolic activity in the anterior cerebellum and dentate nucleus (Mure et al. 2011), and motor task fMRI studies have shown increased activation in the SMA in tremor dominant compared to non-tremor dominant patients (Prodoehl et al. 2013). Recent work showing cerebello-thalamic activity co-fluctuates with tremor amplitude has led to the hypothesis that dopamine depletion causes pathological activity in basal ganglia circuits, which via cortical motor regions, including the SMA, then triggers tremor-related activity in cerebello-thalamo-cortical circuits (Helmich et al. 2011; Helmich et al. 2012). Similar to other studies (Festini et al. 2015) we found that dopamine modulates cerebellar connectivity, however this connectivity change was not associated with dopaminergic symptomatic improvement. Our data is also consistent with studies showing the SMA is modulated in Parkinson’s disease patients ON compared to OFF dopamine (Esposito et
al. 2013) and that SMA resting state activity correlates with total motor score OFF dopamine.
We additionally found that the dopaminergic changes in SMA connectivity specifically predict dopaminergic tremor improvement. Together our data suggest the SMA and the cerebellum have
different functions within the cerebello-thalamo-cortical loop; while the cerebellum is critical to Parkinson’s disease tremor generation, it is the SMA that modulates dopaminergic responsiveness to tremor.
4.5 Strengths and limitations
Our study has several strengths. With regard to patient selection and clinical assessments, strict enrollment criteria was used and all Parkinson’s disease patients met diagnostic criteria for ‘Clinically Probable Parkinson’s disease’ using the recent published guidelines (Postuma et al. 2015). In addition, all motor assessments were done by the same rater using consistent OFF and ON medication protocols. Methodologically, we used a novel classification approach based on Riemannian geometry, which had remarkably improved classification accuracy over traditional methods based on Pearson’s correlations (96.9±5.9% versus 50.7±12.2%, respectively). In addition, we employed rigorous statistical techniques at every step of the analysis, most notably assessing our significant connections on an independent cohort of patients to determine the relationship with symptom severity. However, while the independent cohort and the classification cohort had equivalent motor severity scores, the independent cohort was older (72.4 ±7.2 and 66.1 ±8.7, p = 0.04). To minimize this potential limitation we controlled for age in the partial correlation analysis between significant connections and motor symptom severity. We are also limited by the small sample size in our Parkinson’s disease OFF versus HC classification cohort (20 participants in each group), which could account for the lower classification accuracy. To ensure that the reported classification results are not driven by a specific selection of subjects for training and testing, we randomly divided the subjects in 10,000 different ways, as opposed to a 10-fold cross-validation. Using this large number of random
splits well captures how classification performance varies with different subsets of subjects for training and testing. As for discriminative connection identification, the adopted approach involves bootstrapping the participants in 500 different ways (as described in the supplementary materials), which takes into account how the highly weighted connections vary with different subject subsets. Therefore, we have taken specific measures to deal with the small sample size. Further, our decision to use the anatomically-defined basal ganglia nuclei in the Harvard Oxford atlas, which are rather coarse, could have reduced our sensitivity for identifying Parkinson’s disease-state or medication-state changes within these nuclei. Indeed, Parkinson’s related pathology is not uniform throughout these nuclei and prior studies have identified important changes in striatal inter-connectivity loss in Parkinson’s disease OFF dopaminergic medications (Bell et al. 2015). However, more detailed striatal subdivision would come at the expense of potentially lowering the signal-to-noise ratio of the basal ganglia nuclei time courses, since these nuclei are already smaller than other brain regions analyzed. Finally, we recognize the potential bias introduced from increased head motion in a patient population such as Parkinson’s disease (discussed above); however, in our cohort the between group differences in mean framewise displacement and maximum displacement were not statistically different. Further, besides motion correction, we further accounted for head motion in all participants using motion regressors and CompCor.
Acknowledgements
We thank Will Shirer, Matthew A. I. Ua Cruadhlaoich, Sophie YorkWilliams, David Everling, and Anisa Marshall for assistance with data acquisition.
Source of Funding
This research was supported by grants from the NIH/NIA (AG047366), NIH/NIAAA (AA023165), NIH/NINDS (NS075097, NS091461, NS086085, and NS071675), the Michael J. Fox Foundation for Parkinson’s disease Research, Lucile Packard Foundation for Children’s Health, NIH-NCATS-CTSA (TR001085), and the Child Health Research Institute of Stanford University.