HAL Id: hal-03012280
https://hal.archives-ouvertes.fr/hal-03012280
Submitted on 18 Nov 2020
HAL is a multi-disciplinary open access
archive for the deposit and dissemination of
sci-entific research documents, whether they are
pub-lished or not. The documents may come from
teaching and research institutions in France or
abroad, or from public or private research centers.
L’archive ouverte pluridisciplinaire HAL, est
destinée au dépôt et à la diffusion de documents
scientifiques de niveau recherche, publiés ou non,
émanant des établissements d’enseignement et de
recherche français ou étrangers, des laboratoires
publics ou privés.
Oxygen-reducing microbial cathodes in hypersaline
electrolyte
Mickaël Rimboud, Mohamed Barakat, Wafa Achouak, Alain Bergel,
Marie-Line Délia-Dupuy
To cite this version:
Mickaël Rimboud, Mohamed Barakat, Wafa Achouak, Alain Bergel, Marie-Line Délia-Dupuy.
Oxygen-reducing microbial cathodes in hypersaline electrolyte. Bioresource Technology, Elsevier, 2021, 319,
pp.0. �10.1016/j.biortech.2020.124165�. �hal-03012280�
OATAO is an open access repository that collects the work of Toulouse
researchers and makes it freely available over the web where possible
Any correspondence concerning this service should be sent
to the repository administrator:
[email protected]
This is an author’s version published in: http://oatao.univ-toulouse.fr/26899
To cite this version:
Rimboud, Mickaël
and Barakat, Mohamed and Achouak, Wafa and Bergel,
Alain
and Délia, Marie-Line
Oxygen-reducing microbial cathodes in
hypersaline electrolyte. (2021) Bioresource Technology, 319. ISSN
0960-8524
Oxygen-reducing microbial cathodes in hypersaline electrolyte
Micka¨el Rimboud
a, Mohamed Barakat
b, Wafa Achouak
b, Alain Bergel
a, Marie-Line D´elia
a,*aLaboratoire de G´enie Chimique, Universit´e de Toulouse, CNRS, INPT, UPS, All´ee Emile Monso, 31432 Toulouse, France
bLaboratoire d’Ecologie Microbienne de la Rhizosph`ere et des Environnements Extrˆemes (LEMIRE), BIAM, UMR 7265, CEA-CNRS-Aix Marseille Universit´e, CEA
Cadarache, 13108 Saint Paul Lez Durance, France
H I G H L I G H T S G R A P H I C A L A B S T R A C T •O2-reducing biocathodes were designed
in hypersaline media (NaCl 45 g/L). •Current density up to 2.2 A m− 2
was reached from potential value of 0.2 V/SCE.
•The biocathodes switched between operating two modes: maximum and stabilized.
•Gammaproteobacteria strains were essential to the electrocatalytic activity. •These strains were related to
Thio-halobacter thiocyanaticus.
A R T I C L E I N F O
Keywords:
Microbial fuel cell Biocathode Oxygen reduction Salt marsh sediments
Thiohalobacter thiocyanaticus
A B S T R A C T
Hypersaline electrolytes offer a way to boost the development of microbial fuel cells by overcoming the issue due to the low conductivity of the usual media. Efficient halotolerant bioanodes have already been designed but O2- reducing cathodes remain a strong bottleneck. Here, O2-reducing biocathodes were designed by using
salt marsh sediment as the inoculum and a hypersaline media (45 g/L NaCl) of high conductivity (10.4 S m− 1). Current density up to 2.2 A m− 2
was reached from potential of +0.2 V/SCE. The efficiency of the biocathodes was correlated to the presence of Gammaproteobacteria strain(s) related to Thiohalobacter
thiocyanaticus, which were considerably enriched in the best performing biocathodes. This work opens up new
perspectives to overcome the O2 reduction issue in hypersaline MFCs by designing efficient halotolerant
microbial cathodes and pointing out the strains that should now be focused to improve them.
1. Introduction
Microbial fuel cells (MFC) can convert to electrical power the chemical energy stored in the organic matter dissolved in effluents. This conversion is made possible by microbial biofilms self-assembled on the anode surface that catalyze the oxidation of the organic matter. Per-formance of MFCs have shown significant progress in the last ten years (Santoro et al., 2017) but the current density produced remains too low
to consider extrapolation of the technology to large-sized cells. A major issue is the high internal resistance of the cells due to the low ionic conductivity of the electrolytes that are commonly used (Oliot et al., 2016). High internal resistance provokes high ohmic drop, which causes considerable power loss in MFC. An appealing solution has been raised by the use of saline and hypersaline environments and effluents (Nam and Logan, 2011; Grattieri et al., 2017; Grattieri and Minteer, 2018). This kind of media is characterized by two antagonistic effects. The high * Corresponding author.
2
Reactors consisted of Schott containing 540 mL of medium
inoculated with 60 mL of salt marsh sediments. The medium derived from the Starkey medium and consisted of 0.5 g L−1 K
2HPO4, 1 g L−1
NH4Cl, 1 g L−1 Na2SO4, 0.1 g L−1 CaCl2⋅2H2O, 2 g L−1 MgSO4⋅7H2O, 45 g
L−1 NaCl. In some experiments, the medium was complemented with 50
mM of NaHCO3 to act as an additional inorganic carbon source. This
presence of NaHCO3 will be indicated when appropriate. The pH was
fixed at 7.0 in all reactors at the beginning of experiments. Air was continuously provided to the reactors via aquarium pumps equipped with porous frit in order to ensure permanent, gentle aeration. The so-lution in the reactors was thus maintained at saturation with air. The biocathodes were formed under constant polarization by using a three- electrode set-up. The working electrodes/cathodes consisted of a 6 cm2
of carbon felt (0.5 cm thickness) connected to coated titanium wires. Counter-electrodes were platinum meshes of 12 cm2 connected via platinum wires. Reference electrodes were saturated calomel electrode (SCE, from Biologic, France, +0.240 V vs SHE). All the electrodes were placed in the reactor, with the reference electrodes as close as possible to the working electrode (distance less than 0.5 cm) and the auxiliary electrode at least 10 cm away from the working electrode. All potentials are expressed with respect to SCE reference. Reactors were kept in a stove at 30 ◦C. The pH was regularly measured in all reactors throughout
the experiment, but not regulated.
2.3. Electrochemical measurements
Electrochemical measurements were performed under potentiostatic control using a multichannel potentiostat MPG2 from BioLogic, France, equipped with the EC-Lab software. Depending on experiments, working electrodes/biocathodes were polarized via chronoamperometry at +0.1 V or +0.3 V vs SCE and current was recorded vs time. These potential values were chosen with the aim of developing O2-reducing-biocathodes
with catalytic activity at high potential. At some point during the ex-periments, the polarization was stopped to let the biocathodes rest at open circuit potential (OCP) during 15 min and after that, cyclic vol-tammetry was recorded. The potential was scanned from OCP up to +0.5 V, down to − 0.6 V and back to OCP. The scan rate was 1 mV s−1 and two successive voltammograms were always recorded.
2.4. Population analyses
Biofilms were stripped from the electrode surfaces and resuspended in 15 mL of PBS by ultrasonication (15 min at 80 W, Fisher Scientific FB 15061). The biofilm suspensions were thereafter centrifugated and the solid material collected. DNA extraction was then performed using the extraction kit DNeasy PowerBiofilm from Qiagen (Netherlands). The DNA samples were sent to the Research and Testing Laboratory (RTLab – Lubbok, Texas, USA) for 454 pyrosequencing (Roche) by using 28F (5′-
GAG TTT GAT YMT GGC TC-3′) and 519R (5′-GWA TTA CCG CGG CKG
CTG-3′) primers.
Data were screened and trimmed on the basis of quality scores and bases below a quality threshold of 25 were discarded. Sequences with less than 250 nt and chimeric sequences were removed using UCHIME (Dowd et al., 2008; Edgar et al., 2011). The open source software QIIME was used to analyzed the filtered sequences (Caporaso et al., 2010), which were clustered into operational taxonomic units (OTUs) at 97% sequence similarity using uclust (Edgar, 2010). RDP classifier was used to perform the taxonomic assignment down to the genus level, with a 0.8 bootstrap cut-off, the most abundant sequence of an OTU being considered representative (Cole et al., 2009). The Greengenes database (release gg_13_8_otus), included with the RDP classifier, was used for the taxonomic affiliations.
2.5. ICP analysis
Iron and Sulphur elements were quantified by ICP analyses both in the native sediment (before experiment, i.e. before aeration and salinity increases the conductivity of the medium and lowers the internal
resistance of the fuel cell, on one hand. On the other hand, the high salinity reduces the viability of usual bacterial strains observed under ordinary, non-saline conditions. A recent review described the different works dealing with MFCs designed in various saline (0 to 1% w/v) to hypersaline (>3.5% w/v) environments (Grattieri and Minteer, 2018).
Several studies have shown the capacity of salt marsh sediments to design powerful bioanodes (Rousseau et al., 2016, 2015, 2014, 2013). The medium used in these studies was a hypersaline solution, containing up to 60 g.L− 1 of NaCl (6.0% w/v). The salt marsh sediment was the
source of efficient electroactive halotolerant bacterial strains. The bio-anodes were formed under constant polarization at +0.1 V/SCE and with continuous supply of sodium acetate as the substrate. Two main genera, Marinobacter and Desulfuromonas, were identified in the biofilms with a high degree of selection (Rousseau et al., 2014, 2016). The highest current densities, up to 85 A m− 2, were obtained with media
containing 45 g/L NaCl.
Most of the works devoted to the design of MFCs in hypersaline media (Grattieri and Minteer, 2018) have focused on the anodic part and used abiotic oxygen-reducing cathodes. These cathodes are generally based on platinum or cobalt porphyrins catalysts. Unfortunately, these catalysts are poorly efficient when implemented in MFC conditions, particularly because they lose most of their catalytic capacity at the pH values at the near-neutral pH values required in MFC. The poor effi-ciency of abiotic O2-reducing cathodes constitutes a major limiting
factor in the development of hypersaline MFCs. A recent study, which designed an MFC in a solution containing 62–65 g/L NaCl, has reported the formation of an efficient microbial cathode, which was not rate- limiting with respect to the anode (Roustazadeh Sheikhyousefi et al., 2017). In the context of hypersaline media, microbial cathodes may consequently afford a promising alternative to overcome the poor per-formance of abiotic cathodes. Nevertheless, this topic remains poorly documented.
The purpose of the present work is to check the capacity of salt marsh sediments to form O2-reducing microbial cathodes. Salt marsh
sedi-ments were chosen as the inoculum because of their capacity to form efficient microbial anodes with maximum performance in media that contained 45 g/L NaCl. The same medium was used here. The microbial cathodes were formed under constant polarization using three-electrode set-ups in order to characterize them accurately by avoiding most of the possible interactions that can occur in MFC. The experimental condi-tions used were similar to those used previously for the formation of microbial anodes (Milner et al., 2017, 2016), in particular the value of the applied potential was identical, equal to +0.1 V vs SCE. In this way, the O2-reducing biocathodes designed and characterized here should be
fully suited to be coupled with the bioanodes described previously. It should thus be possible in the next step to design a MFC with both the bioanode and the biocathode working in the same hypersaline electro-lyte of conductivity as high as 10.4 S.m− 1. The bacterial communities’
structure in the different biocathodes was analyzed by using 16S rRNA metabarcoding to give first insights in hypersaline O2-reducing biofilms.
2. Materials and methods
2.1. Sampling of the salt marsh sediments
Salt marsh sediments were taken from salt marshes located near Mediterranean Sea (Salins de Saint Martin, Gruissan, France). The sed-iments were kept in the lab at room temperature in a 50 L closed container and were used fresh during the two weeks following the sampling to avoid long-term anaerobic evolution that may alter their bacterial composition.
e. after 20 days of aeration and electrode polarization).
Samples of known masses of sediments were mineralized in several successive steps. A first dissolution of the samples by 5 mL of nitric acid 69% was realized for 12 h at room temperature, followed by 1 h warming at 95 ◦C. The dissolution was then completed by an addition of
2 mL of a solution of HCl and HNO3 69% (50% volume both) and a
second warming at 95 ◦C for two hours. The solutions were filtered after
cooling and the volume completed with ultrapure water in order to get 50 mL of final mineral solutions.
The solutions were analyzed using an ICP-OES Ultima 2 from Horiba (Japan). Sulfur quantification was measured at a wavelength of 180.676 nm. Iron quantification was measured at two different wavelengths 234.349 nm and 259.940 nm, as a way to evidence any matrix effect. 3. Results and discussion
3.1. Electrochemical performance
Twelve O2 reducing-biocathodes numbered from C1 to C12 were
designed and characterized. Five parameters were used to compare the biocathodes (Table 1):
- the lag time, which is the time required before a significant current density of oxygen reduction was observed; this threshold level was arbitrarily chosen at − 0.01 A m−2;
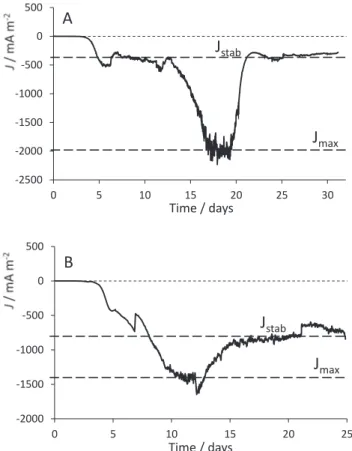
- the maximum (Jmax) and stabilized (Jstab) values of the current
density, as illustrated in Fig. 1;
- the total charge transferred from the cathode throughout the polar-ization time;
- the average daily charge transferred from the cathode during the polarization, lag time excepted.
In “standard” experimental conditions the biocathodes were formed in the modified Starkey medium that contained NaCl 45 g/L, under constant applied potential of +0.1 V vs SCE. Two other conditions, different from the standard one, were also tested: a medium com-plemented with NaHCO3 for the two biocathodes C9 and C10, and a
polarization potential of +0.3 V vs SCE for the two biocathodes C11 and C12. The addition of NaHCO3 was expected to increase the level of
inorganic carbon available, in order to stimulate the growth of auto-trophic bacterial strains on the cathodes and possibly its electrochemical performances. The polarization was increased to +0.3 V vs SCE in an
attempt to develop more efficient biocathodes able to reduce O2 at the
highest possible potential (Desmond-Le Qu´em´ener et al., 2016). We didn’t try to form biocathodes at open circuit, i.e. without applied po-tential, according to a previous work, which showed that this strategy was not efficient to form O2-reducing microbial cathodes (Rimboud
et al., 2017).
The biocathodes C1 to C8 were formed in standard conditions. They differed only by the duration of the polarization. Biocathodes C7 and C8 were stopped earlier, after 11.9 days of polarization, in order to compare the bacterial populations inside their electroactive biofilms to the pop-ulations of more mature electrodes of 20.1 days and more.
All the biocathodes displayed similar general behavior in term of lag time, stable and maximal current densities and charge transferred (Table 1). They differed only by the way they reached the maximum and stabilized current density values. The shorter duration of the polariza-tion of C7 and C8 explained their lower performance (current densities and charges exchanged). The highest current density value Jmax, − 2.2 A
m−2, was observed with C3. Its stabilized current density value (J stab)
however was lower than that displayed by other biocathodes, notably C2, whose stabilized current density reached − 0.91 A m−2. Regarding
the charges transferred by each electrode, the biocathode C6 exchanged up to − 953.2 C during the whole experiment time, when biocathode C3, though less performing in term of stabilized current density, exchanged up to − 44.4 C on daily basis.
The chronoamperometric record of the two best O2
-reducing-bio-cathodes, C3 and C6, are displayed in Fig. 1. As illustrated by the dashed lines, two significant levels of current density were observed. The maximal current density (Jmax) reached by the two biocathodes was
− 2000 and − 1400 mA m−2 for C3 and C6, respectively. These maxima were always sustained for several days, showing that they corresponded to specific operating periods of the biocathodes and not to experimental events. After reaching the maxima, reduction current densities started to
Table 1
Characteristics of the twelve O2-reducing biocathodes. The last column indicates
whether or not the microbial population of the biocathode was analyzed by 16S- rRNA pyrosequencing. Duration Time (days) Lag Time (days) Jmax (mA m−2) Jstab (mA m−2) Total charge (C) Daily charge (C day−1) DNA C1 31.1 2.5 − 1100 −860 −871.7 −30.5 Yes C2 20.1 3.3 − 1500 −910 −766.6 −33.1 No C3 31.1 2.8 − 2000 −350 −920.2 − 44.4 Yes C4 17.9 4.7 − 800 −630 −252.1 − 19.1 No C5 24.9 2.1 − 1000 −600 −637 − 27.9 Yes C6 24.9 2.7 − 1400 −850 −953.2 − 42.9 Yes C7 11.9 3.3 − 310 −250 −80.4 − 9.3 Yes C8 11.9 2.3 − 700 −400 −200.6 − 20.9 Yes C9* 30.7 12.4 − 610 −590 −293.0 − 16.0 Yes C10* 30.7 15.1 − 65 −18 −21.5 − 1.4 Yes C11** 24.9 12.5 − 20 +3 +2.7 +0.2 No C12** 24.9 _ +2 +4 +5.2 +0.2 No
*Reactor medium contained 50 mM NaHCO3 as additional inorganic carbon
source.
**Potential was poised at +0.3 V/SCE, instead of +0.1 V/SCE.
-2500 -2000 -1500 -1000 -500 0 500 0 5 10 15 20 25 30
J
stabJ
maxTime / days
A
-2000 -1500 -1000 -500 0 500 0 5 10 15 20 25J
maxJ
stabB
Time / days
Fig. 1. Evolution of the current density as a function of time under polarization at +0.1 V vs SCE. Values of maximal (Jmax) and stabilized (Jstab) current density
are materialized by dashed lines. A) biocathode C3, B) biocathode C6. electrode polarization) and in the residual sediment (after experiment, i.
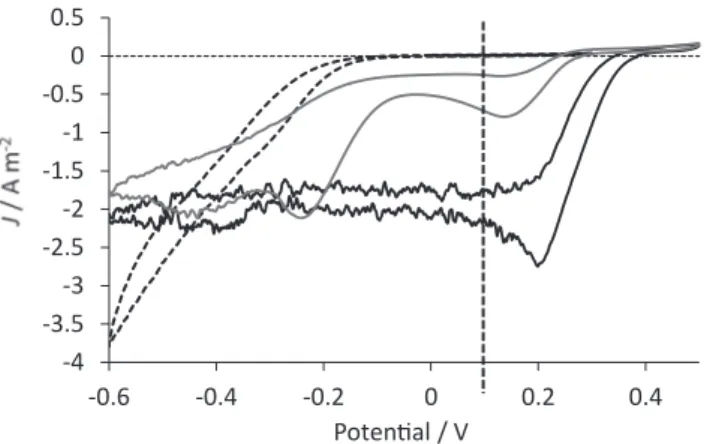
− 0.79 A m−2 was observed at +0.14 V vs SCE. Another signal was detected with a peak at − 0.24 V vs SCE. The observation of two distinct signals for oxygen reduction has already been described in previous works realized with compost leachate as inoculum (Desmond-Le Qu´em´ener et al., 2016; Rimboud et al., 2016). In these previous reports, the two electrochemical signals had two different behaviors: the signal at low potential (− 0.2 V vs SCE) was enduringly observed whatever the experimental conditions, while the signal at higher potential (+0.1 to +0.2 V vs SCE) was observed only when a higher polarization potential (0 V vs SCE or higher) was applied. The two reduction waves obtained here in hypersaline medium by polarization at +0.1 V vs. SCE were consistent with these previous reports.
The values of current density measured at +0.1 V vs. SCE on the voltammetric records were identical to the values of Jmax and Jstab
measured under chronoamperometry just before starting the voltam-metries. This means that the scan rate of 1 mV s−1 used for the
vol-tammetries was low enough to record the current densities produced by the biocathodes at steady state. The slow-rate voltammetries provided thus with a relevant characterization of the steady-state behavior of the biocathodes. The voltammetry at day 17 showed a great catalysis of the O2 reduction reaction, with a positive shift of the potential values of
around 600 mV. For instance, the value of 2 A m−2 was reached at
around − 0.40 V vs SCE with the initial clean electrode, while it was obtained from around +0.20 V vs. SCE with the 17-days old biocathode. Similar potential shift of around 600 mV was observed by considering the potential values at which the initial clean electrode and the 17-days old biocathode started to produce current. This considerable positive shift of potential points out the great promise hold by the biocathodes designed here when they operate in their maximum performance mode. The electrodes polarized at +0.3 V vs SCE, C11 and C12, barely
displayed any reduction current densities and their chronoampero-metric records remained close to 0. Consistently, the voltammetries did not show any significant catalytic effect. The biocathodes formed at +0.1 V vs SCE showed here remarkable O2-reducing capacity, while changing the applied potential to +0.3 V vs. SCE did not lead to any biofilm-based catalysis. As nearly no current was recorded with these biocathodes, their bacterial population was not analyzed thereafter.
The biocathodes formed with the medium supplemented with NaHCO3, C9 and C10, demonstrated both longer lag time and lower
current density productions compared to the electrodes without car-bonates (C1 to C8). The addition of NaHCO3 then resulted in no benefits
in term of current density production.
3.2. Discussion of the electrochemical performance in relation to the literature
Getting biocathodes able to reduce oxygen at high potential is crucial for the development of efficient MFCs, therefore high polarization po-tential were used to growth them. It was stated here that the applied potential of +0.1 V vs SCE was fully suitable to develop these bio-cathodes and increasing it to +0.3 V vs SCE was not successful. It has previously been observed that biocathodes formed under constant applied potential were more efficient when the applied potential was increased. For instance, increasing the applied potential from − 0.4 to +0.1 V vs. SCE significantly increased the current produce by O2 -reducing biocathodes formed with compost leachate used as the inoc-ulum (Desmond-Le Qu´em´ener et al., 2016). In contrast, a study using nitrifying sludge as the inoculum reported that changing the applied potential from − 0.2 V to +0.4 V vs SCE decreased the catalytic effect, as observed here (Rimboud et al., 2015). The results obtained here confirmed that the applied potential is a key factor for the formation of biocathodes. They also indicate that there is an upper limit to the pos-itive effect of the high values of applied potential, beyond which it is no longer possible to form efficient O2-reducing biocathodes. Here, the
value of +0.1 vs SCE was fully appropriate, while +0.3 V vs SCE was above the upper limit.
It is also interesting to note that efficient bioanodes have previously been designed in exactly the same medium and at the same applied potential of +0.1 vs SCE (Rousseau et al., 2013, 2016). For the formation of bioanodes, acetate was added as the substrate (electron donor) and the medium was maintained under anaerobic conditions. Here, the unique difference was the absence of acetate and the aerobic conditions. The applied potential was identical. The microbial electrodes formed in the hypersaline media used here have thus the possibility to act as anode or cathode at the same potential of +0.1 V vs SCE, depending only on the presence or the absence of acetate and oxygen in the medium, i.e. the presence/absence of an electron donor or an electron acceptor. These microbial electrodes should consequently be excellent candidates to form so-called bidirectional bioelectrodes (Jiang and Zeng, 2019).
Cyclic voltammetry of the efficient biocathode revealed a peak po-tential at +0.22 V vs SCE, which was similar to the one reported by
Milner et al. (2016), Milner and Yu (2018). They observed a peak for oxygen reduction at +0.25 V vs Ag/AgCl (+0.22 V vs SCE) (Milner et al., 2016) by using an inoculum coming from aerobic sludge treated by successive electrochemical enrichments. They reported current densities that reached in average − 2.04 A m−2 and culminated at − 3.5 A m−2
under aeration (O2 >7.0 mg L−1). This is one of the highest current
density reported in the literature for an O2-reducing biocathode, which
was obtained in common media consisting of phosphate buffer 50 mM whose ionic conductivity can be assessed to lower than 2.0 S m−1. The
biocathodes formed here, were able to rise to similar level of perfor-mance (− 2.0 A m−2) in a hypersaline medium that contained 45 g/L
NaCl with conductivity of 10.4 S m−1, which is around 1.5 times the
conductivity of seawater. Salt marsh was consequently an excellent inoculum to form O2-reducing biocathodes able to operate in
hypersa-line conditions.
-4
-3.5
-3
-2.5
-2
-1.5
-1
-0.5
0
0.5
-0.6
-0.4
-0.2
0
0.2
0.4
Potential / V
Fig. 2. Representative cyclic voltammograms recorded with biocathode C3. Dashed line: control voltammogram recorded at t = 0, before the development of an electroactive biofilm on the cathode; black line: voltammogram recorded when J = Jmax on day 17; grey line: voltammogram recorded when J = Jstab on
day 25. The polarization potential applied in chronoamperometry is material-ized by the vertical dashed line at +0.1 V vs SCE.
decrease and stabilized (Jstab) around − 350 and − 850 mA m− 2 for C3
and C6, respectively. The same general behavior with two different levels of current densities was observed with the eight biocathodes formed at +0.1 V vs SCE without NaHCO3 (C1 to C8).
The biocathodes were further investigated by voltammetry. Char-acteristic cyclic voltammograms recorded with biocathode C3 are pre-sented in Fig. 2.
A cyclic voltammetry was recorded on day 17 (black line) when the current density was in the Jmax phase. A peak-shaped signal for oxygen
reduction was observed at +0.22 V vs SCE. The peak current density reached − 2.8 A m− 2, which was the highest value observed during this
study. Another cyclic voltammogram was recorded on day 25 (grey line), when the current density observed under polarization was close to Jstab = − 0.35 A m− 2. A peak-shaped signal for oxygen reduction of
In the context of hypersaline media, the literature has recently re-ported a halotolerant O2-reducing biocathode, which operated in
solu-tion containing 62 to 65 g/L NaCl (Roustazadeh Sheikhyousefi et al., 2017). It produced 2 A m−2 at around − 0.30 V vs SCE (-0.27 vs Ag/AgCl
3 M). Considering the biocathode C3 designed here (Fig. 2), a positive shift of potential of around 500 mV is observed with respect to this previous study. This comparison points out the great promise hold by the present biocathodes. Obviously, the maximum operating period varied in great extent in terms of duration and current density from one bio-cathode to another. Efforts must now focus on understanding the evo-lution of these biocathodes between the two Jmax and Jstab levels with
the view to optimizing and stabilizing the maximum level. The great improvement observed with the best-performing biocathode with respect to the state of the art justifies future research in this direction.
In all the experiments, the current density switched between two levels, Jmax and Jstab. The duration and magnitude of these levels varied
between the experiments. Nevertheless, a similar pattern was observed, with, in a first period, the highest level of current density, up to − 2.2 A m−2, which lasted up to a few days, and then the stabilized level, lower
in magnitude, but more enduring, which lasted up to the end of the polarization. The reasons for this behavior remain to be identified. Analysis of the bacterial communities demonstrated rather low differ-ences between young (C7-C8) and old biocathodes (C1-C6). Their composition remained quite similar. Therefore, it seems unlikely that the change in current density production could be linked to an evolution of the bacterial communities within the biofilms over time. The reasons for the changeover of the value between Jmax and Jstab are probably
related to a change in the physiological state of the bacteria, the size of their population and possibly related to interactions between different bacterial populations within the biofilm. The biofilm ageing may also result in an increasing thickness. The bulk medium showed considerable changes, in pH and sulfate concentration notably, which could also impact the production of current and bacterial functions.
3.3. Evolution of the bulk medium
pH measurements revealed two different evolutions depending on the presence or not of NaHCO3 in the medium. In the ten reactors that
had not been complemented with NaHCO3, the pH decreased from 7.0 at
the starting of the experiment to reach a stable value around 6.4 ± 0.3 after 10 days. In the two reactors complemented with NaHCO3, the pH
increased from 7.0 to reach 8.8 ± 0.1 after 5 days, then decreased slightly and stabilized at 7.6 ± 0.3 after 30 days. In the presence of HCO3−, the decomposition into carbon dioxide and hydroxide ions,
which was activated by the forced aeration, explains the pH increase observed during the first days.
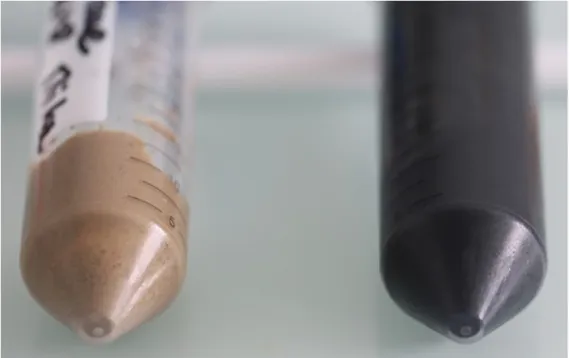
At the same time and for both conditions, the visual aspect of the sediments inside the reactors changed from a dark and black appear-ance, characteristic of the presence of iron sulfide FeS, to a clear, brown sand appearance (see picture in Supplementary data). ICP measure-ments were performed on the native, black sediment and the aerated, brown sediment obtained at the end of the experiments (Table 2).
The composition of the sediment at the beginning and at the end of the biocathode formation was different in both iron and sulfur contents. The proportions of iron and sulfur decreased by 34.2% and 70.3%, respectively. This confirms that the change in the sediment aspect was due to the oxidation of iron sulfide. This oxidation released sulfate
anions and Fe2+cations, which were oxidized, leading to the formation
of Fe3+ions. Fe3+then reacted with water, leading to the precipitation
of iron hydroxide Fe(OH)3, following the equation:
Fe3++3H
2O→Fe(OH)3+3H
+ (1)
This formation of iron hydroxide, which released 3 protons per iron ion explains the pH acidification observed. The precipitation of iron hydroxide may also explain the difference between the proportion of elemental iron and sulfur inside the aerated sediment (34.2 vs 70.3%). Control experiments were performed with an open-circuit reactor on one side and a reactor treated with 10 µM of chloramphenicol to inhibit any microbial activity on the other side. Both reactors showed a similar evolution in pH and aspects of the sediment. They showed that the evolution of the solution was neither linked to the electrochemical re-actions, on the working and counter-electrodes, nor to the microbial activity. The chemical composition of the bulk solutions evolved spon-taneously. The oxidation of FeS, the release of Fe3+and the
decompo-sition of HCO3−, when present, can fully explain the change in solution
aspect and the pH evolution. In return, this evolution may affect mi-crobial behavior and thus impact the production of current as a function of time.
3.4. Microbial population analyses
The Gini-Simpson and the Shannon diversity indexes corresponding to the eight biofilms are compiled in Table 3.
The Gini-Simpson index represents the probability of interspecific encounter; if null, it indicates that only one species is represented in the sample. Gini-Simpson index ranged from 0.70 with C6 to 0.94 with C1 and C10. Most values of the Gini-Simpson index ranged between 0.84 and 0.94; only biocathode C6 had a significantly lower index of 0.70. Its biofilm microbial community tended to be more dominated by a single species than the other biocathodes. Similar observations were made with the Shannon index, which mostly ranged from 2.82 (C5) to 3.34 (C10) with C6 displaying the lowest value of 2.05. Interestingly, no other significant difference was observed between the different bio-cathodes whatever the experimental conditions of their formation. Biocathodes C9 and C10 designed in the presence of NaHCO3 displayed
indexes similar to the biocathodes formed without NaHCO3.
Bio-cathodes C7 and C8 whose polarization was stopped earlier (11.9 days) also displayed similar indexes than the biocathodes (C1 to C6) polarized during a longer duration (20.1 days and more). It indicates that the diversity of the population inside the electro-active biofilms was already well-established after 11.9 days of polarization.
The most represented bacterial orders on the eight analyzed bio-cathodes are presented in Fig. 3.
Proteobacteria and Bacteroidetes were the most represented phyla on the eight electrodes. Flavobacteriales were the most abundant among Bacteroidetes and Proteobacteria of the Alpha- and Gamma- classes the most abundant among the Proteobacteria. Rhodobacterales (Alphapro-teobacteria), Alteromonadales, Oceanospirillales and an unidentified Gammaproteobacteria dominated among Proteobacteria.
Different trends were observed for the biocathodes depending on the experimental conditions. Bacteroidetes (Flavobacteriales and other) and Gammaproteobacteria were found in higher proportion in biocathodes formed with NaHCO3 in the medium (C9-C10). Alphaproteobacteria
(Rhizobiales, Rhodobacterales and other) were more abundant in the biocathodes formed without NaHCO3 in the medium (C1-C8). Table 2
Mass of iron and sulfur element measured by ICP in the native and aerated sediment in mg g−1.
Sample Iron Sulfur 80.676 nm
234.349 nm 259.940 nm
Native sediment 9.09 9.13 3.50 Aerated sediment 5.94 6.06 1.04
Table 3
Gini-Simpson and Shannon indexes for the eight biofilms analyzed by pyrosequencing.
Indexes C1 C3 C5 C6 C7 C8 C9 C10 Gini-Simpson 0.94 0.90 0.87 0.70 0.93 0.86 0.84 0.94 Shannon 3.28 2.94 2.82 2.05 3.27 2.88 2.54 3.34
Among Gammaproteobacteria, differences were observed between biocathodes formed with or without NaHCO3 in the medium.
Bio-cathodes designed in absence of NaHCO3 (C1-C8) were characterized by
the presence of an unidentified Gammaproteobacteria, which was not detected on the biocathodes formed in presence of NaHCO3 (C9-C10).
The corresponding sequences numbered from 5.0% of the whole se-quences on C1 to 52.6% on C6. The prevalence of this unidentified Gammaproteobacteria on C6 compared to the other cathodes explains the lower values of the diversity index observed with this cathode, as the microbial community was dominated by this single taxa. Alter-omonadales and Oceanospirillales dominated on biocathodes designed in presence of NaHCO3: Alteromonadales represented 21.2 and 20.4%,
Oceanospirillales 34.2 and 5.7%, on C9 and C10 respectively. On the biocathodes designed in the absence of NaHCO3 and of similar age (C1,
C3, C5 and C6), Alteromonadales accounted for a maximum of 12,6% on C1 and Oceanospirillales represented a maximum of 2.2% on C5.
A significant difference was also observed depending on the duration of the polarization. Biocathodes C7 and C8 stopped earlier, after 11.9 days of polarization, were richer in Alteromonadales (25.8% on C7) and Oceanospirillales (12.3% on C7) than those stopped later, after 20.1 days of polarization or more. These proportions made them closer to C9 and C10. As counterpart, they were poorer in Alphaproteobacteria other than Rhodobacterales and Rhizobiales than biocathodes C1 to C5. The proportion of the unidentified Gammaproteobacteria on C7 and C8, on the other hand, was not significantly different from the one observed on C1 to C5.
Bacteria for which identification at genus level was possible are lis-ted in table SI 2. Only genera representing >1% on at least one bio-cathode were listed. Several genera of the marine Roseobacter clade (Rhodobacteraceae) were identified indifferently on the different cath-odes: Phaeobacter, Roseovarius, Roseobacter, Labrenzia, Pelagicola and
Lutimaribacter. Other genera of the same clade (Roseibacterium, Rose-ibium, Donghicola…) were also identified at less than 1% on one or more
electrodes. Three genera from the order Alteromonadales, Marinobacter,
Idiomarina and Pseudoalteromonas were observed on the different
elec-trodes and genus Marinobacter was the most or at least the second most represented genus on most of the biocathodes (from 5.5 to 19.4%), with the notable exception of C5. Two phylogenetically close genera from the family Alcanivoracaceae (order Oceanospirillales), Alcanivorax and
Kangiella, were identified in rather high proportion on C7, C9 and C10.
3.5. Discussion of the biocathode microbial populations in relation to the literature
Most of the bacterial genera and orders identified in majority inside the different biocathodes are involved in various biogeochemical cycles. As it was the case here, notable proportions of Marinobacter (1.7 to 19.4%) and other phylogenetically related bacteria (other Alter-omonadales) have been detected in previous examples of O2-reducing
biocathodes designed with marine media (seawater, sediments…) (Strycharz-Glaven et al., 2013; Debuy et al., 2015; Wang et al., 2015a, 2015b). Marinobacter are known as opportunistic colonizers inside electroactive biofilms and have been detected in significant proportions in both anodic (Rousseau et al., 2014, 2016) and cathodic biofilms (Strycharz-Glaven et al., 2013; Debuy et al., 2015; Wang et al., 2015b). Some Marinobacter species, like Marinobacter santoriniensis, have a role in bio-geochemical cycles (Handley et al., 2009). A recent work with
Marinobacter atlanticus suggested a role of trace mineral elements in the
activity of electroactive biofilms (Onderko et al., 2019). Marinobacter
adhaerens is known to produce high quantity of exopolysaccharides
(EPS) and has been evidenced as an usual constituent of the electroactive biofilms grown under chlorinated conditions on the surface of copper alloys (Carvalho et al., 2014). Here, Marinobacter sp. (and Alter-omonadales) were detected in higher proportions on the young (C7 and C8) than on the old biocathodes (C1 to C6). This could be related to their heterotrophy: as they require organic carbon for their growth, they would be at the long term disadvantage as no organic carbon source was provided in the medium.
Bacteria from the Roseobacter clade of the family Rhodobacteraceae were also identified in great proportion in the different biofilms. This clade groups versatile bacteria able to grow chemoorganotrophically and/or photoheterotrophically (aerobic anoxygenic phototrophic bac-teria) with some species capable of autotrophy. They usually are inor-ganic sulfur oxidizers and have a great importance in the bio- geochemical sulfur and carbon cycles. They are also known to be among the firstly-adherent bacteria during the constitution of marine biofilms (Dang et al., 2008; Elifantz et al., 2013). Their presence could therefore be linked both to their affinity to solid matrix to constitute biofilms and to their ability to survive in conditions where the avail-ability of organic matter is low, as in the context of O2-reducing
bio-cathodes. Moreover, sulfur cycling by sulfur-reducing bacteria and purple non-sulfur bacteria has been speculated to be involved in the
Fig. 3. Most represented bacterial orders in the eight bacterial biofilms. Categories labelled as « other » regrouped less abundant bacterial orders and sequences identified at the immediately higher taxonomic level (for example sequences belonging to order Chromatiales are grouped with sequences classified as Gammap-rotobacteria without lower assignation at the order level in “other Gammaproteobacteria”).
4. Conclusion
The use of salt marsh sediment as the inoculum allowed the design of efficient O2-reducing biocathodes, which produced current densities up
to 2.0 A m−2 for several days, in hypersaline media with ionic
conduc-tivity of 10.4 S m−1. These biocathodes will be fully suitable to be
coupled with the bioanodes formed previously in the same medium at the same value of the applied potential of +0.1 V vs SCE. Among the dominating species, one (or more?) Gammaproteobacteria strain(s) related to Thiohalobacter thiocyanaticus were enriched in higher pro-portion than the other strains, in correlation with the electrochemical efficiency of the biocathodes.
CRediT authorship contribution statement
Micka¨el Rimboud: Conceptualization, Methodology, Investigation, Writing - original draft, Writing - review & editing. Mohamed Barakat:
Validation, Investigation. Wafa Achouak: Validation, Writing - review & editing, Supervision. Alain Bergel: Conceptualization, Writing - original draft, Writing - review & editing. Marie-Line D´elia: Concep-tualization, Methodology, Validation, Investigation, Supervision. Declaration of Competing Interest
The authors declare that they have no known competing financial interests or personal relationships that could have appeared to influence the work reported in this paper.
Acknowledgments
This work supported by funding from the French state, managed by the Agence Nationale de la Recherche (ANR), within the framework of the Koropokkuru project (ANR-14-CE05-0004). We gratefully thanks M.-L. de Solan Bethmale (Laboratoire de G´enie Chimique) for achieving ICP analysis.
Appendix A. Supplementary data
Supplementary data to this article can be found online at https://doi. org/10.1016/j.biortech.2020.124165.
References
Caporaso, J.G., Kuczynski, J., Stombaugh, J., Bittinger, K., Bushman, F.D., Costello, E.K., Fierer, N., Pena, A.G., Goodrich, J.K., Gordon, J.I., Huttley, G.A., Kelley, S.T., Knights, D., Koenig, J.E., Ley, R.E., Lozupone, C.A., McDonald, D., Muegge, B.D., Pirrung, M., Reeder, J., Sevinsky, J.R., Tumbaugh, P.J., Walters, W.A., Widmann, J., Yatsunenko, T., Zaneveld, J., Knight, R., 2010. QIIME allows analysis of high- throughput community sequencing data. Nat. Methods 7, 335–336. https://doi.org/ 10.1038/nmeth.f.303.
Carvalho, M.L., Doma, J., Sztyler, M., Beech, I., Cristiani, P., 2014. The study of marine corrosion of copper alloys in chlorinated condenser cooling circuits: The role of microbiological components. Biocorrosion 97, 2–6. https://doi.org/10.1016/j. bioelechem.2013.12.005.
Cole, J.R., Wang, Q., Cardenas, E., Fish, J., Chai, B., Farris, R.J., Kulam-Syed- Mohideen, A.S., McGarrell, D.M., Marsh, T., Garrity, G.M., Tiedje, J.M., 2009. The ribosomal database project: improved alignments and new tools for rRNA analysis. Nucleic Acids Res. 37, D141–D145. https://doi.org/10.1093/nar/gkn879. Daghio, M., Gandolfi, I., Bestetti, G., Franzetti, A., Guerrini, E., Cristiani, P., 2015.
Anodic and cathodic microbial communities in single chamber microbial fuel cells. New Biotechnol. 32, 79–84. https://doi.org/10.1016/j.nbt.2014.09.005. Dang, H., Li, T., Chen, M., Huang, G., 2008. Cross-ocean distribution of Rhodobacterales
bacteria as primary surface colonizers in temperate coastal marine waters. Appl. Environ. Microbiol. 74, 52–60. https://doi.org/10.1128/AEM.01400-07. Debuy, S., Pecastaings, S., Bergel, A., Erable, B., 2015. Oxygen-reducing biocathodes
designed with pure cultures of microbial strains isolated from seawater biofilms. Int. Biodeterior. Biodegrad. 103, 16–22. https://doi.org/10.1016/j.ibiod.2015.03.028. Desmond-Le Qu´em´ener, E., Rimboud, M., Bridier, A., Madigou, C., Erable, B., Bergel, A.,
Bouchez, T., 2016. Biocathodes reducing oxygen at high potential select biofilms dominated by Ectothiorhodospiraceae populations harboring a specific association of genes. Bioresour. Technol. 214, 55–62. https://doi.org/10.1016/j.
biortech.2016.04.087.
Dowd, S.E., Callaway, T.R., Wolcott, R.D., Sun, Y., McKeehan, T., Hagevoort, R.G., Edrington, T.S., 2008. Evaluation of the bacterial diversity in the feces of cattle using 16S rDNA bacterial tag-encoded FLX amplicon pyrosequencing (bTEFAP). BMC Microbiol. 8, 125.
Eddie, B.J., Wang, Z., Hervey, W.J., Leary, D.H., Malanoski, A.P., Tender, L.M., Lin, B., Strycharz-Glaven, S.M., 2017. Metatranscriptomics supports the mechanism for biocathode electroautotrophy by “Candidatus Tenderia electrophaga. mSystems 2.
https://doi.org/10.1128/mSystems.00002-17.
Edgar, R.C., 2010. Search and clustering orders of magnitude faster than BLAST. Bioinformatics 26, 2460–2461. https://doi.org/10.1093/bioinformatics/btq461.
Edgar, R.C., Haas, B.J., Clemente, J.C., Quince, C., Knight, R., 2011. UCHIME improves sensitivity and speed of chimera detection. Bioinformatics 27, 2194–2200. Elifantz, H., Horn, G., Ayon, M., Cohen, Y., Minz, D., 2013. Rhodobacteraceae are the key
members of the microbial community of the initial biofilm formed in Eastern Mediterranean coastal seawater. FEMS Microbiol. Ecol. 85, 348–357. https://doi. org/10.1111/1574-6941.12122.
Grattieri, M., Minteer, S.D., 2018. Microbial fuel cells in saline and hypersaline environments: Advancements, challenges and future perspectives. Bioelectrochemistry 120, 127–137. https://doi.org/10.1016/j. bioelechem.2017.12.004.
Grattieri, M., Suvira, M., Hasan, K., Minteer, S.D., 2017. Halotolerant extremophile bacteria from the Great Salt Lake for recycling pollutants in microbial fuel cells. J. Power Sources 356, 310–318. https://doi.org/10.1016/j.jpowsour.2016.11.090.
catalysis of oxygen reduction in various biocathodes (Daghio et al., 2015; Rago et al., 2017), including biocathode formed in a hypersaline environment (Roustazadeh Sheikhyousefi et al., 2017). The presence of inorganic sulfur oxidizers bacterial genera observed here may be a further confirmation of this catalytic pathway.
Several sequences related to an unclassified Gammaproteobacteria were found in high proportion (5.0–52.6%) on the efficient biocathodes formed without NaHCO3 addition. Interestingly, these sequences were
absent from the C9 and C10 biocathodes, formed with NaHCO3, which
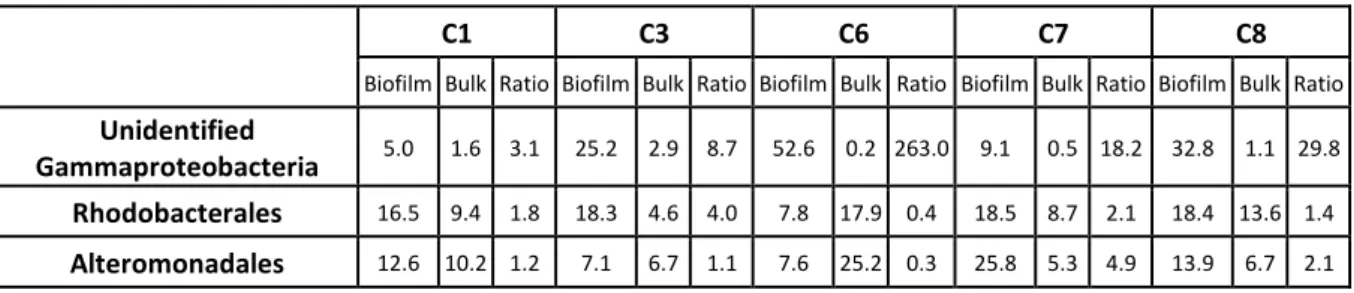
were electrochemically inefficient. Moreover, these bacteria were found in dramatically lower proportion in the bulk media compared to on the electrodes, as illustrated by the percentages of sequences affiliated to the unidentified Gammaproteobacteria inside both the electroactive bio-films and the corresponding bulk media, collected in table SI3. As a comparison, the ratios observed between the percentage of Rhodo-bacterales in the biofilms and in the bulk solution varied between 0.4 and 4.0 for C6 and C3. For Alteromonadales, it varied from 0.3 to 4.9 for C6 and C7. This ratio was considerably higher when looking for the unclassified Gammaproteobacteria, varying between 3.1 and 263 for respectively C1 and C6. It evidences a high enrichment of the unclassi-fied Gammaproteobacteria on the biocathodes and a strong affinity of the latter for the polarized surface. It is therefore very likely that these bacteria played a key-role in the electroactivity of the biocathodes.
Attempt was made to deepen the identification of these bacteria via alignment of the corresponding DNA sequences using the online Blast software. It led to the identification of sequences from the bacterium
Thiohalobacter thiocyanaticus as closest relatives (from 91.9 to 98.7%).
This species is rather isolated on the phylogenetic tree: it was identified as a Gammaproteobacteria but not classified at lower taxonomic level in the existing orders and families (Sorokin et al., 2010). To our knowl-edge, no close genetic relatives to this bacterium are known yet.
Thiohalobacter thiocyanaticus is a strictly chemo-autotrophic,
halo-philic sulfur-oxidizing bacterium isolated from the sediment of a saline lake (Sorokin et al., 2010). It performed inorganic carbon (CO2) fixation
via the Calvin-Benson cycle and the Rubisco enzyme. These character-istics are in accordance with the nature of the medium and inoculum used here. They are also in accordance with characteristics observed with bacteria already identified as “electro-autotrophic” (able to grow by fixing inorganic carbon using electrons supplied by a polarized electrode as sole energy source) (Ishii et al., 2015; Wang et al., 2015b; Eddie et al., 2017; Rimboud and Achouak, 2019). We can therefore postulate that the unclassified Gammaproteobacteria identified in the cathodic biofilms could be related to Thiohalobacter thiocyanaticus and a possible electro-autotrophic bacterium, which would have key-roles both as catalyst for O2 reduction and as inorganic carbon fixing agent
for the biofilm maintenance. It would be relevant to isolate this bacte-rium and test its ability to form biocathodes in order to validate our hypothesis.
arsenate-respiring and arsenite-oxidizing bacterium isolated from hydrothermal sediment. Int. J. Syst. Evol. Microbiol. 59, 886–892. https://doi.org/10.1099/ ijs.0.003145-0.
Ishii, T., Kawaichi, S., Nakagawa, H., Hashimoto, K., Nakamura, R., 2015. From chemolithoautotrophs to electrolithoautotrophs: CO2 fixation by Fe(II)-oxidizing bacteria coupled with direct uptake of electrons from solid electron sources. Front. Microbiol. 6, 994. https://doi.org/10.3389/fmicb.2015.00994.
Jiang, Y., Zeng, R.J., 2019. Bidirectional extracellular electron transfers of electrode- biofilm: Mechanism and application. Bioresour. Technol. 271, 439–448. https://doi. org/10.1016/j.biortech.2018.09.133.
Milner, E.M., Popescu, D., Curtis, T., Head, I.M., Scott, K., Yu, E.H., 2016. Microbial fuel cells with highly active aerobic biocathodes. J. Power Sources 324, 8–16. https:// doi.org/10.1016/j.jpowsour.2016.05.055.
Milner, E.M., Scott, K., Head, I.M., Curtis, T., Yu, E.H., 2017. Evaluation of porous carbon felt as an aerobic biocathode support in terms of hydrogen peroxide. J. Power Sources 356, 459–466. https://doi.org/10.1016/j.jpowsour.2017.03.079. Milner, E.M., Yu, E.H., 2018. The effect of oxygen mass transfer on aerobic biocathode
performance, biofilm growth and distribution in microbial fuel cells. Fuel Cells 18, 4–12. https://doi.org/10.1002/fuce.201700172.
Nam, J.-Y., Logan, B.E., 2011. Enhanced hydrogen generation using a saline catholyte in a two chamber microbial electrolysis cell. Int. J. Hydrog. Energy 36, 15105–15110.
https://doi.org/10.1016/j.ijhydene.2011.08.106.
Oliot, M., Galier, S., Roux de Balmann, H., Bergel, A., 2016. Ion transport in microbial fuel cells: Key roles, theory and critical review. Appl. Energy 183, 1682–1704.
https://doi.org/10.1016/j.apenergy.2016.09.043.
Onderko, E.L., Phillips, D.A., Eddie, B.J., Yates, M.D., Wang, Z., Tender, L.M., Glaven, S. M., 2019. Electrochemical characterization of marinobacter atlanticus strain CP1 suggests a role for trace minerals in electrogenic activity. Front. Energy Res. 7, 60.
https://doi.org/10.3389/fenrg.2019.00060.
Rago, L., Cristiani, P., Villa, F., Zecchin, S., Colombo, A., Cavalca, L., Schievano, A., 2017. Influences of dissolved oxygen concentration on biocathodic microbial communities in microbial fuel cells. Bioelectrochemistry 116, 39–51. https://doi. org/10.1016/j.bioelechem.2017.04.001.
Rimboud, M., Achouak, W., 2019. Electroautotrophy of Thioalkalivibrio nitratireducens. Bioelectrochemistry 126, 48–55. https://doi.org/10.1016/j.
bioelechem.2018.11.001.
Rimboud, M., Barakat, M., Bergel, A., Erable, B., 2017. Different methods used to form oxygen reducing biocathodes lead to different biomass quantities, bacterial communities, and electrochemical kinetics. Bioelectrochemistry 116, 24–32. https:// doi.org/10.1016/j.bioelechem.2017.03.001.
Rimboud, M., Bergel, A., Erable, B., 2016. Multiple electron transfer systems in oxygen reducing biocathodes revealed by different conditions of aeration/agitation. Bioelectrochemistry 110, 46–51. https://doi.org/10.1016/j.
bioelechem.2016.03.002.
Rimboud, M., Desmond-Le Quemener, E., Erable, B., Bouchez, T., Bergel, A., 2015. The current provided by oxygen-reducing microbial cathodes is related to the composition of their bacterial community. Bioelectrochemistry 102, 42–49. https:// doi.org/10.1016/j.bioelechem.2014.11.006.
Rousseau, R., Dominguez-Benetton, X., D´elia, M.-L., Bergel, A., 2013. Microbial bioanodes with high salinity tolerance for microbial fuel cells and microbial electrolysis cells. Electrochem. Commun. 33, 1–4. https://doi.org/10.1016/j. elecom.2013.04.002.
Rousseau, R., Rimboud, M., D´elia, M.-L., Bergel, A., Basseguy, R., 2015. Electrochemical characterization of microbial bioanodes formed on a collector/electrode system in a highly saline electrolyte. Bioelectrochemistry 106, 97–104. https://doi.org/ 10.1016/j.bioelechem.2015.06.011.
Rousseau, R., Santaella, C., Achouak, W., Godon, J.-J., Bonnafous, A., Bergel, A., D´elia, M.-L., 2014. Correlation of the electrochemical kinetics of high-salinity- tolerant bioanodes with the structure and microbial composition of the biofilm. ChemElectroChem 1, 1966–1975. https://doi.org/10.1002/celc.201402153. Rousseau, R., Santaella, C., Bonnafous, A., Achouak, W., Godon, J.-J., D´elia, M.-L.,
Bergel, A., 2016. Halotolerant bioanodes: The applied potantial modulates the electrochemical characteristics, the biofilm structure and the ration of the two dominant genera. Bioelectrochemistry 112, 24–32. https://doi.org/10.1016/j. bioelechem.2016.06.006.
Roustazadeh Sheikhyousefi, P., Nasr Esfahany, M., Colombo, A., Franzetti, A., Trasatti, S. P., Cristiani, P., 2017. Investigation of different configurations of microbial fuel cells for the treatment of oilfield produced water. Appl. Energy 192, 457–465. https:// doi.org/10.1016/j.apenergy.2016.10.057.
Santoro, C., Arbizzani, C., Erable, B., Ieropoulos, I., 2017. Microbial fuel cells: From fundamentals to applications. A review. J. Power Sources 356, 225–244. https://doi. org/10.1016/j.jpowsour.2017.03.109.
Sorokin, D.Y., Kovaleva, O.L., Tourova, T.P., Muyzer, G., 2010. Thiohalobacter thiocyanaticus gen. nov., sp nov., a moderately halophilic, sulfur-oxidizing gammaproteobacterium from hypersaline lakes, that utilizes thiocyanate. Int. J. Syst. Evol. Microbiol. 60, 444–450. https://doi.org/10.1099/ijs.0.012880-0.
Strycharz-Glaven, S.M., Glaven, R.H., Wang, Z., Zhou, J., Vora, G.J., Tender, L.M., 2013. Electrochemical investigation of a microbial solar cell reveals a nonphotosynthetic biocathode catalyst. Appl. Environ. Microbiol. 79, 3933–3942. https://doi.org/ 10.1128/AEM.00431-13.
Wang, Z., Eddie, B.J., Malanoski, A.P., Hervey, W.J., Lin, B., Strycharz-Glaven, S.M., 2015a. Complete genome sequence of Marinobacter sp. CP1, Isolated from a self- regenerating biocathode biofilm. Genome Announc. 3 https://doi.org/10.1128/ genomeA.01103-15 e-01103-15.
Wang, Z., Leary, D.H., Malanoski, A.P., Li, R.W., Hervey, W.J., Eddie, B.J., Tender, G.S., Yanosky, S.G., Vora, G.J., Tender, L.M., Lin, B., Strycharz-Glaven, S.M., 2015b. A previously uncharacterized, nonphotosynthetic member of the chromatiaceae is the primary CO2-fixing constituent in a self-regenerating biocathode. Appl. Environ. Microbiol. 81, 699–712. https://doi.org/10.1128/AEM.02947-14.
Oxygen-reducing microbial cathodes in hypersaline electrolyte
Mickaël Rimboud
1, Mohamed Barakat
2, Wafa Achouak
2, Alain Bergel
1, Marie-Line Délia
1*.
Supplementary Information
Figure SI 1.
Picture of the native, black (right) and aerated, brown (left) sediment. The native sediment
was the salt marsh sediment as sampled from the natural spot (Gruissan, France). The aerated
sediment was obtained from the native sediment after 20 days of aeration in the experimental
reactor.
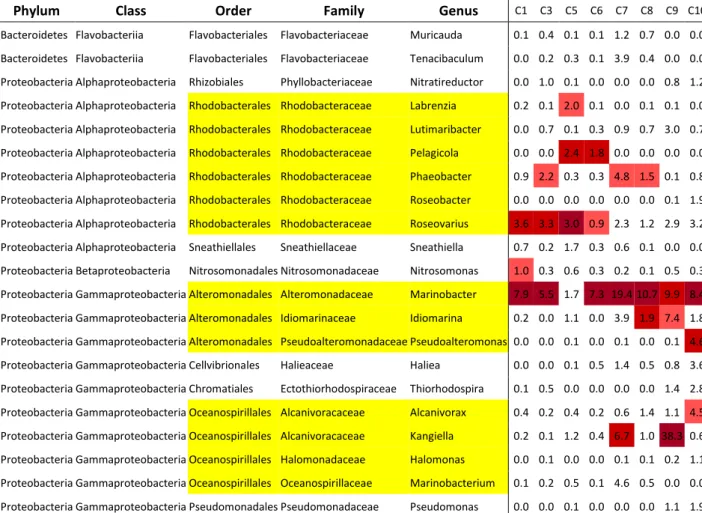
Figure SI 2
Table of the relative abundance of the different bacterial population on the eight
OR-biocathodes at genus level.
Only genera represented at least 1 % on at least one biocathode are presented. For each
biocathode, the proportion of the five more represented genera are highlighted in shades of
red. Genera related to Orders Rhodobacterales, Alteromonadales and Oceanospirillales are
highlighted in yellow.
Phylum
Class
Order
Family
Genus
C1 C3 C5 C6 C7 C8 C9 C10Bacteroidetes Flavobacteriia Flavobacteriales Flavobacteriaceae Muricauda 0.1 0.4 0.1 0.1 1.2 0.7 0.0 0.0 Bacteroidetes Flavobacteriia Flavobacteriales Flavobacteriaceae Tenacibaculum 0.0 0.2 0.3 0.1 3.9 0.4 0.0 0.0 Proteobacteria Alphaproteobacteria Rhizobiales Phyllobacteriaceae Nitratireductor 0.0 1.0 0.1 0.0 0.0 0.0 0.8 1.2 Proteobacteria Alphaproteobacteria Rhodobacterales Rhodobacteraceae Labrenzia 0.2 0.1 2.0 0.1 0.0 0.1 0.1 0.0 Proteobacteria Alphaproteobacteria Rhodobacterales Rhodobacteraceae Lutimaribacter 0.0 0.7 0.1 0.3 0.9 0.7 3.0 0.7 Proteobacteria Alphaproteobacteria Rhodobacterales Rhodobacteraceae Pelagicola 0.0 0.0 2.4 1.8 0.0 0.0 0.0 0.0 Proteobacteria Alphaproteobacteria Rhodobacterales Rhodobacteraceae Phaeobacter 0.9 2.2 0.3 0.3 4.8 1.5 0.1 0.8 Proteobacteria Alphaproteobacteria Rhodobacterales Rhodobacteraceae Roseobacter 0.0 0.0 0.0 0.0 0.0 0.0 0.1 1.9 Proteobacteria Alphaproteobacteria Rhodobacterales Rhodobacteraceae Roseovarius 3.6 3.3 3.0 0.9 2.3 1.2 2.9 3.2 Proteobacteria Alphaproteobacteria Sneathiellales Sneathiellaceae Sneathiella 0.7 0.2 1.7 0.3 0.6 0.1 0.0 0.0 Proteobacteria Betaproteobacteria Nitrosomonadales Nitrosomonadaceae Nitrosomonas 1.0 0.3 0.6 0.3 0.2 0.1 0.5 0.3 Proteobacteria Gammaproteobacteria Alteromonadales Alteromonadaceae Marinobacter 7.9 5.5 1.7 7.3 19.410.7 9.9 8.4 Proteobacteria Gammaproteobacteria Alteromonadales Idiomarinaceae Idiomarina 0.2 0.0 1.1 0.0 3.9 1.9 7.4 1.8 Proteobacteria Gammaproteobacteria Alteromonadales Pseudoalteromonadaceae Pseudoalteromonas 0.0 0.0 0.1 0.0 0.1 0.0 0.1 4.6 Proteobacteria Gammaproteobacteria Cellvibrionales Halieaceae Haliea 0.0 0.0 0.1 0.5 1.4 0.5 0.8 3.6 Proteobacteria Gammaproteobacteria Chromatiales Ectothiorhodospiraceae Thiorhodospira 0.1 0.5 0.0 0.0 0.0 0.0 1.4 2.8 Proteobacteria Gammaproteobacteria Oceanospirillales Alcanivoracaceae Alcanivorax 0.4 0.2 0.4 0.2 0.6 1.4 1.1 4.5 Proteobacteria Gammaproteobacteria Oceanospirillales Alcanivoracaceae Kangiella 0.2 0.1 1.2 0.4 6.7 1.0 38.3 0.6 Proteobacteria Gammaproteobacteria Oceanospirillales Halomonadaceae Halomonas 0.0 0.1 0.0 0.0 0.1 0.1 0.2 1.1 Proteobacteria Gammaproteobacteria Oceanospirillales Oceanospirillaceae Marinobacterium 0.1 0.2 0.5 0.1 4.6 0.5 0.0 0.0 Proteobacteria Gammaproteobacteria Pseudomonadales Pseudomonadaceae Pseudomonas 0.0 0.0 0.1 0.0 0.0 0.0 1.1 1.9
Figure SI 3
Table of the relative abundance of three different bacterial orders (Unidentified
Gammaproteobacteria, Rhodobacterales and Alteromonadales) inside the electroactive
biofilm and the corresponding bulk medium for five of the OR-biocathodes.
The ratios between the two relative abundances inside the biofilm and the bulk medium are
also indicated for each order and OR-biocathode.
C1
C3
C6
C7
C8
Biofilm Bulk Ratio Biofilm Bulk Ratio Biofilm Bulk Ratio Biofilm Bulk Ratio Biofilm Bulk Ratio