Coastal Communities and Climate Change:
A Dynamic Model of Risk Perception,
Storms, and Adaptation
by
Travis Read Franck
Submitted to the Engineering Systems Division
in partial fulfillment of the requirements for the degree of
Doctor of Philosophy in Technology, Management, and Policy
at the
MASSACHUSETTS INSTITUTE OF TECHNOLOGY
September 2009
c
⃝Travis Franck, 2009. Licensed under the Creative Commons Attribution-Noncommercial-Share Alike 3.0 US License.
The author hereby grants to MIT permission to reproduce and distribute publicly paper and electronic copies of this thesis document in whole or in part.
Author . . . .
Engineering Systems Division
September 2, 2009
Certified by . . . .
John D. Sterman
Jay Forrester Professor of Management and Engineering Systems
Thesis Supervisor
Certified by . . . .
Henry D. Jacoby
Professor of Management
Thesis Supervisor
Certified by . . . .
Robert J. Nicholls
Professor of Coastal Engineering
Thesis Supervisor
Accepted by . . . .
Nancy Leveson
Professor of Engineering Systems and Aeronautics & Astronautics
Chair, ESD Education Committee
Coastal Communities and Climate Change:
A Dynamic Model of Risk Perception,
Storms, and Adaptation
by
Travis Read Franck
Submitted to the Engineering Systems Division on September 2, 2009, in partial fulfillment of the
requirements for the degree of
Doctor of Philosophy in Technology, Management, and Policy
Abstract
Climate change impacts, including sea-level rise and changes in tropical storm frequency and intensity, will pose significant challenges to city planners and coastal zone managers trying to make wise investment and protection decisions. Meanwhile, policymakers are working to mitigate impacts by regulating greenhouse gas emissions. To design effective policies, policymakers need more accurate information than is currently available to understand how coastal communities will be affected by climate change.
My research aims to improve coastal impact and adaptation assessments, which inform climate and adaptation policies. I relax previous assumptions of probabilistic annual storm damage and rational economic expectations—variables in previous stud-ies that are suspect, given the stochastic nature of storm events and the real-world behavior of people. I develop a dynamic stochastic adaptation model that includes explicit storm events and boundedly rational storm perception. I also include endoge-nous economic growth, population growth, public adaptation measures, and relative sea-level rise.
The frequency and intensity of stochastic storm events can change a region’s long-term economic growth pattern and introduce the possibility of community decline. Previous studies using likely annual storm damage are unable to show this result.
Additionally, I consider three decision makers (coastal managers, infrastructure investors, and residents) who differ regarding their perception of storm risk. The decision makers’ perception of risk varies depending on their rationality assumptions. Boundedly rational investors and residents perceive storm risk to be higher imme-diately after a storm event, which can drive down investment, decrease economic
growth, and increase economic recovery time, proving that previous studies provide overly optimistic economic predictions. Rationality assumptions are shown to change economic growth and recovery time estimates.
Including stochastic storms and variable rationality assumptions will improve adap-tation research and, therefore, coastal adapadap-tation and climate change policies. Thesis Supervisor: John D. Sterman
Title: Jay Forrester Professor of Management and Engineering Systems Thesis Supervisor: Henry D. Jacoby
Title: Professor of Management Thesis Supervisor: Robert J. Nicholls Title: Professor of Coastal Engineering
Acknowledgments
I have met and been helped by many people on this journey. I appreciate everyone’s support and encouragement along the way, which made the travels much easier.
My committee was ever challenging and improving my analysis. John was a strong chair that provided professional and personal guidance, along with the expected su-perb modeling insights. Jake kept my research focused, well-defined, and he forced me to always have an eye toward my work’s importance in the broader literature. Robert “got it” from the beginning, understanding that integrating diverse topics had value. He redirected my attention toward community resiliency, even before I had formulated the concept.
MIT is home to many great researchers who are generous with their time. In the EAPS department, Professor Kerry Emanuel ran his CHIPS hurricane model to generate storm statistics for each of my three case studies. He was patient while I was defining my needs and prompt with the results. His data powers the storm portion of my model.
MIT’s Joint Program on the Science and Policy of Global Change is a world leader in integrated climate change research. I was fortunate to have their support for both the two years of my Masters and the four years of my PhD. Along with financial and administrative support, I have enjoyed working along side so many bright, dedicated individuals.
Many people provided valuable input in the form of interviews and presentation feedback. In particular, I would like to thank the US Army Corps personnel, includ-ing Don Resio, William Curtis, Nick Kraus, and Katherine White. Their first-hand knowledge of coastal adaptation projects improved my understanding coastal zone management in the United States. Richard Zingarelli (MA DCR) and Daisy Sweeney (FEMA) spent numerous hours helping me understand the finer points of the
Na-tional Flood Insurance Program, and why people do (and don’t) participate. Also, I would like to thank Geoff Withycombe for making me think twice about my results and their meaning regarding sustainability. Jan Corfee-Morlot provided me with important exposure and support, which I value greatly.
Friends and classmates were always there for a coffee or a beer. Over the years, Kate, Matt, Chris, Amul, John, Chintan, Kawika, and Michael, listened to many joys and frustrations. I look forward to more drinks and adventures, and to solving the world’s problem together.
My parents and brother and family have always been there for me, and this PhD was no exception. Thank you for providing a solid foundation on which I am continually building upon.
To Misha, my faithful, furry companion that started this educational adventure with me. You have been a patient and peaceful soul the entire way through, and yes, you deserve a walk and a treat.
To Marcy, my best friend, my love, and my strongest supporter. As usual, you went beyond the call of duty, proofreading early chapter drafts late into the night. Thank you for the emotional support and your undying belief in me. I look forward to many long years together.
Even with all the help and support I received, there are likely errors in these pages—those are all mine.
Contents
Abstract 3
1 Introduction 17
1.1 Motivation for the Research . . . 18
1.1.1 Climate and the coast . . . 18
1.1.2 Behavior and risk . . . 20
1.2 Present Research . . . 22
1.3 Dissertation Overview . . . 23
2 Climate Change and Coastal Adaptation 25 2.1 Climatic-induced Sea-Level Rise . . . 25
2.1.1 Global sea-level rise trends . . . 26
2.1.2 Relative sea-level rise factors . . . 28
2.2 Climate Change and Tropical Storms . . . 30
2.2.1 Tropical storm classification . . . 32
2.2.2 Storm surge . . . 32
2.3 Risk Perception and Decisions . . . 33
2.3.1 Perception anecdotes . . . 33
2.3.2 Perception literature . . . 34
2.3.3 Risk perception and climate adaptation . . . 35
2.4 Coastal Adaptation Economics . . . 36
2.4.1 Vulnerability studies . . . 36
2.4.2 Adaptation studies . . . 38
2.4.3 Storm representation in adaptation studies . . . 42
2.4.4 Handling of uncertainty and sensitivity . . . 43
2.4.5 Global data sets for economic studies . . . 44
2.5 Coastal Adaptation Options . . . 45
2.5.1 Public adaptation in the United States . . . 48
3 Model Description 53 3.1 Introduction and Overview . . . 53
3.2 Sea-Level Rise Forcing . . . 58
3.2.1 Global sea-level rise . . . 58
3.2.2 Relative sea-level rise . . . 63
3.3 Storm Events . . . 67
3.3.1 Storm arrivals . . . 68
3.3.2 Storm intensities . . . 68
3.3.3 Storm surge . . . 68
3.4 Risk Perception . . . 69
3.4.1 Perception of storm events . . . 70
3.5 Economy . . . 75 3.5.1 Capital . . . 76 3.5.2 Capital adjustment . . . 82 3.5.3 Price of output . . . 100 3.5.4 Labor . . . 102 3.6 Housing Stock . . . 110 3.6.1 Housing adjustment . . . 114
3.6.2 Rental price adjustment . . . 123
3.7 Population . . . 126
3.7.1 Births and deaths . . . 128
3.7.2 Immigration and emigration . . . 128
3.7.3 Community attractiveness feedbacks . . . 129
3.7.4 Evacuation and return . . . 133
3.8 Public Coastal Adaptation . . . 137
3.8.1 Perception of public adaptation . . . 138
3.8.2 Coastal managers’ protection choice . . . 138
3.8.3 Estimating the benefits of public adaptation . . . 141
3.8.4 Public adaptation height . . . 142
3.8.5 Levee construction . . . 143
3.8.6 Levee costs . . . 148
3.8.7 Beach nourishment construction . . . 150
3.8.8 Beach nourishment costs . . . 151
3.8.9 Public adaptation maintenance and effectiveness . . . 152
3.8.10 Public adaptation breaching . . . 154
3.9 Flooding and Damage Representation . . . 155
3.9.1 Long-term RSLR damage . . . 156
3.9.2 Storm damage representation . . . 157
3.10 Private adaptation . . . 160
3.10.1 Insurance . . . 161
3.10.2 Infrastructure mitigation . . . 164
3.11 Wetlands and RSLR Response . . . 165
4 Case Study Communities 169 4.1 Introduction . . . 169
4.2 Cape Cod . . . 172
4.2.1 Land constraints and development . . . 172
4.2.2 Wetlands . . . 173
4.2.3 Public adaptation decisions . . . 174
4.3.1 Land constraints and development . . . 175
4.3.2 Wetlands . . . 176
4.3.3 Public adaptation decisions . . . 177
4.4 St. Mary Parish . . . 178
4.4.1 Land constraints and development . . . 178
4.4.2 Wetlands . . . 179
4.4.3 Public adaptation decisions . . . 180
4.5 Determining Initial Parameters . . . 180
4.5.1 Relative sea-level change . . . 181
4.5.2 Coastal slope . . . 182
4.5.3 Storm distributions . . . 183
4.5.4 Economic parameters . . . 185
4.5.5 Land and development parameters . . . 188
4.5.6 Insurance and mitigation . . . 190
5 Reference Scenario Results 193 5.1 Introduction . . . 193
5.2 Reference Scenario . . . 193
5.3 Reference Behavior . . . 195
5.3.1 Reference SLR and storms . . . 196
5.3.2 Perception of storms and damage . . . 197
5.3.3 Gross economic output . . . 201
5.3.4 Capital . . . 203
5.3.5 Population and labor . . . 211
5.3.6 Adaptation responses . . . 217
5.4 Community Comparison . . . 221
5.5 Monte Carlo Analysis . . . 226
5.5.1 Economic growth rates . . . 227
5.5.2 Economic recovery time . . . 229
6 Sensitivity to Assumptions 233 6.1 Sensitivity to the Rationality Assumption . . . 233
6.1.1 Rationality Monte Carlo Results . . . 248
6.1.2 Rationality and economic growth rates . . . 249
6.1.3 Rationality and economic recovery time . . . 250
6.2 Sensitivity to Coastal Planner Rationality . . . 252
6.2.1 Monte Carlo Results . . . 253
6.3 Sensitivity to SLR Scenarios . . . 256
6.3.1 SLR and economic growth rates . . . 259
6.4 Sensitivity to Storm Scenarios . . . 260
6.4.1 Storms and economic growth rates . . . 263
7 Policy Scenario Results 269
7.1 Disaster Relief Policies . . . 269
7.2 Disaster relief scenario behavior . . . 270
7.3 Disaster Relief Monte Carlo Results . . . 274
7.4 Disaster relief and economic growth rates . . . 275
7.5 Disaster relief and economic recovery time . . . 276
8 Discussion and Conclusion 279 8.1 Importance of Stochastic Storms . . . 280
8.1.1 Storms increase economic growth rate variance . . . 280
8.1.2 Storms allow for recovery time studies . . . 281
8.1.3 Storms generate important economic dynamics . . . 282
8.1.4 Storms change development patterns . . . 283
8.1.5 Storm frequency and intensity interact . . . 283
8.1.6 Storms are more important than SLR . . . 284
8.2 Implications of Bounded Rationality . . . 285
8.2.1 Rationality and adaptation studies . . . 286
8.2.2 Rationality and economic growth rates . . . 287
8.2.3 Optimistic rationality assumptions . . . 287
8.3 Disaster Relief and Economic Growth Rates . . . 291
8.4 Generalizing Insights . . . 292
8.4.1 Application to communities in other regions . . . 292
8.4.2 Application to different adaptation models . . . 294
8.4.3 Aggregating to the nation-scale . . . 295
8.4.4 Integrating into a general equilibrium model . . . 297
8.5 Possible Research Extensions . . . 298
Bibliography 303 Abbreviations 313 Glosssary 315 A Storm Data Scripts 319 B Interviews 323 B.1 General Questions . . . 323
B.2 Questions for the US Army Corps of Engineers . . . 324
B.3 Interviewees . . . 326
List of Figures
2-1 Rates of Relative Sea-level Rise in US . . . 30
2-2 New Orleans Population (1940–2007) . . . 37
2-3 New Orleans Population (1995–2007) . . . 38
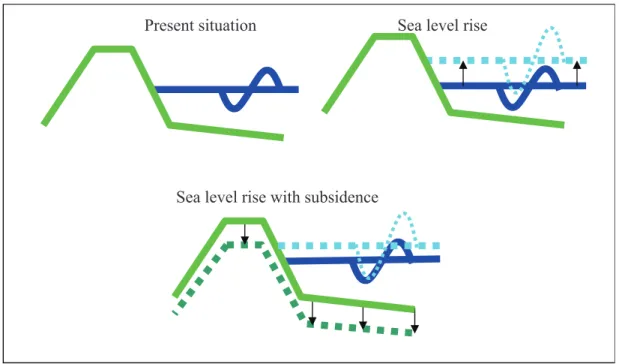
2-4 Illustration of SLR and Subsidence . . . 47
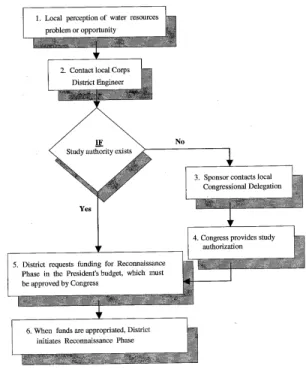
2-5 US Army Corps of Engineers Initial Project Steps . . . 48
2-6 US Army Corps of Engineers Project Phases . . . 49
3-1 High-level FRACC Model Diagram . . . 54
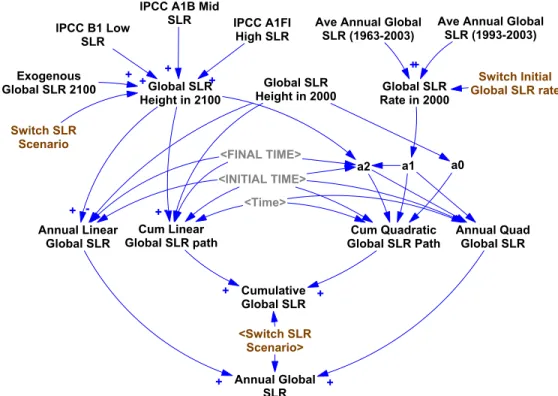
3-2 Sea-level Rise Structure . . . 60
3-3 Global Sea-level Rise Paths . . . 61
3-4 Cumulative RSLR Structure . . . 63
3-5 Annual RSLR Rates . . . 64
3-6 Perceived Storm Frequency Structure . . . 71
3-7 Perceived Frequency of Storms Behavior . . . 74
3-8 Capital Stock Structure . . . 77
3-9 Capital Adjustment Structure . . . 84
3-10 Land Availability Function . . . 86
3-11 Economic Output Trend Structure . . . 87
3-12 Return to Capital Structure . . . 90
3-13 Aggregate Demand Structure . . . 97
3-14 Price of Output Structure . . . 100
3-15 Labor and Jobs Structure . . . 104
3-16 Housing Stock Structure . . . 111
3-17 Housing Adjustment Structure . . . 117
3-18 Population Trend Structure . . . 120
3-19 Return to Housing Structure . . . 124
3-20 Rent Adjustment Structure . . . 125
3-21 Population Structure . . . 127
3-22 Occupancy Attractiveness Structure . . . 131
3-23 Occupancy Attractiveness Function . . . 131
3-24 Job Attractiveness Structure . . . 132
3-25 Job Attractiveness Function . . . 132
3-26 Storm Attractiveness Structure . . . 134
3-27 Storm Attractiveness Function . . . 134
3-28 Fraction Willing to Evacuate Function . . . 135
3-30 Levee Cost Structure . . . 149
3-31 Beach Nourishment Construction Structure . . . 151
3-32 Breaching Structure . . . 155
3-33 Fragility Curve . . . 155
3-34 Water Depth-Damage Function . . . 159
3-35 Flood Insurance Structure . . . 163
3-36 Wetland Succession Structure . . . 166
4-1 Map of Cape Cod Region . . . 172
4-2 DIVA Segments for Cape Cod . . . 172
4-3 Map of Miami-Dade County . . . 175
4-4 DIVA Segments near Miami-Dade County . . . 175
4-5 Map of St. Mary Parish in Louisiana . . . 178
4-6 St. Mary Parish near New Orleans . . . 178
4-7 USACE Coastal Defense for St. Mary Parish . . . 181
4-8 PDF of Storm Intensities . . . 186
4-9 CDF of Storm Intensities . . . 187
5-1 RSLR for Miami-Dade . . . 196
5-2 Storm Pattern for Miami-Dade . . . 198
5-3 Perceived Frequency of Storms for Miami-Dade . . . 199
5-4 Perceived Fractional Storm Damage for Miami-Dade . . . 200
5-5 Gross Output Causes for Miami-Dade . . . 202
5-6 Total Capital for Miami-Dade . . . 203
5-7 Perceived Relative Return to Capital for Miami-Dade . . . 204
5-8 Cumulative Storm Damage for Miami-Dade . . . 205
5-9 Mitigated Capital for Miami-Dade . . . 205
5-10 Capital Investment for Miami-Dade . . . 206
5-11 Marginal Productivity of Capital for Miami-Dade . . . 207
5-12 Effect of Aggregated Demand on Investment for Miami-Dade . . . 207
5-13 Long-run Expected Growth Rate for Miami-Dade . . . 208
5-14 Effect of Land Availability on Investment for Miami-Dade . . . 209
5-15 Population for Miami-Dade . . . 212
5-16 Population Flows for Miami-Dade . . . 213
5-17 Community Attractiveness for Miami-Dade . . . 214
5-18 Community Attractiveness Causes for Miami-Dade . . . 215
5-19 Evacuees Population for Miami-Dade . . . 216
5-20 Labor Force and Jobs for Miami-Dade . . . 216
5-21 Public Adaptation Height for Miami-Dade . . . 218
5-22 Public Adaptation Breaching for Miami-Dade . . . 219
5-23 Fraction of Infrastructure Mitigated for Miami-Dade . . . 220
5-24 Fraction of Flood Insurance Coverage for Miami-Dade . . . 220
5-25 Gross Output for Miami-Dade . . . 223
5-26 Gross Output for Cape Cod . . . 223
5-28 Fraction of Developable Land for Communities . . . 224
5-29 Effect of Land Availability on Investment for Communities . . . 224
5-30 Gross Output Monte Carlo Results for Communities . . . 227
5-31 Recovery Time for Reference Scenario by Community . . . 231
6-1 Perceived Frequency of Storms for Rationality Scenario . . . 235
6-2 Perceived Fractional Damage from Storms for Rationality Scenario . . 236
6-3 Perceived Relative Return to Capital for Rationality Scenario . . . . 237
6-4 Total Damaged Capital from Storms for Rationality Scenario . . . 238
6-5 Marginal Productivity of Capital for Rationality Scenario . . . 238
6-6 Marginal Cost of Capital for Rationality Scenario . . . 239
6-7 Total Undamaged Capital for Rationality Scenario . . . 240
6-8 Employed Labor for Rationality Scenario . . . 241
6-9 Employed Labor, Jobs, Labor Force for Reference . . . 242
6-10 Employed Labor, Jobs, Labor Force for Rationality . . . 243
6-11 Community Attractiveness for Rationality Scenario . . . 243
6-12 Storm Risk Attractiveness for Rationality Scenario . . . 244
6-13 Job Attractiveness for Rationality Scenario . . . 245
6-14 Perceived Relative Return to Labor for Rationality Scenario . . . 246
6-15 Effect of Aggregate Demand on Jobs for Rationality Scenario . . . 247
6-16 Monte Carlo Results for Rational Scenario . . . 248
6-17 Recovery Time for Rational Scenario by Community . . . 251
6-18 Monte Carlo Results for Degrade Protection Scenario . . . 254
6-19 Monte Carlo Results for SLR Scenarios . . . 257
6-20 CDF of Storm Intensity Comparing GCMs for Miami-Dade . . . 261
6-21 Monte Carlo Results for Storm Scenarios . . . 262
7-1 Relative Aggregate Demand for Disaster Relief Scenarios . . . 271
7-2 Effect of Aggregate Demand on Capital for Disaster Relief Scenarios . 272 7-3 Gross Output for Disaster Relief Scenarios . . . 272
7-4 Total Storm Damage for Disaster Relief Scenarios . . . 273
7-5 Monte Carlo Results for the Disaster Relief Scenarios . . . 275
List of Tables
2.1 Wind Speed Ranges for Saffir-Simpson Categories . . . 32
2.2 Saffir-Simpson Storm Surge Ranges . . . 33
2.3 LACPR Planning Objectives . . . 50
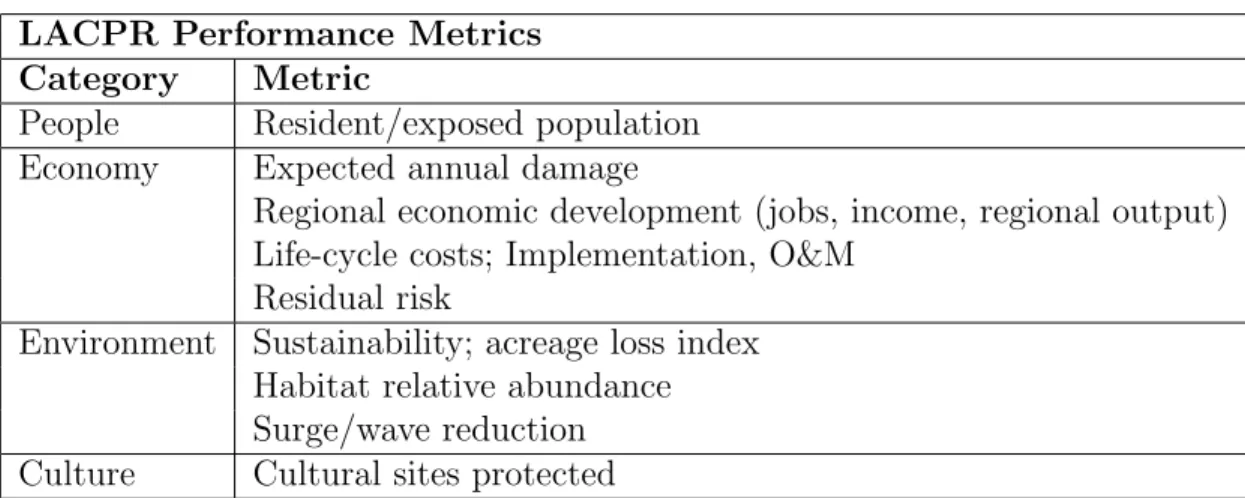
2.4 LACPR Performance Metrics . . . 51
3.1 Endogenous and Exogenous Variables . . . 56
3.2 Global SLR Scenarios . . . 59
3.3 Storm Surge in FRACC . . . 69
4.1 Qualitative Dimensions of Communities . . . 170
4.2 Initial Parameters for Communities . . . 171
4.3 Subsidence Rate for Communities . . . 182
4.4 Coastal Slope for Communities . . . 182
4.5 Storm Frequencies by Region, GCM, and Climate . . . 185
4.6 Initial Population for Communities . . . 186
4.7 Labor Force Participation for Communities . . . 187
4.8 Initial GDP per capita for Communities . . . 188
4.9 Land Area of the Communities . . . 188
4.10 Fractions of Land Area Developable and Developed . . . 189
4.11 Land for Communities . . . 190
4.12 Fraction of NFIP Compliance . . . 191
4.13 Fraction of Infrastructure Pre-1990 . . . 191
4.14 Fraction of Insurance Coverage . . . 192
5.1 Sample Storm Pattern for Miami-Dade . . . 197
5.2 Sample Storm Distribution for Miami-Dade . . . 197
5.3 Sample Storm Pattern for All Regions . . . 222
5.4 Monte Carlo Results for Communities . . . 226
5.5 Monte Carlo GDP to No Storms . . . 227
5.6 Economic Growth Rate Comparison . . . 229
5.7 Economic Recovery Time Comparison . . . 230
6.1 Economic Growth Rate Comparison . . . 249
6.2 Economic Recovery Time for Rationality . . . 250
6.3 Economic Growth Rate Comparison . . . 255
6.5 T-test Results for SLR Scenarios . . . 257
6.6 Economic Growth Rates SLR Scenarios . . . 259
6.7 Storm Frequency of Storm Scenarios for Miami-Dade . . . 260
6.8 T-test Results for Storm Scenarios . . . 261
6.9 Storm Frequencies by Region, GCM, and Climate . . . 263
6.10 Economic Growth Rates SLR Scenarios . . . 264
6.11 Sensitive Parameters Rank Ordered . . . 266
7.1 T-test Results for Disaster Relief Scenarios . . . 274
7.2 Economic Growth Rates for Disaster Relief Scenarios . . . 276
Chapter 1
Introduction
Coastal communities must adapt to climatic changes throughout the current cen-tury and beyond. Climate change impacts, including sea-level rise (SLR) and changes in tropical storm frequency and intensity, will pose significant challenges to city plan-ners and coastal zone managers. Meanwhile, national and international policymakers are working to mitigate future climate impacts by regulating greenhouse gas emis-sions. To define more effective policies, policymakers need more accurate information to better understand how coastal communities will be affected by climate change.
To inform the policy decision making process, researchers develop tools and models to understand and analyze coastal adaptation. These coastal models, like all models, are based on assumptions about the how society makes choices and how the climate system will behave in various scenarios. It is important to better understand if and how the assumptions shape study results and, by extension, influence policy recommendations.
This research aims to improve the methodology used to conduct coastal impact assessments, which will provide better information to policymakers as they craft cli-mate policies. Of particular interest are previous assumptions of probabilistic annual storm damage and rational economic expectations. These assumptions are suspect given the stochastic nature of storm events and the real-world behavior of people.
This research focuses on two main questions:
• What are the important community dynamics if storms are modeled more ex-plicitly?
• What are the implications for adaptation studies if a boundedly rational, dise-quilibrium model is used?
This dissertation demonstrates a new assessment methodology that incorporates variables previously not explored in past studies: boundedly rational risk percep-tion and stochastic tropical storms. These assumppercep-tions are examined in a unique simulation model with endogenous economic development. Including these variables provides a more realistic interpretation of events affecting coastal communities.
1.1
Motivation for the Research
1.1.1
Climate and the coast
Future climatic changes are inevitable. The response of the Earth’s natural systems to human-caused greenhouse gas forcing will require society to adapt to the resulting changes in weather patterns and coastal conditions. For coastal communities, these climate conditions will translate into an increase in relative sea level and changing tropical storm patterns. Local coastal zone managers will need to implement protec-tive measures to regulate the coastline as these changes take hold.
Coastal zone planning is a complex process that requires managers to prioritize many different factors and interests across stakeholder segments. For example, man-agers must consider cities’ needs to zone for industrial, commercial, and residential spaces (McCune, 2009). Additionally, they must also consider how their decisions impact nearby natural ecosystems, such as local wetlands (Axtman, 2009). The com-plexity of these issues is compounded by the dynamics of the system in which they are
embedded—for example, infrastructure developers change their investment decisions in response to urban planning choices, like levee construction and zoning laws.
Previous research has examined two main coastal impacts: SLR and storms. SLR has been studied more extensively, including studies of potential impacts (e.g., vul-nerability studies of Titus, 1988; Nicholls, 2002; Ericson et al., 2006) and studies of how society might react (e.g., adaptation studies of Yohe et al., 1996; Titus et al., 1991; Fankhauser, 1995; Anthoff et al., 2006). These studies explore SLR scenarios that range from 0.18 m to 1.5 m of global SLR by 2100 (Meehl et al., 2007; Rahm-storf, 2007). The models often include projections of economic growth with exogenous growth rates, or growth rates defined outside the model.
Storm impacts are sometimes included in SLR adaptation studies because of their potential to cause damage. Most studies calculate the annual probable storm damage by multiplying the likelihood of an event by the damage by that event (Hinkel et al., 2009). Damaged infrastructure is then removed from the community at that constant expected annual rate. The result is a smooth removal of a capital, instead of a sudden reduction caused by a distinct storm event. The dynamics of storm events, including the potential for large storm damage, evacuations, and subsequent change in economic and population recovery, are lost in the analysis, especially if the model is driven by exogenous economic growth rates.
Tropical storms may become more intense and/or more frequent as global atmo-spheric and sea-surface temperatures rise (Emanuel, 2005). It is important for coastal managers to be able to examine and understand the underlying risks associated with such a trend. Explicit storm representation will be important for future coastal adap-tation studies.
1.1.2
Behavior and risk
The way people understand and perceive risk underlies planning for and adapting to climatic threats. A large literature in psychology and behavioral economics suggests that coastal communities may not respond to these climate threats in a rational manner (i.e., maximize their well-being when making decisions) because of limited or poor understanding of risk (Tversky and Kahneman, 1974; Kydland and Prescott, 1977; Kunreuther and Pauly, 2006). Instead, decision makers within communities may act according to their perceived risk of storms and coastal flooding, reflecting a more boundedly rational decision process that uses limited information.
For example, many property owners in Gulfport, Illinois, situated along the Mis-sissippi River, believed they were protected by the presence of a levee system sur-rounding their town. In the summer of 2008, the levee broke and flooded the land behind it. Though residents had been eligible for flood insurance through the Na-tional Flood Insurance Program (NFIP), only 28 of 200 property owners had actually purchased policies. They had not perceived a risk of levee failure and felt they did not need insurance. Town officials, who had promoted the protection provided by the levee, reinforced this belief (Mattingly, 2008; Webber and Fisher, 2008). The actions were taking even though hundreds of levees failed along the Mississippi River in 1993 (Larson, 1996).
As with flood risk, the public also poorly understands hurricane risk. State officials in hurricane-prone Florida worried that residents would be ill prepared for the 2008 hurricane season due to the relatively quiet hurricane seasons of the previous three years (Cave and Almanzar, 2008). Officials believed people had forgotten the storms of 2004 even though the probability of a storm hitting a community in Florida had not changed. With time, the public’s awareness of the risk had faded. Without the awareness of likely storm damage, officials feared citizens were not taking normal precautionary measures, such as keeping an emergency food pantry at home.
These anecdotes are supported by academic research. Tversky and Kahneman (1974) studied the human tendency to forget the likelihood of an event or disaster. Kydland and Prescott (1977) described how flood plains could be developed under circumstances that are economically suboptimal. Kunreuther and Pauly (2006) found that property owners did not internalize the risk of flooding when deciding whether to build homes or buy flood insurance.
Previous coastal adaptation studies have assumed that decision makers are rational agents who make decisions in contexts with no uncertainty. In these studies, decisions to build protection mechanisms are based on optimized benefit-cost analysis studies. Fankhauser (1995) developed an optimization framework that assumed that an agent with perfect foresight (i.e., certainty) could choose the optimal degree of protection in the model’s first time-step. Additionally, the framework assumed no feedbacks between adaptation decisions and capital investments.
These assumptions are unlikely to be appropriate when viewed through the lens of behavioral economics, risk analysis and management, and climate change. Global adaptation studies could be improved by relaxing the assumption that agents make rational decisions. For example, Hallegatte (2006) provides an initial study of how some of these assumptions influenced New Orleans after Hurricane Katrina. His study highlights the need to design coastal protections in a manner that protects current infrastructure but does not attract more investment, which would ultimately put more people and property at risk.
Community decision makers will be designing policies that will change the behavior of a community’s investors and residents. Coastal adaptation studies should include a reasonable behavioral representation of the community’s actors to better understand policy implications.
1.2
Present Research
This work focuses on how the assumptions of integrated coastal adaptation models can influence policy analysis. I extend previous climate change adaptation frame-works by relaxing many limiting modeling assumptions. I develop a dynamic simu-lation model to explore how risk perception and climatic threats affect adaptation in coastal communities. The model highlights the feedbacks among important processes that determine economic development and coastal adaptation performance (e.g., how risk perception influences capital investment), and is not intended to predict coastal development precisely. The goal of the research is to improve future global coastal adaptation studies and, therefore, future adaptation policies.
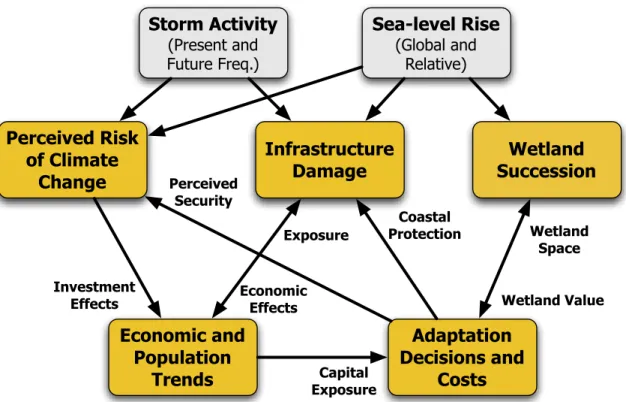
The Feedback-Rich Adaptation to Climate Change (FRACC) model follows system dynamics methodology (Sterman, 2000), consisting of stochastic nonlinear differential equations solved by simulation. The model includes components such as:
1. Global and relative SLR scenarios
2. Stochastic storm events and climate scenarios 3. Risk perception of storm frequency by investors 4. Storm damage and evacuation
5. Population growth including immigration and emigration 6. Private investment in capital and housing
7. Coastal adaptation including levees and beach nourishment 8. Fragility of coastal defenses, including levee breaching 9. Wetland succession
These components interact with each other, producing the system’s behavior. In this system, a community’s economic development depends on the amount and rate of SLR, storm events, the performance of coastal adaptation measures, and the reaction of investors and residents to these factors and events.
The model has a broad system boundary, integrating economic processes, stochastic tropical storms, limited foresight, and poor risk perception. The decisions in the model are made by three separate “agents”: adaptation planners who understand climate science and probability, and investors and residents, who are represented as having boundedly rational perception of storm events.
I developed the FRACC model because we need a dynamic feedback model to ex-amine how storms and decision making influence the outcomes of adaptation studies. Previous models did not have endogenous economic adjustment mechanisms (i.e., eco-nomic processes defined in the model), and instead used exogenous ecoeco-nomic growth rates (i.e., assumed external economic processes).
By including an endogenous economy and stochastic storms, the model provides an opportunity to study a community’s economic resiliency to storm events. The FRACC model illustrates that under some circumstances, economic growth may stagnate and decline after SLR and storm events. Stagnation depends on model assumptions, including bounded rational versus rational agents. The possibility of economic decline reflects the challenges that coastal communities face in the real world.
1.3
Dissertation Overview
The next chapter provides additional context and background for this research and includes a discussion of previous climate and adaptation studies along with specific information about coastal management practices in the United States. Chapter 3 presents the FRACC model equations and assumptions and describes the components and their feedbacks. Chapter 4 provides details about three different US coastal communities, which serve as case studies to test the model. Chapter 5 presents base case model results. Sensitivity tests are presented in Chapter 6, including the implications of rationality assumptions and tropical storm distributions. Chapter 7 explores a policy scenario, demonstrating the use of the model for policy analysis.
Chapter 8 concludes the dissertation with a discussion of the results, including their implications for policy and for global coastal adaptation studies.
Chapter 2
Climate Change and Coastal
Adaptation
This chapter provides an overview of climate change and coastal adaptation liter-ature. The first section covers the scientific aspects of coastal adaptation to climate change—namely sea-level rise (SLR) and storms. The next section considers how peo-ple perceive risks associated with natural disasters, which has important implications for coastal adaptation research. Previous economic studies are discussed next, high-lighting the assumptions that are changed later in this dissertation. The final section presents various techniques for protecting coastal communities against climatic risks, including practices that are common in the United States.
2.1
Climatic-induced Sea-Level Rise
Contrary to public perception, SLR is not the same around the world. Different communities will experience varying amounts of SLR depending on local conditions. The actual height of SLR in a particular region is referred to as the “relative sea-level rise” (RSLR) of the region. RSLR is the sum of the global SLR trend, plus the location-specific uplift and subsidence factors. While the next section discusses the important factors increasing SLR and RSLR, Chapter 4 defines in more detail the rates of subsidence and uplift for the communities in this dissertation.
2.1.1
Global sea-level rise trends
Climate change and the resulting higher global temperature increase long-term rates of global SLR. The four major sources of global SLR are 1) thermal expansion of oceans, 2) alpine glacier melt, 3) melting of the Greenland ice sheet, and 4) melting of the Western Antarctic Ice Sheet (WAIS) (Gornitz, 1995).
Thermal expansion refers to the effect of warmer global temperatures on the oceans. As the oceans warm, the water expands and the same number of water molecules occu-pies a larger volume. Thermal expansion is a slow process because it is a consequence of mixing the different layers of the ocean, and each layer has a different time constant for mixing. The long time constant for deep-water mixing means that the oceans will expand for centuries to come, even if the global air temperature were stabilized to-day. This is often called the “commitment to sea-level rise” (Nicholls and Lowe, 2004; Solomon et al., 2009).
The second main contributor to global SLR is glacial melt. There are two sources of glacial melt: Mountain glaciers and the large ice sheets in Greenland and Antarctica. During the 20th Century, many mountain glaciers melted, and their runoff flowed through rivers into the oceans. The new mass of water, which was previously stored on land, raises the global sea-level. The World Glacier Monitoring Service surveys mountain glaciers annually and has found that mountain glaciers are receding at a rapid rate (World Glacier Monitoring Service, 2007).
Greenland and the Western Antarctic Ice Sheet (WAIS) are both melting but the rate of melting and their net additions are actively debated. Greenland appears to be melting along both its perimeter and its interior. The rates of melting are more extensive than previously thought, according to satellite and land-based instruments (van de Wal et al., 2008). There is also a process of “lubrication” in which the melt water flows between the glacier and the bedrock, increasing the rate of ice flow toward the ocean. This appears to be a seasonal phenomenon, but is currently poorly
understood (Joughin et al., 2008).
Researchers previously disagreed about whether Antarctica experienced a net change in ice mass. Some researchers wondered if the continent’s interior gained ice faster than its perimeter melted; however, Velicogna and Wahr (2006) used satellites to measure the continent’s mass and discovered a net loss. Now it appears that both the WAIS and Greenland ice sheets are net contributors of water to the oceans.
The Greenland and Antarctic ice sheets pose a large uncertainty risk in global SLR predictions. The Intergovernmental Panel on Climate Change’s (IPCC) Fourth Assessment Report (AR4) published estimates for future SLR. Their estimate for 2090–2099 is 0.18–0.58 m (Meehl et al., 2007). This range includes SLR caused both by melting mountain glaciers and thermal expansion, but does not include the impact of the Greenland and WAIS ice sheets. Instead, the IPCC stated that up to an additional 0.2 m of SLR could occur by 2100 due to “large ice sheet melt,” scaling up recent discharge rates as a function of global mean temperature. The final range of SLR estimated in the IPCC AR4 is 0.18–0.78 m by 2100 (90 percent confidence interval).
When the IPCC released its study, researchers suggested that their global SLR estimates were too optimistic and that the risk of larger SLR was much greater. Pfeffer et al. (2008) state that a likely range of SLR by 2100, including increased ice dynamics, is 0.8–2.0 m. They acknowledge that their study contains large uncertainties. Their study agrees with Rahmstorf (2007), who also estimates a higher SLR range of 0.5– 1.4 m by 2100, using IPCC AR4 temperature projections.
Projections of SLR by 2100 may vary, but the rate of global SLR in the next hundred years (2000–2100) will likely be faster than in the previous hundred years (1900–2000). The IPCC reports that the recent rates of 3.1 mm/year (1993–2003 average) exceeded the average 1.8±0.5 mm/year from 1961 to 2003. It’s important to consider that these historic rates may not reflect the actual amount of change
to date. Measured SLR rates might be lower than would naturally occur because humans have entrapped water inland in reservoirs, preventing a significant volume of water (0.55 mm/year) from reaching the ocean (Chao et al., 2008).
Going forward, the annual rate of SLR will depend significantly on the stability of the large ice sheets (Overpeck et al., 2006). Additionally, a recent study concluded that contributions from WAIS may not spread uniformly throughout the oceans, causing higher SLR than the global average in only some coastal areas, such as the southern US (Mitrovica et al., 2009). Uneven distribution of ice sheet melt could mean that regions in the United States face higher levels of SLR than any current estimate, which explained further in the next section.
2.1.2
Relative sea-level rise factors
The actual rise in sea-level for a particular location, or relative sea-level rise (RLSR), will likely vary from the global mean SLR. Local trends can offset or exacerbate the global rate. For this reason, it is important to use the RSLR rates when planning coastal management strategies for protection or retreat.
The location-specific forces influencing RSLR include 1) plate tectonics, 2) isostatic adjustments, 3) uneven landmass in the Northern Hemisphere, and 4) sediment com-paction (Emery and Aubrey, 1991). Plate tectonics is the shifting of the Earth’s plates either closer or farther apart. Either process can change the shape and size of an ocean basin. For example, if two plates on either side of an ocean basin are moving away from one another, the ocean basin will become wider, which results in a lowering of that ocean basin’s sea-level.
Isostatic adjustments include post-glaciation rebound. During an ice age, ice sheets weigh down the Earth’s crust, pushing polar ends of the plates down while lifting the opposite end. The action reverses as the ice retreats at the end of an ice age. Today the Earth’s crust continues to rise and fall due to the retreating of glaciers from
the last glacial period, approximately 10,000 years ago. While tectonic rebound is a slow process, the rise will be an important factor to offset global SLR in some US communities.
The uneven distribution of land changes the shape of the layer of water covering the Earth. If land were evenly distributed, the water would evenly distribute. Instead, the gravitational pull of the large area of land in the Northern Hemisphere attracts water and raises the RSLR as compared to the South Hemisphere (Emery and Aubrey, 1991). Mitrovica et al. (2009) recently discussed how water from the WAIS might impact RSLR, noting that it will be unevenly distributed across the Earth. The mass of large ice sheets currently attracts ocean water, raising the relative sea level nearby. As a large ice sheet melts, the decrease in mass will lower relative sea level for land within approximately 2,000 km, even with the addition of melt water. Instead, the relative sea level will rise disproportionately for locations farther from the ice sheet. In the case of the melting WAIS, the Northern Hemisphere will experience relatively more SLR than locations in the Southern Hemisphere. The gravitational effect has largely been ignored in SLR studies, with the exception of Katsman et al. (2008) who generated SLR scenarios the Northeast Atlantic with gravitational effects.
Along with plate tectonics and other large-scale forces, land may be sinking be-cause of small-scale trends at specific locations. Pumping resources from underground reservoirs can cause subsidence, the sinking of land above. In many places, water is being pumped to prevent flooding (e.g., New Orleans) or to supply drinking water (e.g., Bangkok). Land may also be sinking because of oil extraction (e.g., Long Beach, CA) (Emery and Aubrey, 1991). Additionally, land may be sinking because of sed-iment compaction. In particular, the soils of river deltas compact as they settle, which increases RSLR. New Orleans, in the Mississippi River delta, is experiencing 9.85 mm/year of RSLR, compared to global SLR mean of 1.7 mm/year (CCSP, 2009). Rates of RSLR for the United States are depicted in Figure 2-1.
Figure 2-1: Rates of relative sea-level rise around the United States. (Sources:
Figure 1.4 from CCSP (2009); Data from Zervas (2001))
2.2
Climate Change and Tropical Storms
Tropical storms are another important driver for coastal adaptation. Coastal man-agers regularly take into account storm frequency and severity when considering how to protect property that is vulnerable to coastal flooding.
Tropical storms only affect a fraction of the world’s coastline. Other types of non-tropical storms also affect coastal communities. Nor’easters, for instance, can cause severe damage in New England. Tsunamis and other large weather systems also cause damage in other parts of the world. This dissertation only considers the impacts of tropical storms and other storm types would need to be included for a more complete global study.
While current planning processes use estimates of storm frequency and intensity, the assumed distributions of storm events may not accurately reflect future climatic
con-ditions. If storm characteristics do not represent the future, then coastal protection might not protect adequately. Emanuel (2005) concluded that tropical storm inten-sities have increased in the past three decades. He shows a correlation between the warmer sea-surface temperatures and higher tropical storm intensity because warmer surface temperatures provide more energy for storms.
Some researchers debate Emanuel’s conclusions. Landsea (2005) and Pielke Jr (2005) argue that there is no statistically significant trend during the last 30 years. Furthermore, they argue that any increase in storm damage is positively correlated with real estate development in coastal communities because there is now more prop-erty in harm’s way than there was 30 years ago. The debate is still active, but a reanalysis of the studies by Kossin et al. (2007) concludes that a statistically signif-icant trend exists for storms in the Atlantic Ocean basin, where the communities in my case studies are located.
To further study the changes in storm frequency and intensity, Emanuel et al. (2008) developed the Coupled Hurricane Intensity Prediction System (CHIPS), a physics-based storm event model. The CHIPS model randomly seeds storm events throughout an ocean basin. These locations of “genesis” vary in both the time of the year and latitude and longitude. After a storm is seeded, whether it develops into a full-blown hurricane depends on the conditions at its specific location. For example, sea-surface temperatures, winds, and other environmental characteristics must be conducive to creating a storm. Under certain conditions, a storm will develop and the model will simulate its track, size, wind speeds, and pressure differentials.
Emanuel uses his storm model to compare current climate conditions to future conditions. He finds that, overall, storm frequency and intensity will likely increase in the future. Emanuel uses outputs from several large global circulation models (GCMs) that were used in the IPCC AR4. Emanuel’s emissions scenario was drawn from the Special Report on Emissions Scenarios (SRES) A1B, a mid-range emissions scenario developed by the IPCC (IPCC, 2000). The A1B scenario embodies lower
Storm Category Wind Speed (km/hr) Category 1 119–153 Category 2 154–177 Category 3 178–209 Category 4 210–249 Category 5 250+
Table 2.1: Wind speed ranges for Saffir-Simpson categories. (Source: NOAA,
2008)
emissions than the current emissions trajectory, which is closer to the SRES A1FI (Raupach et al., 2007).
2.2.1
Tropical storm classification
For this dissertation, a “storm” is a tropical storm, or storms that form near the equator in tropical air masses. The Saffir-Simpson storm scale is used to classify tropical storms (NOAA, 2008). The Saffir-Simpson scale classifies storms into five categories (Category 1, Category 2, etc.) depending on wind speed (Table 2.1).
2.2.2
Storm surge
The Saffir-Simpson scale broadly describes each storm category, providing a range of possible surges (NOAA, 2008). The storm surge ranges (Table 2.2) are estimates based on historical storm surges. Actual storm surge depends significantly on the approach angle of the storm relative to the shoreline, the bathymetry of the coast, physical characteristics of the storm (e.g., internal air pressure), coastal structures guiding the water, and the phase of the tide (Irish et al., 2008). The Saffir-Simpson scale has been critiqued as a poor predictor of storm surge (Resio and Westerink, 2008). The scale provides an initial estimate and is easier to use, given the intensive data requirements of other methods.
Storm Category Surge Height (m) Category 1 1.22–1.52 Category 2 1.83–2.44 Category 3 2.74–3.20 Category 4 3.96–5.49 Category 5 5.49+
Table 2.2: Storm surge ranges according to Saffir-Simpson classification. (Source:
NOAA, 2008)
2.3
Risk Perception and Decisions
The way people understand and perceive risks underlies planning and adaptation to climatic threats. While coastal managers and city planners may have a solid understanding of storm and RSLR risk, these experts are the exception rather than the rule. Generally, people have a poor understanding of natural hazard risk (Kydland and Prescott, 1977; Kunreuther and Pauly, 2006). Distinguishing between expert knowledge and general knowledge is important when considering adaptation responses because expert knowledge cannot be assumed for all actors. Previous economic studies assumed a “socially-optimal planner”—a single optimizer who maximizes a societal benefit, e.g., the lowest cost of adaptation (Fankhauser, 1995; Tol, 2002). A large body of literature in psychology and behavioral economics support relaxing the assumption that all actors in society behave as if they were making fully rational decisions that optimize social welfare. Climate change adaptation could be studied as a two-actor problem involving the actions of expert planners and less-expert citizens.
2.3.1
Perception anecdotes
For example, many property owners in Gulfport, Illinois, situated along the Mis-sissippi River, believed they were protected by the presence of a levee system sur-rounding their town. In the summer of 2008, the levee broke and flooded the land behind it. Though residents had been eligible for flood insurance through the Na-tional Flood Insurance Program (NFIP), only 28 of 200 property owners actually purchased policies. Town officials promoted the protection provided by the levee and
residents interviewed believed they did not need insurance (Mattingly, 2008; Webber and Fisher, 2008). The actions were taking even though hundreds of levees failed along the Mississippi River in 1993 (Larson, 1996).
As with flood risk, the public also has a poor understanding of hurricane risk. State officials in hurricane-prone Florida worried that residents would be ill prepared for the 2008 hurricane season due to the relatively quiet hurricane seasons of the previous three years (Cave and Almanzar, 2008). The probability of a storm hitting a community in Florida had not changed, but the awareness of the risk had faded. Without the awareness of likely storm damage, officials feared citizens were not taking normal precautionary measures, such as buying food for emergency pantries.
2.3.2
Perception literature
These anecdotal events are supported by academic literature. Tversky and Kah-neman (1974) studied how a person’s memory influences their perception of the like-lihood of an event or disaster, calling the phenomenon the “availability heuristic.” They found that a person perceived the probability of an event to be higher if he or she could recall a recent occurrence. Eventually, as his or her memory of the event faded, their perception of the probability decreased. The perceived probability of an event was inversely proportional to the time since the last occurrence. The availabil-ity heuristic describes the worries of disaster managers in Florida after a few quiet hurricane seasons.
Kydland and Prescott (1977) describe how flood plains could be developed under circumstances that are economically suboptimal. People move into an area assuming that they will be protected by levees. Once the people are there, the flood plain hosts capital infrastructure that deserves protection by the government. Levee protection causes more capital investment in the flood plain, which increases the exposure to flooding. Instead of investing to protect property in these flood-prone areas, Kydland and Prescott concluded that, with the level of protection in the US, it was socially
optimal to prevent people from building in the flood plain in the first place.
Kunreuther and Pauly (2006) extend Kydland and Prescott by studying flood in-surance coverage. They found that property owners did not internalize the risk of flooding when deciding whether to build dwellings or buy flood insurance. Instead, homeowners screened risks by using a “risk threshold.” If a particular risk were above one’s internal risk threshold, one would consider the risk and evaluate preventive ac-tions. In the case of flooding, if the risk of flood was perceived to be high relative to one’s threshold, one might avoid building in a flood plain or purchase insurance to cover possible damage. Surveys, however, show that natural disasters are below most people’s thresholds except immediately after an event (Palm, 1990, 1995). For instance, earthquake insurance coverage in California increased from 40 to 51 percent in one year after the 1989 earthquake, but then fell as time wore on. As with hurri-canes in Florida, people’s perception of earthquake risk rose above their risk threshold after an adverse event, but then became less salient over time.
2.3.3
Risk perception and climate adaptation
Risk perception has important implications for coastal adaptation research. The example of levee protection illustrates how adaptation to climatic risks can influence population growth and economic output. The empirical research above describes how residents discount the risk of flooding events after levee construction, beyond the protection the levee actually provides. Subsequently, the rate of infrastructure investment can increase, creating more economic output, faster population growth, and larger capital infrastructure in the flood plain. While the risk of small floods is reduced by the presence of the levee, the risk from larger events remains. When these larger, but less-frequent, floods occur, the community faces greater economic loss than it would if the levee protection were not in place.
New Orleans provides a recent example of the interaction between risk perception and infrastructure investment. The population of New Orleans increased through the
19th Century to 1960, during a relatively quiet period of hurricane activity. After two severe river floods, levee protection was improved, providing the illusion of protection. In the 1960’s, two tropical storms reached landfall near the city. Hurricane Betsy, a Category 3 storm, struck the city in 1965. The protective levees were breached, causing then-record hurricane damage. In 1969, Hurricane Camille approached the Gulf Coast, missing New Orleans but reminding the residents again about hurricane risk. The city experienced another period of quiet from 1970 through 2005, yet the population of New Orleans never recovered from Hurricane Betsy (Figure 2-2). Then, in August 2005, Hurricane Katrina struck, breaching the levees and causing major damage and widespread evacuation (Figure 2-3). In the three years since Hurricane Katrina, the population of New Orleans Parish has begun to level off with the return of 76.4 percent of households (Lui and Plyer, 2009). The growth and stagnation of a city such as New Orleans contrasts against other cities (e.g., in Florida) that have experienced positive long-term economic growth after storms. New Orleans might have passed a point of economic resiliency—a point at which economic growth is derailed and stalls.
2.4
Coastal Adaptation Economics
Climate change and coastal zones have been studied for several decades (Schneider and Chen, 1980). Economic studies of coastal impacts fall into two broad categories: 1) vulnerability studies and 2) adaptation studies. The following section discusses the relevant literature for this dissertation.
2.4.1
Vulnerability studies
Vulnerability studies estimate exposure to RSLR for a particular region or country, e.g., the amount of capital (i.e., housing, industrial and commercial facilities, and infrastructure) that would be flooded by a given amount of RSLR. The results from vulnerability studies tend to be eye-catching because the studies do not assume any coastal protection measures or other societal responses. Instead, vulnerability studies
0 100000 200000 300000 400000 500000 600000 700000 1940 1945 1950 1955 1960 1965 1970 1975 1980 1985 1990 1995 2000 2005 2010 Population Year Hurricane Betsy Hurricane Camille Hurricane Katrina
Figure 2-2: New Orleans Population (1940–2007). The population of New
Orleans since 1940, showing the downward trend after Hurricanes Betsy (1965) and Camille (1969) and the evacuation and repopulation after Hurricane Katrina (2005). (Sources: US Census Bureau data in Gibson, 1998; Lui and Plyer, 2009)
focus on understanding risk exposure (e.g., Titus, 1988; Nicholls, 2002; Ericson et al., 2006).
Vulnerability studies report metrics that may be important to decision makers, including both people and property. Past vulnerability studies reported people at risk to flooding (Nicholls et al., 1999), acres of rice production lost (Hoozemans et al., 1993), wetland area lost, capital that would be inundated by RSLR, and simply the land area lost to RSLR, no matter its current vegetation or use. Researchers report different metrics depending on their purpose. Some studies attempted to report only a sense of the widespread change that RSLR would cause (i.e., total number of people flooded), while other studies included only parameters that could be assigned monetary values (i.e., wetlands and protection costs).
0 100000 200000 300000 400000 500000 600000 1995 1996 1997 1998 1999 2000 2001 2002 2003 2004 2005 2006 2007 2008 Population Year Hurricane Katrina
Figure 2-3: New Orleans Population (1995–2007). Population trend
high-lighting the effect of Hurricane Katrina (August 2005). (Sources: US Census Bureau data in Gibson, 1998; Lui and Plyer, 2009)
Vulnerability studies provide an upper bound to the costs of climate impacts in coastal regions. It is reasonable to assume that communities will respond to climatic threats by protecting their shoreline from flooding and/or setting financial and legal structures to cope with a rising sea level.
2.4.2
Adaptation studies
Contrary to vulnerability studies, adaptation studies include some form of response by the coastal community. These responses may be via market mechanisms (Yohe et al., 1996) or public coastal protection programs, such as levees (Titus et al., 1991; Fankhauser, 1995; Anthoff et al., 2006).
Adaptation researchers tend to argue against static vulnerability studies, stating that vulnerability damage estimates are too high and cannot be used to justify cli-mate policy action. Instead, researchers prefer to assume that communities consist
of rational actors who want to protect their property, which means that adaptation measures would significantly reduce the absolute level of RSLR impacts. Fankhauser (1995) concluded that adaptation reduces the impacts of RSLR.
Fankhauser developed an economic model of RSLR adaptation that determined the optimal level of protection over the entire century. The optimal protection level was a trade-off between the cost of protection, the value of dry land, and the value of wetlands (Equation 2.1). The total discounted cost is minimized by choosing the length of the coastline protected and the height of the protection. Shorter lengths of coastline and lower protection heights would lower both protection costs and wetland loss, but increase the amount of dry land damage.
min L,ht Z = ∫ τ 0 [p(L, ht, Gτ) + dt(L, St) + wt(L, St)]e(−rt)dt (2.1) where
L is the fraction of the coastline protected
ht is the levee height at time t
p is the function for annual protection costs
Gτ is the final height of protection
dt is the function for value of dry land
St is the RSLR at time t
wt is the function of the value of wetlands
r is the discount rate
Fankhauser assumed a uniform distribution of capital along a coastal segment and linear RSLR over time. He concluded that OECD countries would construct levees for a large fraction of their coastline—protecting approximately 97 percent of their urban coastline and 80 percent of their open coasts.
Fankhauser and other economics-based adaptation studies used traditional eco-nomic assumptions of perfect foresight and rationality. For example, they assumed there was one “socially optimal planner” who could evaluate all the options and make the best choice. The single planner was a rational actor and made decisions that op-timized economic welfare over all future time. The economic studies also assumed equilibrium conditions, either partial or general. Traditional economic adaptation models do not include adjustment delays or allow for flawed decision making. The optimistic assumptions used in these studies means that they provide the lower limit to adaptation costs. Real-world adaptation costs will likely be greater because com-munities may not preemptively adapt.
Most studies include only one “hard” adaptation or protection measure: levee construction (e.g., Fankhauser, 1995; Tol, 2002). More recent studies include “soft” engineering techniques, such as beach and wetland nourishment (Hinkel and Klein, 2003). Models that include these protection measures effectively change the overall shape of the adaptation cost curve by providing for lower-cost options. Some of these protection techniques may have secondary benefits, such as saving wetlands and reducing storm surge.
Yohe et al. (1996) studied how the real estate market might react to long-term RSLR. They assumed that property would be slowly devalued as it was encroached upon by water. Land values inland would rise, transferring the value of coastal properties to those inland. The slow devaluation and the transfer of value resulted in a significant reduction in the economic costs of coastal adaptation. RSLR was found not to cause significant economic losses because newly inundated land had already been devalued by real estate market forces. Additionally, Yohe et al. (1996) relaxed the perfect foresight assumption of the real estate market. RSLR losses were greater and the fraction of communities building coastal protection was larger, because land had not been devalued.
Along with assumptions of foresight, different economic studies have tested as-sumptions of economic equilibrium. Bosello et al. (2004) highlight how differences in economic modeling can influence measures of vulnerability. Their general equilibrium model allows countries to fund protection infrastructure through trade and foreign debt, as opposed to their own internal economic capacity based on GDP. External financing increases the adaptive capacity of exporting countries. Darwin and Tol (2001) use a general equilibrium model also, finding the inclusion of secondary eco-nomic effects increases the global costs of RSLR adaptation 13 percent over a partial equilibrium calculation. The increased costs of RSLR occur because of price changes, which affect consumption and economic welfare.
Few coastal adaptation studies have utilized disequilibrium economic assumptions. Hallegatte et al. (2007) studied the importance of disequilibrium assumptions when assessing climate change impacts, but illustrated the point more broadly about large extreme weather events. While they mention storm events, they did not focus on coastal adaptation specifically.
More recent studies have brought in different RSLR impacts, other than slow flood-ing from RSLR, and integrated across disciplines. The Dynamic Interactive Vulner-ability Assessment (DIVA) study optimizes protection decisions based on a variety of impacts (tourism, flooding, protection costs) (Vafeidis et al., 2008). The DIVA model consists of several modules each focusing on different impacts or responses to sea-level rise. For instance, one module calculates the population that is expected to be flooded while another module calculates the area of wetlands that will be lost. A final module takes these impacts as inputs and calculates the optimum level of pro-tection for that period of time, using a user-defined decision rule such as benefit/cost, “no protection,” or “full protection.” The model then calculates subsequent periods in a recursively. No other areas of the economy except those associated with coastal protection are considered.
2.4.3
Storm representation in adaptation studies
Some previous coastal adaptation studies have incorporated storms and flooding into their models. Two approaches have been used to combine RSLR and storm effects. Some studies adjust the flood water height of return period storms (e.g. Vafeidis et al., 2008). For example, if the hundred-year storm (storm with a hazard rate of occurrence=0.01 per year) has a water height of 1.0 m and RSLR has been 0.5 m, then the new total water height of the hundred-year storm is 1.5 m. Adjusting the flood water height by RSLR is a first-order approximation of storm flooding behavior.
Other studies have focused on including explicit storm events. West et al. (2001) modeled whether or not a property would be damaged and the extent of any such damage as two random processes. Their model focused on the interactions of storm damage and coastal erosion. They modeled erosion according to the Bruun Rule (Bruun, 1962), which states that, as sea level rises, the shore erodes, exposing property to storm damage. West et al. (2001) calibrated their random storm damage model according to insurance claims through the National Flood Insurance Program. Their storm model was not based on any climate scenarios, surge models, or hurricane arrival models. The model fits storm strength to insurance claim data to estimate storm damage.
Some studies have used Markov-chain hurricane models to estimate storm dam-age under present and future climates. Hallegatte (2007) utilized synthetic storm tracks from Emanuel’s hurricane model to estimate damage along segments of the US coastline. Hallegatte concluded that hurricane damage was significant and should be considered when justifying climate policy. While this study included storm probabil-ities, it did not integrate storm arrivals with endogenous coastal adaptation and an endogenous economy.
2.4.4
Handling of uncertainty and sensitivity
Researchers have the opportunity to explore model sensitivity and uncertainty, but these results have not been reported for many studies. Early studies may have lacked the techniques and/or computational power required. More recent studies have provided ranges of damage estimates from sensitivity and uncertainty exercises. These ranges can overlap, which mitigates some conflicting data between different studies.
One parameter explored in many studies is the absolute amount of sea-level rise. Yohe et al. (1996) critiqued the commonly used 1 m-scenario because scientific consen-sus was much lower, around 0.5 m by 2100 (in 1996). In their study, the total cost of protection and damage varied significantly, depending on the amount of RSLR. Many studies have since included varying amounts of RSLR in their analyses, including the IPCC SRES range (e.g., Nicholls and Tol, 2006).
Climate models predict that the world will warm and sea-level will rise faster over time. The rate of global SLR will likely be higher toward the end of the 21st Cen-tury than at present. Many economic studies assume linear SLR, allowing for more tractable models, that likely misallocates the SLR over time. A linear assumption likely results in incorrect damage estimates, especially if costs and benefits are dis-counted. Sugiyama et al. (2008) included non-linear SLR in their economic study. They concluded that total discounted costs would be lower with the non-linear as-sumption because adaptation costs would be postponed until later in the century.
Most studies do not present a multi-variate analysis of their uncertain variables. SLR is the main variable of uncertainty, with more recent studies commonly using the IPCC scenarios. Studies rarely present the uncertainty results of varying population or economic growth assumptions.
2.4.5
Global data sets for economic studies
Information about the coastal zone drives many assessment models. Data quality is important for coastal adaptation studies.
The Global Vulnerability Assessment (GVA) study (Hoozemans et al., 1993) is a widely cited global data source and has been updated in subsequent studies (e.g., Nicholls et al., 1999). Their data was collected from a variety of sources, checked for global consistency, and aggregated into 192 coastal segments. These segments were predominantly decided by country boundary.
While the GVA produced a reasonable data set, its data resolution was very coarse. A European funded research project, DINAS-COAST, recently created the Dynamic Interactive Vulnerability Assessment (DIVA) model and companion database. The DIVA database contains more information at a higher resolution, dividing the world’s coastlines into 12,148 segments (Vafeidis et al., 2008). This data set was created with the intention to improve coastal assessment studies.
Consistent global economic data sets are difficult to develop. The distribution of capital along the coastline is important to estimate flooding and storm damage accurately. Typically, geographic data about capital infrastructure has been hard to attain, especially at a global scale. Even in the US, a country with relatively good data, federal-level census data divides infrastructure into census blocks. These census blocks are intentionally large enough to not accurately pinpoint property, so as to preserve the privacy of property owners.
Most adaptation studies assume a uniform distribution of capital along a coast-line (Fankhauser, 1995). Sugiyama et al. (2008) compares this uniform distribution with a quadratic distribution of capital and concludes capital distribution influences the fraction of coast protected. Also, Nordhaus (2006) has developed a database of economic data sets that include spatial distribution information.