Publisher’s version / Version de l'éditeur:
Canadian Journal of Civil Engineering, 2, 1, pp. 36-49, 1975-03
READ THESE TERMS AND CONDITIONS CAREFULLY BEFORE USING THIS WEBSITE.
https://nrc-publications.canada.ca/eng/copyright
Vous avez des questions? Nous pouvons vous aider. Pour communiquer directement avec un auteur, consultez la première page de la revue dans laquelle son article a été publié afin de trouver ses coordonnées. Si vous n’arrivez pas à les repérer, communiquez avec nous à [email protected].
Questions? Contact the NRC Publications Archive team at
[email protected]. If you wish to email the authors directly, please see the first page of the publication for their contact information.
NRC Publications Archive
Archives des publications du CNRC
This publication could be one of several versions: author’s original, accepted manuscript or the publisher’s version. / La version de cette publication peut être l’une des suivantes : la version prépublication de l’auteur, la version acceptée du manuscrit ou la version de l’éditeur.
Access and use of this website and the material on it are subject to the Terms and Conditions set forth at
Limit states design : a probabilistic study
Allen, D. E.
https://publications-cnrc.canada.ca/fra/droits
L’accès à ce site Web et l’utilisation de son contenu sont assujettis aux conditions présentées dans le site LISEZ CES CONDITIONS ATTENTIVEMENT AVANT D’UTILISER CE SITE WEB.
NRC Publications Record / Notice d'Archives des publications de CNRC:
https://nrc-publications.canada.ca/eng/view/object/?id=411b2935-5f0a-4731-a35b-70ffefbe6a8f https://publications-cnrc.canada.ca/fra/voir/objet/?id=411b2935-5f0a-4731-a35b-70ffefbe6a8f
Limit States Design-A Probabilistic Study
D. E. ALLEN
Building Strrrctrrres Section, Division of Building Research, National Research Council of Canada, Ottawa, Canada K I A OR6
Received October 28, 1974 Accepted December 17, 1974
Canadian structural standards for buildings are moving toward a unified limit states philosophy with common safety and serviceability criteria for all materials and types of construction. Structural steel and cold formed steel will have limit states design rules by 1975 and concrete, masonry, and wood will follow later.
This paper compares the new rules with existing NBCICSA requirements on the basis of probability of failure calculated by simplified theory. The main emphasis is on load combinations of dead, floor, and wind loads for office and residential buildings where failure occurs by yielding of steel. Other aspects of the new limit states design rules--column formula for structural steel, performance factors for composite structures, the importance factor which reflects the serious- ness of failure, and safety factors during construction, are also considered.
The results indicate that the new rules provide more consistent safety than existing rules for different combinations of loads and materials; and that simple rules are sufficiently accurate, keeping in mind the predominating influence of human error on failures and the simplifications used in analyzing complex building structures.
Les normes canadiennes pour le calcul des edifices subissent actuellement une evolutionqui les oriente vers une approche unifiee fondee sur les Ctats limites et mettant enjeu les mEmes criteres de securite et d'utilisation pour tous les materiaux et tous les types de constructions. En 1975 on disposera des regles de calcul aux Ctats limites pour les aciers de structure et les aciers formes a
froid, des regles semblablesdevant Etre publikes plus tard pour le %ton, lama~onnerie et le bois. Dans cet article, I'auteur compare aux regles existantes (C.N.B.-ACNOR) les nouveaux reglements sous I'angle de la probabilitk de ruine calculee par une theorie simplifiie. I1 met I'accent sur les combinaisons des charges dues au poids propre, aux surcharges de planchers et au vent, pour les immeubles a bureaux et immeubles d'habitation, constructions dans lesquelles la ruine survient par deformation plastique de l'acier. L'auteur exam~ne egalement d'autres aspects des nouveaux reglements: la formule des poteaux applicable aux aciers structuraux, les coefficients de performance pour les structures composites, le coefficient d'importance qui reflete la gravite d'une ruine potentielle, et les coefficients de securite pour la phase de construc- tion.
11 ressort de cette analyse, d'une part, que les reglements nouveaux fournissent une securite plus homogene que les regles presentes pour differentes combinaisons de charges et de materiaux, et d'autre part, que des regles simples se revelent suffisamment exactes, compte tenu du rble dominant que jouent les erreurs humaines dans les ruines potentielles, et des simplifications admises dans ]'etude des structures complexes. [Traduit par la Revue]
Introduction
Various structural standards in Canada are moving toward a unified 'limit states' philoso- phy with common safety and serviceability cri- teria for all materials and types of construction. The common requirements will be contained in Section 4.1 (Structural Loads and Procedures) of the National Building Code of Canada
(NBC) 1975, and detailed requirements will be contained in the various material structural standards. Structural steel (Canadian Standards Association, CSA S16.1 - 1974) and cold formed steel (CSA S136 - 1974) will have
limit states design in 1975l; concrete, wood, and masonry plan to have it by 1980. T o avoid abrupt changes in office design practice, the changeover to limit states design will be a gradual one, with existing procedures such as allowable stress design maintained as an alter- native, at least until 1980. The changeover for concrete design, however, will not involve any difficulty to designers, since it is already in a form very similar to limit states design. All this activity is being coordinated by a CSA/NBC 'For application to structural steel design using CSA S16.1 - 1974, see Kennedy (1974).
Joint Committee, made up of representatives of all structural and foundations codes and standards used for buildings.
Following a brief description of limit states design, this paper presents results of a prob- abilistic study which compares safety levels of the new limit states design rules with previous standards. T h e main emphasis is on different load combinations for the basic case of failure of a critical section by yielding of steel. Other aspects of the new limit states design rules, namely, the column formula for structural steel, performance factors for composite struc- tures, the importance factor, which reflects the seriousness of failure, and safety factors during construction, are also investigated.
Limit States Design2
All building structures have in common two basic functional requirements, namely, service- ability during thc useful life of the building and safety from collapse during the construction and useful life of the building. Limit states de- fine the various types of collapse and unser- viceability that are to be avoided. Those con- cerning safety are called the ultimate limit states and include: collapse due to crushing, fracture, buckling, etc.; overturning, sliding; large deformation, flutter. Those concerning unscrviceability are called the serviceability limit states and include: excessive deflection, vibration, cracking or permanent deformation. Fundamentally limit statcs design is not ncw; it is a redefinition of terms in conformity with basic design requircments. Existing standards contain different 'design methods'
-
allowable stress design, plastic design, ultimate strength design, etc., each strongly associated with a particular structural theory and a particular limit state. With limit states design, instead of having different 'design methods' all standards will talk the same language; the appropriate structural theory is chosen as a function of the limit statc being considered and the behavior of the structure.Instead of the traditional single factors of safety, limit states design uses partial safety factors. Loud factors, a, are applied to the
'See Commentary F of Supplement No. 4 of the NBC 1975 for a more detailed explanation.
loads to take into account the variability of the loads and load patterns and, to some extent, inaccuracy in structural analysis. A load conz- bination factor, q, is applied to loads other than dead load to take into account the reduced probability of loads from different sources oc- curring simultaneously. An itnportance factor,
y , is applied to thc loads to take into account thc consequences of collapsc as related t o the use and occupancy of the building - i.e., danger to human safcty, economic loss. All these factors, which are common to all ma- terials and types of construction, will be con- tained in Section 4.1 of thc NBC. Finally per- fortncrnce factors,
+,
are applicd to material or structural resistance to take into account variability of material properties, dimensions, workmanship, and type of failure (i.e., whether it givcs warning or not) and uncertainty in the prediction of rcsistance. T h e performance fac- tors will be contained in the various structural standards when limit states dcsign is adopted. Safety and serviceability are controlled not only through the usc of partial safety factors, but also by defining specificd loads and ma- terial properties statistically in terms of prob- ability level (e.g., 5% maximum probability of underrun for material properties) or return period ( 1 0 to 100 years for snow, wind, and earthquake loads).Why introduce partial safcty factors? First, they result in more consistent safety for differ- ent combinations of loads and different com- binations of materials. This will be demon- strated later. Second, it is easier to assess safety factors for new types of construction, for un- usual situations, and for design by load tests. This is because most of the partial factors for different loads and materials will be well estab- lished. Finally, by having common load factors and load combination rules, conflicts and con- fusions when switching from one material to another are avoided.
T h e limit states design criteria can b e ex- pressed as follows:
factored resistance 3 effect of factored loads [ I ] +R 3 effect of
[ODD
+
$ ( a , L f ~ Q Q+
~ T T ) ICAN. J. CIV. ENG. VOL. 2, 1975
TABLE 1. Partial safety factors-ultimate limit state
Load Factors
Dead load Live load
Wind or earthquake Imposed deformation
Load Combinatiotz Factor
y~ = 1.0 when one of L, Q, o r T acts y~ = 0.7 when two of L, Q, o r T a c t
y~ = 0.6 when all of L, Q, or T a c t
Importance Factor
y = 0.8 for storage type buildings of low human occupancy-1
y = 1.0 for all other buildings
Perfortnance Factor for Yielding of Structural Steel
6 = 0.9
*In cases of overturning uplift and stress reversal. ?See NBC 4.1.4 for ~ r e 2 s e definition.
(or earthquake) loads and imposed deforma- design rules for steel, concrete and wood. The tion (temperature, etc.) respectively, and +R safety index is derived as follow^.^
is the factored resistance, i.e., the calculated Let S be the load effect and R the resistance resistance, including performance factors. For at a critical section; both R and S are random serviceabilitv limit states. , d R , re~resents a cri- variables. Failure occurs when R
<
S or when terion such as an allowable deflection, accel-eration, stress, or crack width.
P I
Partial safety factors for the ultimate limit If the random variables, In R and In
S,
are states are given in Table 1 . Partial safety fac- assumed to be statistically independent, the tors for serviceability limit states are generally average of u is given by41.0 with the exception that
4
is the same asfor the ultimate limit states. D = ~ R - ~
Probabilistic Study
The only real measure of safety or service- ability is the rate of failure of structures in service. Satisfactory failure rates for different limit states correspond to a trade-off between human safety or serviceability on the one hand, and economy, including expected losses due to failures, on the other hand. In practice satis- factory failure rates are achieved through com- petent structural engineering, manufacture, and erection, and by the use of safety and service- ability criteria such as Eq. [ I ] in the design calculations.
In this study, the new criteria (Eq. [ I ] ) are compared with previous rules on the basis of a calculated safety index, p, used as a measure of the probability of failure. Kuipers (1968) has done such a comparative study of Dutch
and the standard deviation by4
0 1 1 = d ( u ~ I I ~ ) 2 + ( u ~ I I ~ ) 2 From Eq. [2] the probability of failure cor- responds to the area of the probability distribu- tion curve of u in the tail u
<
0, as shown in Fig. 1. For any given distribution curve, this area is a function only of the number of stan- dard deviations betweena
and 0. This number is adopted as the definition of the safety index, R. i.e.."The theory is the simplified first-order second- moment probabilistic theory developed by Rzhanitzyn
(1957), Cornell (1969), and others.
"For the algebra of random variables, see Benjamin and Cornell (1970).
ALLEN: LIMIT STATES DESIGN The safety index
p
therefore indicates con-sistent safety provided the shape of the dis- tribution curve for u does not change. T o calculate the probability of failure requires knowledge of the distribution curve. If R and S are assumed to be log-norma1,"he calculated probability of failure, P,, is the area under the normal curve beyond
p
standard deviations from the mean. For the log-normal case Eq. [3] forp
can be writtenGwhere V rcfers to thc coefficient of variation (cov), and
a/T,
the ratio of mean resistance to mean load effect, is determined from the design safety criterion, e.g. Eq. [I], as follows:C5I
R / S
= kR.
F S(ilk,)
where k refers to the ratio of mean value to the specified value and FS is the over-all design factor of safety.
Even if the correct distribution were known, calculated failure probabilities implied by the safety index p cannot be directly related to actual failure rates in service. Two major reasons for this are: simplifications in the assumptions made, particularly in the structural analysis of complex indeterminate building structures, and, as discussed later, the fact that the theory does not include failures due to gross human errors. Therefore
p
can be considered only as a relative measure of safety; it is never- theless useful for comparing design rules for different load combinations, different materials and their combinations and different types of failure.Load Combinations
In this study, combinations of dead, floor, and wind load for office and residential build- ings are considered. These combinations are of practical importance for most tall buildings in Canada. Load effects vary in time, and S in this study refers to the maximum load in 30 years. "This assumption is often reasonable because of control of material properties and positive skewness of known load distribution curves.
'See p. 266 of Benjamin and Cornell (1970).
Failure is assumed to occur by over-all yield of steel in a critical section of a statically de- terminate structure. The load combinations are treated probabilistically as follows.
The load effect, S, can be expressed as follows :
S = E ( D + L + Q ) = E T
where D, L, and Q are random variables refer- ring to the effect of dead, floor, and wind load respectively, and E is a random variable with mean 1.0 representing errors in structural analysis. It can be assumed that D, L , Q, and E are statistically independent; therefore4
where D, L, and Q now and in the following refer to the specified values of the loads, and k refers to the ratio of the mean value of the specified value.
The following load combinations are con- sidered:
(a) Dead
+
Floor Load(6) Dead
+
Floor+
Wind LoadSince maximum floor loads and wind loads do not in general occur simultaneously two cases are considered: (i) combination of the maximum 30-year wind load ( Q ) with the instantaneous floor load at any time ( L i ) ; (ii) combination of the maximum 30-year floor load ( L ) with the maximum daily wind load (Q,,). Calculations were made for both cases and the lower value of p was chosen. (c) Wind -Dead - Floor Load
For combinations where wind is counter- acted by dead plus floor load, the stabilizing dead plus instantaneous floor load combines with the resistance to prevent failure. In this case the load tending to cause failure is wind only ( Q ) and the total resistance, R', includ- ing strength plus stabilizing loads effect, is calculated as follows:
R ' = R + f j + Z i
[71CAN. J. CIV. ENG. VOL. 2 , 1975 TABLE 2. Probabilistic assumptions
Coefficient of MeanIS~ecified variation V
Structural analysis E 1 .OO 0.07
Dead load D 1.00 0.07 Floor load Maximum 30-year L 0.70 0.30 At any time LI 0.21/(0,3
+
I o J ~ ) 0.30+
4/JP Wind load Maximum 30-year Q 0.80 0.25Maximum daily Q, 0.08 1 .OO
Resistance R
Yield of structural steel 1.10 0.13
Yield under wind load 1.17 0.13
*A is t h e tributary area in sq. ft. If A is in sq. m, replace A by 10.8A.
P R O B A B I L I T Y D E N S I T Y
FAILURE R E G I O N
u 1 . R - I n s
FIG. 1. Definition of safety index (8)
(d) Floor
-
Dead LoadThe same reasoning applies as in case ( c )
.
Assumptions regarding the parameters en- tering into Eqs. [4] to [7] for Canadian office and residential buildings are contained in Table 2 and derived in the Appendix. The assump- tions are 'Bayesian' in the sense that they combine statistical information with the author's judgment, which in turn is drawn from the literature, from questioning experts, and from a rough knowledge of actual failure rates.
The results are given in Figs. 2 to 9, in which limit states design, CSA S16.1-1974, is compared with CSA S16-1969 and with the 1969 AISC (American Institute for Steel Con- struction) Specification for Steel Structures assuming Canadian loading rules and condi- tions.
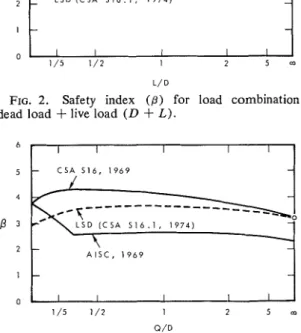
Figure 2 shows the results for dead plus floor load, a combination which applies to floor systems. Because of statistical indepen- dence of dead and floor loads,
P
is higher in the middle than at the ends of the L / D range;P
can, however, be approximated by a straightline in the regions of practical interest, ( 1 / 5 )
<
( L / D )<
5 . The circled point at full live load corresponds to the calibration point, where the new rules give the same section, hence the same safety level, as CSA S16-1969. Figure 2 shows that limit states design gives more consistent safety for all combinations ofC S A 5 1 6 , 1 9 6 9 ; A I S C . 1 9 6 9
FIG. 2. Safety index ( p ) for load combination dead load
+
live load ( D+
L).I I I I I
-
CSA 5 1 6 , 1 9 6 9 -J
LSD ( C S A 5 1 6 . 1 , 1 9 7 4 )-
-
- A I S C , 1 9 6 9-
-
I I I I I 0 1/5 1/2 I 2 5 m Q / DFIG. 3. Safety index (8) for load combination dead load
+
wind load ( D+
Q).6 6 5 5 4 4 P 3 P 3 L S D ( C S A 8 1 6 . 1 , 1 9 7 4 ) L S D ( C S A 5 1 6 . 1 , 1 9 7 4 ) 2 2 L / D = 0 . 2 I I L ,D 0 . 5 0 0 1 / 5 1 / 2 I 2 5 m 1 5 1:2 I 2 5 m o/ 0 O / D
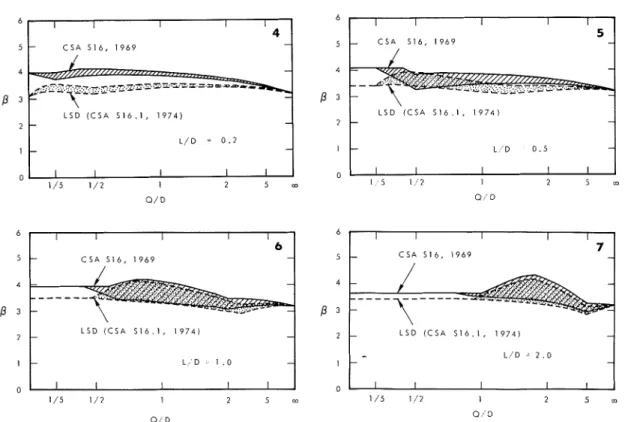
FIGS. 4, 5, 6 , 7 . Safety index ( p ) for load combination dead load
+
live load+
wind load( D
+
L+
9 ) : ( 4 ) L / D = 0.2; ( 5 ) L / D = 0.5; ( 6 ) L / D = 1.0; and ( 7 ) L / D = 2.0.L/D. Savings are obtained when thcre is sig- nificant dcad load.
Figure 3 shows similar results for the com- bination of dcad load plus wind only. The AISC rulcs, which allow a one-third increase in allowable stress for this combination, givc considerably lower safety lcvels for wind com- binations than for dead plus floor load. Limit states design gives safcty levels consistent with those in Fig. 2, and with some savlng com-
pared with existing Canadian rules when there
is significant dcad load.
Figures 4-7 show results for the combination of dcad, floor, and wind loads-a combination of practical intercst for building columns and for girders of unbraccd structures. Instead of single lincs, bands of ,B are obtained. This arises bccause thc probability of load com- binations, Eq. [6], depends on the ratio -
-
of instantancous to maximum floor load ( L , / L ) , which in turn depends on the tributary area (A)-the grcater the tributary area the higher is L,/L and the smaller is ,B. Two tributary areas, 200 ft" 18.6 m') and 10 000 ft2 (929m'), were selccted as cxtremes. The load com- bination factor, $ = 0.7, was choscn by triai and error to givc safety levels for dead plus floor plus wind load comparable to that for dead plus floor load in Fig. 2. Existing rules (probability factor of 0.75 applicd to dead plus livc plus wind) also give comparable safety levels. Somc economy is obtained for limit states design compared with existing rules when the dcad load is high or when the floor load is small.
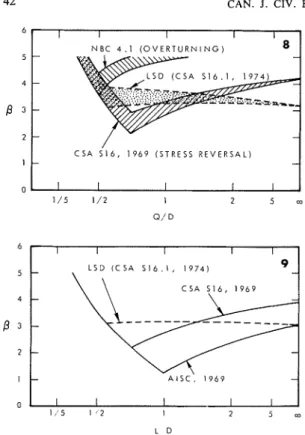
Another load combination which has given trouble in the past (Allen 1969), occurs in cases of overturning, uplift, and stress reversal, wherc dead plus floor load at any time acts as a stabilizing influence. Figure 8 shows results for the combination Q - ( D
+
L,) and Fig. 9 for the combination L-D, for example a web member in a roof truss subjected to non-uni- form snow load. The curves in Figs. 8 and 9 are made up of two intersecting lines, one a stability line, which gives high safety for low ratios of Q / D or L / D (heavy structure), the other due to stability plus strength required for42 CAN. J. CIV. ENG. VOL. 2, 1975
L l M l l 5 1
D E S I G N I C S * 5 1 6
0 I
FIG. 10. Range of safety index ( p ) for different
load combinations.
safety levels than do previous rules. Thus the same safety is maintained with some saving in material for previously over-designed structural members.
1 / 5 1 1 2 j m Column Formula for Structural Steel
FIG. 8. Safety index ( p ) for wind ( Q ) counter- acted by dead load
+
instantaneous live load (D+
L , ) .FIG. 9. Safety index ( p ) for live load ( L ) coun- teracted by dead load (D).
high ratios of Q / D or L / D (light structure). In Fig. 8 there is a range of p's depending on the amount of floor load acting-the greater the floor load acting, the safer the structure, since stabilizing floor load is neglected in the design rules. Two extreme cases are chosen- no floor load (Li = O ) , and Li for L / D = 0.5 and 10 000 ft2 (929 ma) tributary area. Some previous rules give quite inconsistent safety levels, sometimes very low levels when Q =
D
+
Li or L r'- D. Limit states design rules, onthe other hand, give consistent safety levels similar to those obtained in Figs. 2 to 7. This is essentially because limit states design uses load factors less than 1.0 for stabilizing loads (Table 1 ) . The change in rules for counter- acting loads will not appreciably affect material consumption.
The results of Figs. 2 to 9 are summarized in Fig. 10, which shows how
p
varies for all load combinations considered. Limit states de- sign gives a significantly narrower range ofFailure by yield applies to steel tension members and short compression members. As compression members get longer, however, they fail by inelastic or-elastic buckling, and the design rules should provide a safety level at least equal to that provided by failure by yield. Galambos and Ravindra (1973) have studied this problem for a pin-ended column and their results, given in Fig. 11, show that the existing
I I - - A l S C , 1 9 6 9 ( G A L A M O O S ) - - SHORT I N T E R M E D I A T E L O N G C O L U M N S C O L U M N S C O L U M N S I I I
FIG. 11. Safety index ( p ) for different column
ALLEN: LIMIT STATES DESIGN 43 TABLE 3. p study of bending resistance of reinforced concrete
Depth to Percent Bending Overall I$ factor p for L = D
reinf. d reinf. resistance
Case in. (cm) p/p,* m / M C S A VM CSA LSD? CSA LSD?
Thin slab 2$(6.4) 0.72 1.1 0.17 0.8 0.76 3 . 6 3.8
Heavily reinforced beam 10 (25) 1
.
OO* I .I 0.14 0 . 8 0.81 4.0 3 . 9Deep beam 20(51) 0.36 1.1 0.10 0 . 8 0 . 8 7 4.6 4.1
* p , maximum allowed by CSA A23.3-1973.
tBased o n separate $ factors (0.9 F,, d-&" or 6.4 mm, 0.85 x 0.7 f',).
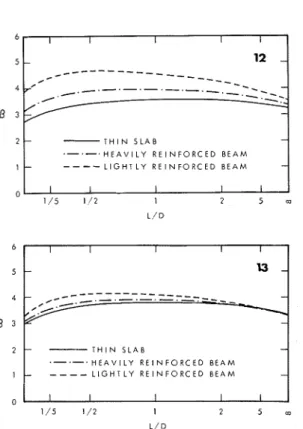
Composite Structures
Sometimes it is preferable to apply perfor- mance factors separately to the main resistance parameters than to the resistance of a member as a whole. An example is the bending resis- tance of reinforced concrete beams and slabs, which depends on the yield point of reinforcing steel, the depth to reinforcement and, for heavily reinforced sections, the crushing strength of concrete. Table 3 contains prob- abilistic assumptions for bending resistance for three extreme cases (thin slab, heavily rein- forced beam, and a deep, lightly reinforced beam) based on a detailed probabilistic study of the above parameters (Allen 1970). Figure 12 shows results of
p
for these three cases designed for dead plus floor load according to CSA A23.3-1973 (where 4 = 0.80 when an =1.25 and aT, = 1.5). Figure 13 shows similar results when the single performance factor 0.80 is replaced by separate performance factors- 0.9 for yield strength, (d - 0.25 in. (6.4 m m ) ) / d for depth to reinforcing and 0.7 x 0.85 for concrete strength. Because of the better uniformity of
p,
savings can be made for deep or lightly reinforced beams, as seen in Table 3 by comparing the over-all 4 factor with 0.8 for CSA A23.3-1973.AISC column formula (similar to that used in CSA S16-1969) gives less safety for inter- mediate columns than for short or very long
4 columns. For this reason, CSA S 16.1 - 1974 has introduced a new column formula, which pro- vides a consistent safety level for short and P intermediate columns, and a little more safety 2
for very long columns (see Fig. 1 1 )
.
1 Importance Factor I I I I I - 12 -
_ _ - - - _ _ _ _ _
.
---_
/ ,,.-.-. .-.-.-.- -.---- - /-
.-:: - 3 y - T H I N S L A B - H E A V I L Y R E I N F O R C E D B E A M - - - - - L I G H T L Y R E I N F O R C E D B E A M -Present safety factors for building structures of normal human occupancy
( r
= 1.0) are based mainly on human safety requirements-I I I I I - I3 - - - - _ _ _ _ _ . _ _ . _
_ _
- - - T H I N S L A B - H E A V I L Y R E I N F O R C E D B E A M - - - - - L I G H T L Y R E I N F O R C E D B E A M - I I I 1 I_
FIG. 12. Safety index ( p ) for bending resistance of reinforced concrete: single performance factor (CSA A23.3-1973).
FIG. 13. Safety index ( p ) for bending resistance of reinforced concrete: separated performance factors. i.e., protection against loss of life or injury. Evidence for this is the reluctance of the Asso- ciate Committee on the National Building Code to reduce safety factors to a more economic level-i.e., one which minimizes the initial cost plus the expected losses due to failure. The basic measure of human safety is risk of death or injury per year of our lives; this risk must not exceed an acceptable level, regardless of whether one is in an arena, a 100-storey build- ing, or a temporary shack. The present death rate in Canada due to structural collapse is
44 CAN. J. CIV. ENG. VOL. 2, 1975 very small, about 0.2 x per year. A death
risk of lo-" per year, or 0.01% during the life of a human, is practically insignificant compared with deaths from all other accidents -approximately 5 x per year or 4 % during the life of a human.
On this basis a decrease in the importance factor for certain classes of structures can only be justified if failure is much less likely to result in death or injury than is usually the case. Very light structures whose collapse would not endanger people inside, fail-safe structures, and structures used for storage purposes only, fall into this category. Here a higher failure risk is not only justified, but also desirable in view of economic considera- tions. At the other end of the spectrum are those structures whose collapse may involve increased danger to a large number of people or increased economic loss. The collapse of a structure housing services essential to survival during an earthquake, hurricane, or tornado, would jeopardize the safety of a large popula- tion; the collapse of a power station would result in widespread economic loss. The im-
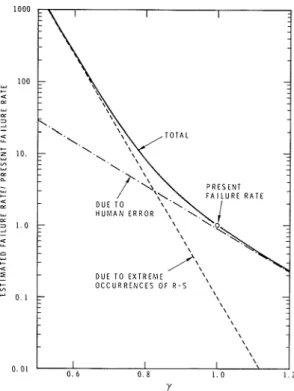
FIG. 14. Estimated failure rates for steel struc- tures.
portance factor is therefore used to set the design safety levels for different kinds of build- ings as a function of the consequences of failure.
Figure 14 indicates how a change in the importance factor affects the failure rate for engineered structures, taking into account fail- ures due to human error as well as failures due to extreme occurrences of R-S. Present failure rates ( y = 1.0) in Canada and elsewhere (Rusch and Rackwitz 1972?) indicate that no more than about 1 0 % of the collapses are due to extreme occurrences of R-S. Based on the assumptions previously used for steel structures (V, = 0.13), a 10% decrease in y corresponds approximately to a 7-fold increase in calculated failure probability. Failures due t o human error are not nearly as sensitive to changes in safety factors, and for Fig. 14 it is assumed that a 1 0 % decrease in y will no more than double the number of such failures. From Fig. 14 the following estimated failure risks are obtained for steel structures, assuming there is no change in the incidence of human error in the future.
Y Estimated Failure Rate
1.1
+
x present failure rate1.0 (normal structures) 1 x present failure rate
0.9 29 x present failure rate
0.8 (storage sheds) 8 x present failure rate
0.7 40 x present failure rate
For more variable materials such as wood ( V , = 0.3) a 10% decrease in y corresponds only to approximately a 4-fold increase in cal- culated failure probability. However, since most failures are due to human error, the effect of a change in y on estimated failure rates will
be about the same, except when y is less than about 0.8.
Present levels of safety for finished structures indicate that no increase in y is needed other than what is already done for post-disaster structures through increased wind and earth- quake loads, but that some decrease is justified for buildings for which collapse is unlikely to endanger its occupants. Furthermore, because of the predominating influence of human error, increased safety is most effectively obtained by greater care in design and construction.
The same reasoning regarding consequences of collapse applies also to the design of mem-
ALLEN: LIMIT STATES DESIGN 45 bers within a structure. Certain key members
whose failure is sudden and produces wide- spread collapse should be more reliable than members whose failure is gradual and leads t o only localized collapse. In previous standards this has been explicitly considered in the design of steel tension members with large holes and in reinforced concrete design to tied, as com- pared to spirally reinforced, concrete columns. For limit states design, changes in safety levels depending on type of member or type of failure are taken into account by the
+
factors. Because of the predominating influence of human error, however, increased safety for key members is better obtained by greater care in design and construction, by alternate paths of support to avoid progressive collapse, etc., than by de- creasing+.
Load Factors During Construction
In contrast to the finished structure, present safety levels during construction are not high. The risk of death for construction workers due to structural collapse in Ontario is 30 X per year, approximately, compared to 0.2 x
10-6 for the user. The main reason for this difference is the lack of engineering during erection, in particular for temporary supports; steps have been taken in the National Building Code and elsewhere to require engineered de- sign of temporary supports.
Figure 2 shows that for dead load only, with a load factor of 1.25,
p
= 2.7, which corre- sponds to a calculated failure probability of about lo-" Since the dead load is applied during construction this represents a danger to the construction worker. If the load factor were reduced to 1.0, say by applying an im- portance factor of 0.8, then the calculated failure probability is in the order of 1 0 % ( p = 1.2). Such a risk is not acceptable in view of the hazard to construction workers and, therefore, minimum load factors of not less than 1.25, or greater if the construction load is more uncertain than the dead load, are recommended. In applying the load factors during construction, the importance factor should be taken equal to 1.0. Also the factored resistance should be based on a realistic assess- ment of the material properties at the time of load application. Exceptions should only beallowed if, during critical times of construction, the collapse will definitely not affect anybody.
Conclusions
1. This probabilistic study indicates that limit states design partial safety factors give more consistent safety for various load combinations and various combinations of materials than do existing rules. With more consistent safety it is possible to make some material savings in cases where existing rules are overly safe (e.g.,
high dead load stresses, deep reinforced con- crete beams), and to make significant savings for buildings in which danger to human safety is significantly reduced (e.g., storage sheds). As safety factors are reduced, however, service- ability considerations will become more im- portant in design.
2. The probabilistic study indicates that a simple rule for load combinations such as the 'load combination factor I) = 0.7' is in general sufficiently accurate for office and residential building construction subject to dead, live, and wind loads. Other cases neglected in this study require further examination, in particular, load combinations involving earthquakes or other exceptional loads, and load combinations for industrial buildings and other special occu- pancies.
3. Because of the predominating influence of human error on failure rates, increased safety for key buildings or key members of buildings is better obtained by greater care in design and construction than by increasing safety factors. 4. A minimum load factor of not less than 1.25 with importance factor equal to 1.0, to- gether with a realistic assessment of factored resistance, is recommended to obtain adequate safety during construction. A higher load factor is needed if the construction loads are known less accurately than the dead load.
5. The main improvements to be obtair~ed from a change to limit states design are the unification of structural standards, and the wider applicability of common safety and ser- viceability criteria to new and different struc- tures.
Acknowledgments
The author wishes to acknowledge the ad- vice and encouragement of many people, in particular the members of the Building Struc-
46 CAN. J. CIV. EN( j. VOL. 2, 1975 tures Section of the Division of Building Re-
search, National Research Council of Canada, of CSA Committee S16 Steel Structures for Buildings, and of the Task Group on Safety Criteria for Limit States Design. This paper is a contribution of the Division of Building Re- search, National Research Council of Canada, and is published with the approval of the Director of the Division.
Appendix A. Probabilistic Assumptions for Table 2
Structural Analysis
For statically determinate structures with well defined support conditions member forces and moments can be obtained accurately from statics. On the other hand, building structures are highly indeterminate, and member forces corresponding to the ultimate limit state can only be obtained approximately; in general, however, structural analysis is conservative. This study is modelled on the simplified stati- cally determinate case, so only a small disper- sion ( V , = 0.07) is taken into account for structural analysis.
Dead Load
Except in cases where lower parts of the building have to be designed before the upper part is well defined, dead loads are known accurately in comparison with other loads. The biggest variations appear to be slab thick- ness and masonry weights. A coefficient of variation of 0.07 is representative of actual variations for normal buildings.
Floor Loads
Although all types of occupancies are in- cluded in the new limit states design rules, the main emphasis in this study is on offices and residential buildings-the most prevalent type of occupancies, particularly for buildings over a few storeys high. When studying combina- tions of floor and wind load, storage occu- pancies will be more critical because of a highcr expected live load, Li, during extreme winds; however, wind load combinations do not generally play a significant role in design of structures for low-rise warehouses.
The probabilistic assumptions given in Table 2 are based mainly on survey data of Mitchell and Woodgate (1971) and Karman (1969). For an office building floor designed for 50
lb/ft"2400 N/m2) the expected maximum live load (not including partitions) in 30 years would be about 35 Ib/ft2 (1700 N/m2). Recent studies (e.g., McGuire and Cornell ( 1974) ) have indicated that the NBC formula for re- duction of floor load with tributary area, 0.3
+
l O / f l , is fairly consistent with calcu- lated maximum lifetime loads based on mea- surements. Therefore, the ratio of expected 30-year load to NBC design load will be as- sumed to be 0.7, independent of tributary area. Load survey results of Mitchell and Woodgate (1971), Karman (1969), and Bryson and Gross (1967) indicate that the coefficient of variation of maximum floor load is about 0.3 and is unchanged with increasing area. Based on these assumptions the specified floor load corresponds to an exceedence probability of 8-9%, depending on the distribution assumed. For combination of dead, live, and wind loads, the load at any time, Li, is required. For office and residential buildings, the expected load at any time is approximately equal to the 30-year load for an infinite area. For offices this corresponds to 0.7 X 0.3 X 50 = 10.5 Ib/ft"500 N/m", a value confirmed by sur- vey results (Bryson and Gross 1967). On the other hand, the cov of load at any time in- creases with a decrease in area. The following is based on Table 7 of Mitchell and Woodgate (1971):V,,i = 0.3
+
4 / m Wind LoadsProbabilistic information for both the maxi- mum 30-year wind loads and the maximum daily wind loads is needed for calculating
P
for combinations of dead, live, and wind loads.Wind loads p are determined as follows (NBC Commentary on Wind Loads) :
wherc q is the reference velocity pressure ob- tained from climatic data, C , is the exposure factor which takes into account ground rough- ness, C , the gust effect factor, and C,, the pressure coefficient for the surface.
The main source of wind load uncertainty is in the measured wind speeds, i.e., the refer- ence velocity pressure q, equal to 0.0027 V2
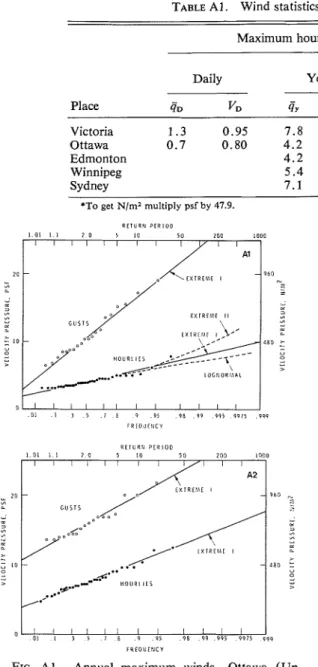
TABLE Al. Wind statistics (approx. 30 years data) Maximum hourly pressures PSF*
30-Yearly
Daily Yearly (derived)
43 0 Place ?D VD 4~ VY 43 o V3 o - G'NBC Victoria 1.3 0.95 7.8 0.26 13.1 0.15 1.07 Ottawa 0.7 0.80 4.2 0.28 7.3 0.16 1.08 Edmonton 4.2 0.34 8.0 0.18 1.08 Winnipeg 5.4 0.29 9.5 0.16 1.08 Svdnev 7.1 0.25 11.8 0.15 1.07
*To get N/mZ multiply psf by 47.9.
R l l U R N P E R I O D
1 0 1 1 1 2 0 5 1 0 5 0 2 0 0 I U D 0
I I I l l 1 1 I 1 i / l i I I
FIG. A l . Annual maximum winds-Ottawa (Up-
lands).
FIG. A2. Annual maximum winds-Victoria (Gon- zales).
(0.050 V" where V is the maximum annual wind speed in mph (km/h). Figures A1 and A2 show distributions, plotted on Extreme Value Type I paper, of the annual maximum velocity pressures at two Canadian locations (Anonymous 1946-1974); the main statistical parameters are given in Table A l . Coefficients of variation (cov) of annual maximum velocity
pressures (hourlies) vary from 0.25 to 0.34, with an average 0.28. If the Extreme Value Type I distribution is assumed for winds, by transformation the maximum 30-year velocity pressures have an average cov of 0.16. If the Extreme Value Type I1 distribution is assumed, by transformation the cov of maximum 30-year velocity pressures is 0.28, i.e., is unchanged. Which distribution is correct in the extreme upper tail cannot be determined theoretically. Climatic data on wind loads in Canada (Anon- ymous 1946-1974) indicate that the cov de- creases somewhat with the length of period. A cov of 0.20 is therefore assumed for vari- ability in 30-year maximum wind pressures.
The other source of wind load uncertainty is in the estimation of the parameters C,, C,, and C,,. The greatest uncertainty is in estimation of the ground roughness. An increase in ground roughness increases C,, but decreases C , , so the two should be considered together, i.e., C, x C,. For a typical building, 100 x 50 x
200 ft ( 3 0 x 15 x 60 m ) high, three exposure categories are given in the NBC-open, urban, and city center; for these three categories,
C . X C, is calculated to be in the ratio of 0.75/ 1.00/ 1.48. This indicates that uncertainty in exposure can be represented by a cov of approximately 0.13, which compares reason- ably well with a cov of 0.1 for C, determined by Vickery ( 1970). Estimation uncertainty for all other parameters, including C,,, is assumed to be represented by a cov of 0.10. This gives a total uncertainty cov for 30-year wind loads, including actual wind variabilit and modelling
uncertainty, of
d%i
= 0.26. Avalue of 0.25 is assumed for this study. A similar approach is required to estimate the ratio of expected 30-year wind load (&)
48 CAN. J. CIV. ENG. VOL. 2, 1975
to NBC design wind load (psnc - the 30-year return wind). The statistical results in Table 1 show that the ratio ~ 3 0 / q x 1 3 c is close to 1.1 for Extreme Value Type I distribution; a similar result is obtained for Extreme Value Type 11. Modelling of wind loads in the NBC tends to be conservative for the following reasons: ( 1 ) wind loads are assumed to occur in the most unfavorable direction; (2) estimation of model- ling parameters-ground roughness and pres- sure coefficients C,, tend to be chosen con- servatively on the average. The following re- duction coefficients are assumed for these effects: reduced probability of wind blowing in the most unfavorable direction 0.85; ground roughness, pressure coefficient, and all other modelling assumptions 0.85. This gives a ratio of expected 30-year wind load to the NBC design wind load of 1.1
x
0.85x
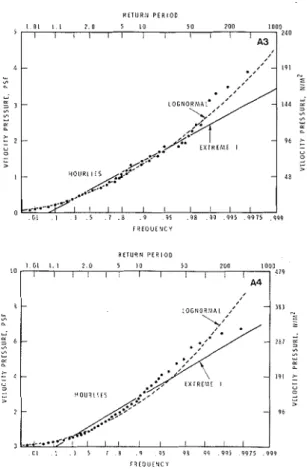
0.85 = 0.8. For maximum daily wind loads Figs. A3 and A4 show distributions of maximum daily velocity pressures (hourlies) at two locations in Canada (Anonymous 1946-74)-Ottawa, a location of moderate winds, and Victoria Gonzales, a consistently windy location. The results are given for one year of records only, but a check with records of other years showed very little difference in the results. Figures A3 and A4 show that maximum daily velocity pressures follow the lognormal distribution more closely than the Extreme Value Type Idistribution. Table A1 contains the main statis- tical parameters. The ratio of expected maxi- mum daily to expected 30-year pressure is close to 0.1 in both cases, so that the ratio of expected maximum daily wind pressure to NBC design load would be 0.8 x 0.1 = 0.08. The cov, considerably higher for maximum daily wind pressure, will be taken as 1 for calculation.
Resistance to Yield
The resistance of a structural member to general yielding can be expressed as
where M is a material property such as the yield point of steel, F is a geometric property such as area or plastic section modulus, and P represents the resistance formula. These parameters are subject to uncertainty. Based on existing information (Galambos and Ra-
1 01 1.1 2.0 5 10 50 ZOO I000
I I I I I I I I I 4 7 9
A 4
FIG. A3. Daily maximum winds-Ottawa (Up- lands).
FIG. A4. Daily maximum winds-Victoria (Gon- zales).
vindra 1973), the following probabilistic as- suinptions are made under static loading conditions:
Expected/Specified COV
Yield point (static) 1.05 0.10
Geometric 1 .O 0.05
Resistance formula 1.05 0.07
From this the expected resistance is 1.05
x
1.05 = 1.1 times the specified resistance and the cov is dO.1" 0.05" 0.077' = 0.13. For B
wind loading, rate effect increases the yield stress by 6 % approximately (Rao et 01. 1966), so that the expected resistance is 1.17 times the specified resistance.
ALLEN, D. E. 1969. Safety factors for stress reversal. Int. Assoc. Bridge Struct. Eng. Publ., 29-11, pp. 19-27.
1970. Probabilistic study of reinforced concrete in bending. Nat. Res. Counc. Can., Div. Bldg. Res. Tech. Paper No. 31 1 (NRCC 11139), Ottawa.
ALLEN: LIMIT STATES DESIGN 49 ANONYMOUS. 1946-74. Monthly recordsof meteorological
observations in Canada. Environment Canada, At- mospheric Environment Service, 4905 Dufferin St., Downsview. Ont.
BENJAMIN, J. R., and CORNELL, C. A. 1970. Probability, statistics and decision for civil engineers. McGraw- Hill. Book Co., New York.
BRYSON, J. O., and GROSS, D. 1967. Techniques for the survey and evaluation of live floor loads and fire loads in modem office buildings. Nat. Bur. Stand., Bldg. Sci. Ser. 16, Washington, D.C.
CORNELL, C. A. 1969. A probability-based structural code. J. Am. Concrete Inst., 66, No. 12, pp. 974-985. GALAMBOS, T. V., and RAVINDRA, M. K. 1973. Tentative
load and resistance factor design criteria for steel buildings. Struct. Div., Civ. Environ. Eng. Dept., School of Engineering and Appl. Sci., Washington Univ., St. Louis, Mo., Res. Rep. No. 18.
KARMAN, T. 1969. Statistical investigations on live load on floors. Unpubl. rept., presented to Committee W23 of the Conseil International du Bitiment (International Council for Building Research, Studies and Documen- tation). Copy on file, Library, Div. Bldg. Res., Nat. Res. Counc. Can., Ottawa.
KENNEDY, D. J. L. 1974. Limit states design-an innova- tion in design standards for steel structures. Can. J. Civ. Eng., 1,No. 1, pp. 1-13.
KUIPERS, J. 1968. Structural safety. Heron, No. 5, pp. 1-41.
MCGUIRE, R. K., and CORNELL, C. A. 1974. Live load effects in office buildings. J. Am. Soc. Civ. Eng., Struct. Div., 100, S T 7 , pp. 1351-1366.
MITCHELL, G . R., and WOODGATE, R. W. 1971. Floor loadings in offices-the resultsof a survey. Dept. En- viron., Bldg. Res. Station, Garston, England, Current Paper 3/71.
RAO, N. R. N., LOHRMANN, M., and TALL, L. 1966. Effect of strain rate on the yield stress of structural steels. J. Materials (Am. Soc. Test. Mater.), 1, No. 1, pp. 241-262.
RUSCH, H., and RACKWITZ, R. 1972? The significance of the concept of probability of failure as applied to the theory of structural safety. Special print from the commemorative publication entitled "Development -Design-Construction" on the occasion of the hun- dredth anniversary of Held und Francke Bauaktienge- sellschaft, Munich, West Germany.
RZHANITZYN, A. R. 1957. It is necessary to improve the standards of design of building structures. Stroite1'- naya Promyshlennost' No. 8. (English translation in Tech. Translation 1368, Nat. Res. Counc. Can.,
1969).
VICKERY, B. J. 1970. On the reliability of gust loading factors. R o c . Tech. Meet. Concerning Wind Loads on Buildings and Structures. Nat. Bur. Stand., Bldg. Sci. Ser. 30, pp. 93-104.