Publisher’s version / Version de l'éditeur:
Vous avez des questions? Nous pouvons vous aider. Pour communiquer directement avec un auteur, consultez la
première page de la revue dans laquelle son article a été publié afin de trouver ses coordonnées. Si vous n’arrivez
pas à les repérer, communiquez avec nous à [email protected].
Questions? Contact the NRC Publications Archive team at
[email protected]. If you wish to email the authors directly, please see the
first page of the publication for their contact information.
https://publications-cnrc.canada.ca/fra/droits
L’accès à ce site Web et l’utilisation de son contenu sont assujettis aux conditions présentées dans le site
LISEZ CES CONDITIONS ATTENTIVEMENT AVANT D’UTILISER CE SITE WEB.
Paper (National Research Council of Canada. Division of Building Research),
1985
READ THESE TERMS AND CONDITIONS CAREFULLY BEFORE USING THIS WEBSITE.
https://nrc-publications.canada.ca/eng/copyright
NRC Publications Archive Record / Notice des Archives des publications du CNRC :
https://nrc-publications.canada.ca/eng/view/object/?id=a6c481c0-39e6-4c99-a102-e87afda88c3b
https://publications-cnrc.canada.ca/fra/voir/objet/?id=a6c481c0-39e6-4c99-a102-e87afda88c3b
NRC Publications Archive
Archives des publications du CNRC
For the publisher’s version, please access the DOI link below./ Pour consulter la version de l’éditeur, utilisez le lien
DOI ci-dessous.
https://doi.org/10.4224/20375885
Access and use of this website and the material on it are subject to the Terms and Conditions set forth at
Ice interaction with Adams Island, winter 1982-83
1
Scr
/
3 7
57
National Research
Conseil national
ouncil Canada
de recherche8 Canada
c,
2
Division of
Division des
Building Research
recherches en batiment
Ice Interaction with Adams
Island, Winter 7982
-
83
by R.M.W. Frederking,
M.
Sayed,
E.
Wessels et al
Reprinted from
l AHR
7th International Symposium on Ice
Hamburg, W. Germany, Aug. 27
-
31, 1984
Proceedings, Vol. Ill, p. 187-201
DBR Paper No. 1295
Price $1.50
NRCC 24682
-
RisuME
L'objet de cette etude est d'examiner l'interaction du manteau
glaciel avec une petite 'ile de 200 m de diamPtre, ainsi que le
comportement du manteau glaciel en relation avec les forces
1
environnementales. Les facteurs environnementaux tels
que
le
vent, la temperature de l'air, les courants et les marees ont
Ct6 mesures.
Les deplacements horizontaux du manteau glaciel
ont varid entre 10 cm par jour en mars et 2 cm par jour en
juin.
La direction des deplacements ne correspondait pas
3
celle des vents et des courants. Les taux moyens de ddformation
mesurSs avec des jauges de petite longueur (0.3 cm) et de
grands systemes triangulaires (de '100 m) Staient de l'ordre de
s-l.
Les mesures directes de contrainte et les valeurs
ddduites du taux de deformation e'taient de l'ordre de 100 kPa.
-
- -
- - - - -
L4HR Ice
&mposiWn
1984
Hamburg
ICE INTERACTION WITH ADAMS ISLAND, WINTER 1982-83
R.M.W. Frederking National Research Council Canada
M. Sayed of Canada
E. Wessels Hamburgische Schiffbau- West Germany
Versuchsanstalt GmbH.
A.J. Child The B r i t i s h Petroleum Company England p.1.c.. BP Research Centre
D. Bradford F i s h e r i e s and Oceans Canada Canada
ABSTRACT
A small i s l a n d (200 m i n diameter) i s being used t o study t h e i n t e r a c t i o n of t h e i c e cover w i t h t h e i s l a n d and t h e response of t h e i c e cover t o t h e environmental d r i v i n g f o r c e s . The environmental f a c t o r s of wind, a i r temperature, c u r r e n t and t i d e were measured. Horizontal movements of t h e i c e cover v a r i e d from 10 cm per day i n March t o 2 cm per day i n June. The d i r e c t i o n of movement d i d not correspond t o wind o r c u r r e n t d i r e c t i o n . Average s t r a i n r a t e s measured with small (0.3 m) gauge l e n g t h s t r a i n meters and l a r g e (-100 m) t r i a n g u l a r a r r a y s were of t h e o r d e r of s-l. Direct measurements of s t r e s s and v a l u e s c a l c u l a t e d from t h e s t r a i n r a t e were of t h e order of 100 kPa.
INTRODUCTION
Only l i m i t e d information i s a v a i l a b l e on i c e behaviour and i c e l o a d s on o f f s h o r e s t r u c t u r e s . Extensive i c e monitoring programs have been c a r r i e d o u t f o r petroleum e x p l o r a t i o n s t r u c t u r e s c o n s t r u c t e d i n t h e southern a r e a of t h e Beaufort Sea but much of t h e information remains p r o p r i e t a r y . Although most of t h e o f f s h o r e e x p l o r a t i o n a c t i v i t y i n t h e A r c t i c i s i n t h e Beaufort Sea r e g i o n , i t i s d e s i r a b l e t o o b t a i n information on i c e behaviour and l o a d s i n o t h e r a r e a s of t h e A r c t i c , where circumstances a r e d i f f e r e n t . For such s t u d i e s , man-made s t r u c t u r e s a r e n o t a v a i l a b l e , but small i s l a n d s may s i m u l a t e t h e i r e f f e c t s on i c e covers. 'his approach has been used i n i n v e s t i g a t i o n s of l a r g e m u l t i y e a r f l o e impacts on Hans Island
r
Fairway Rock, e.g. Kovacs and Sodhi, 1981. A s i m i l a r study i s being c a r r i e d out a t Adams Island i n t h e Lancaster Sound a r e a (Frederking e t a l , 1983) which i s t h e s u b j e c t of t h i s comuunication.
The p r o j e c t involves a number of p a r t i c i p a n t s and w i l l extend over f i v e winter seasons. I t s o b j e c t i v e i s t o determine t h e response of t h e i c e s h e e t t o t h e environmental d r i v i n g f o r c e s , and consequent i c e i n t e r a c t i o n with t h e i s l a n d . R e s u l t s of t h e f i r s t winter of o b s e r v a t i o n s (1981-82)
have been reported elsewhere (Frederking e t a l , 1983). For t h e winter of
4
1982-83, s i t e v i s i t s were made i n November, March, A p r i l and June, therebyallowing t h e progression of i c e conditions and behaviour throughout t h e winter t o be followed. This paper p r e s e n t s measurements of environmental f a c t o r s , i.e., wind, c u r r e n t , t i d e and temperature; and movements,
deformations, s t r a i n s and s t r e s s e s i n t h e i c e cover a d j a c e n t t o t h e i s l a n d f o r t h e winter of 1982-83.
SITE DESCRIPTION
The a r e a of i n v e s t i g a t i o n i s a t t h e i n t e r s e c t i o n of Lancaster Sound and Navy Board I n l e t (73'45'N. 81°30'W) (Figure 1). Adams I s l a n d i s s i t u a t e d about 3 km ENE of a base camp (Borden S t a t i o n ) on t h e Borden Peninsula. It i s a t t h e entrance t o Navy Board I n l e t and i n a land-fast i c e regime from
,
U S U A L D l l L C T l O N OF P A C K I C E M O V E M E N T---_____--__
U I U A L L A N D - F A S T I C E E D G E - - - B A F F I N I S L A N P 82"OO'W 8 1 " 3 0 1 W 8 l 0 0 O ' W Figure 1Location map of study a r e a
188
November t o June. Pack i c e g e n e r a l l y moves i n a n e t e a s t e r l y d i r e c t i o n through Lancaster Sound under t h e a c t i o n of wind and c u r r e n t throughout t h e w i n t e r , b u t o c c a s i o n a l l y i t becomes l a n d - f a s t , a s was t h e c a s e f o r t h e winter of 1982-83.
During a s i t e v i s i t November 9-15, 1982, t h e i c e i n t h e study a r e a was a l r e a d y land-fast, w i t h a t h i c k n e s s of 40 cm. The edge of t h e land-fast i c e was about 2 km t o t h e n o r t h of t h e i s l a n d . The l a t e March s i t e v i s i t showed no s u b s t a n t i a l change i n i c e c o n d i t i o n s immediately around t h e i s l a n d but t h e i c e i n Lancaster Sound had become land-fast. k v e l f i r s t - y e a r i c e t h i c k n e s s had increased t o 1.7 m, and by e a r l y May i t was 1.9 m. In e a r l y April an a e r i a l photography survey was c a r r i e d out i n t h e area. A photograph of t h e i c e around t h e i s l a n d appears i n F i g u r e 2. Buckling f e a t u r e s can be seen i n t h e i c e cover around t h e southern perimeter of t h e i s l a n d . The i c e i s mostly f i r s t - y e a r , w i t h occasional small m u l t i y e a r pieces.
Figure 2
ENVIRONMENTAL DATA
Environmental f a c t o r s t h a t can g e n e r a t e l o a d s on a n i c e cover i n c l u d e wind, c u r r e n t , t i d e and a i r temperature changes. A l l t h e s e f a c t o r s were measured from March through June.
Wind speed and d i r e c t i o n were recorded a t Borden S t a t i o n from March 20 t o t h e end of June. The predominant wind d i r e c t i o n during t h i s period was from t h e west. About h a l f t h e time, wind speed was l e s s than 15 kmlhr, o n e t h i r d of t h e time 15 t o 30 km/hr, and t h e remainder of t h e time above
30 km/hr. The winds above 15 lan/hr were almost e x c l u s i v e l y from t h e west, except i n May, when they were predominantly from t h e south. There were occasional storms with very high wind speeds from t h e south. Speed and d i r e c t i o n f o r one such occasion a r e i l l u s t r a t e d i n F i g u r e 3. Air temperatures i n March were i n t h e range -30 t o -35OC. As t h e season progressed t h e r e was a gradual warming t o -15 t o -20°C i n e a r l y May and 0
t o 4OC i n e a r l y June.
The ocean c u r r e n t was measured with an Aanderaa RCM-4 recording c u r r e n t meter. It was deployed about 2 lan northwest of Adams I s l a n d , 3 m below t h e s u r f a c e i n an a r e a where water depth was about 35 m. The record covered t h e period A p r i l 16 t o June 11. Readings were taken a t ten-minute i n t e r v a l s . The maximum c u r r e n t v e l o c i t y was 0.37 m/s. The predominant
Figure 3
Mean hourly wind speed and d i r e c t i o n a t Borden S t a t i o n i n A p r i l 1983
I
190
20
0
d i r e c t i o n was t o t h e e a s t and t h a t a s s o c i a t e d w i t h peak speeds was t o t h e east-southeast. An a n a l y s i s of t h e c u r r e n t record showed t h e c u r r e n t s t o
be s t r o n g l y r e l a t e d t o t h e t i d e . The east-west component of t h e c u r r e n t cycled between 0 and 0.3 m/s t o t h e e a s t , r e s u l t i n g i n a mean speed of 0.1 m/s t o t h e e a s t . The north-south component cycled from 0.1 m/s t o t h e south t o 0.2 m/s t o t h e n o r t h with no n e t north-south movement. The instrument a l s o recorded water temperature and s a l i n i t y , g i v i n g steady values of -1.8S°C and 32.8%,, throughout t h e measurement period.
An Aanderaa TC-3A t i d e recorder was deployed on March 20 about 1 km n o r t h
of Borden S t a t i o n i n 5 m of water; i t was recovered on June 14. Recordings were made a t f i f t e e n - m i n u t e i n t e r v a l s . Maximum t i d e ranges were up t o
1.9 m i n mid- and l a t e May; t h e s e were a l s o times of h i g h c u r r e n t v e l o c i t i e s . T i d a l regime can be described a s mixed, mainly s e m i d i u r n a l . The maximum c u r r e n t of 0.37 m/s t o t h e east-southeast was a s s o c i a t e d w i t h t h e t i d e f a l l i n g from i t s maximum peak.
ICE MOVEMENTS.AND DEFORMATIONS
An e l e c t r o n i c d i s t a n c e measuring (EDM) instrument (Wild DI-20) coupled t o a
I
C t h e o d o l i t e (Wild T-2) was used t o measure movements of r e f e r e n c e p o i n t s on I
!
t h e i c e cover. Prism r e f l e c t o r s a t t a c h e d t o wooden s t a k e s o r camera t r i p o d s i n d i c a t e d t h e r e f e r e n c e points. The EDM has an accuracy of5
mm f o r d i s t a n c e s up t o 1000 m, when c o r r e c t i o n s a r e a p p l i e d f o r atmospheric d e n s i t y (barometric p r e s s u r e and temperature). Horizontal and v e r t i c a l angle measurements had an accuracy of 25 seconds of arc. P o s i t i o n s of r e f e r e n c e p o i n t s on t h e i c e were e s t a b l i s h e d by measuring t h e i r d i s t a n c e and bearing from f i x e d base l i n e s on Adam I s l a n d and a t Borden S t a t i o n . The Borden S t a t i o n and Adams Island base l i n e s were t i e d t o each o t h e r .Two a r r a y s of r e f e r e n c e p o i n t s were e s t a b l i s h e d on t h e i c e cover i n March, one around Adams I s l a n d ( F i g u r e 4a) and t h e o t h e r a d j a c e n t t o Borden S t a t i o n (Figure 4b). A c o o r d i n a t e system centred on Adams I s l a n d , w i t h e a s t t h e p o s i t i v e x - d i r e c t i o n and n o r t h t h e p o s i t i v e y-direction, was s e t up t o s p e c i f y t h e l o c a t i o n ( i n metres) of t h e r e f e r e n c e p o i n t s and o t h e r instrumentation on t h e i c e . A l l t h e r e f e r e n c e p o i n t s , w i t h t h e exceptions of MY-1 and MY-2 i n Figure 4b, were on f l o a t i n g i c e . Point MY-1 was on a grounded bergy b i t and MY-2 on a multi-year f l o e . P o s i t i o n s were measured from March 20 t o 26 a t two-day i n t e r v a l s . Another sequence of readings was
,
5 0 0 id"
Z 4 + m 1-
m I + 3 0 7 0 2 + Q 0 Z -500 E A S T - W E S T D I S T A N C E , m Figure 4(a) I c e movement array and i c e
E movements a t Mams Island,
-
"
z? March-
June 1983 4 + m-
0,
- 5 0 0-
(b) Ice movement array and i c e=
0 .A
2
+
movements a t Borden Station,
Q 0 March
-
June 1983 Z-
1000 - 3 5 0 0 - 3 0 0 0 - 2 5 0 0 E A S T - W E S T D I S T A N C E , m192
1
taken from A p r i l 27 t o May 7 and a f i n a l sequence between June
10
and14.
By drawing s t r a i g h t l i n e s between s u c c e s s i v e l y measured p o s i t i o n s of a
r e f e r e n c e p o i n t , movement v e c t o r s can be e s t a b l i s h e d . These a r e a l s o
p l o t t e d i n Figure
4.
A l l t h e r e f e r e n c e p o i n t s moved i n a n o r t h - n o r t h e a s t e r l y d i r e c t i o n . h r i n g
t h e March measuring period, t h e movement r a t e of t h e i c e cover averaged
100
mmlday. During t h e i n t e r v a l from March t o A p r i l , t h e average r a t e was80
mmlday and from May t o June, i t was about20
mm/day.
Movements of t h eBorden S t a t i o n and Adam Island a r r a y s were very s i m i l a r . Also t h e
grounded i c e f e a t u r e s moved a t e s s e n t i a l l y t h e same r a t e a s t h e f l o a t i n g i c e cover.
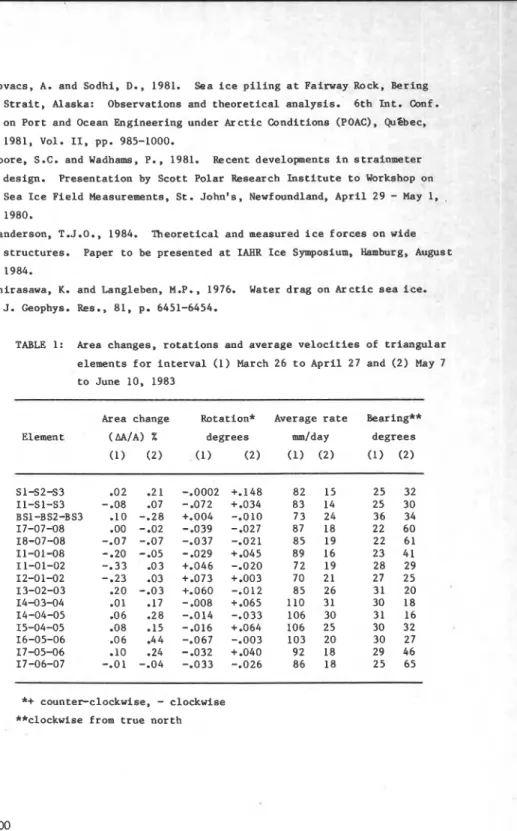
Detailed examinations were made of r e l a t i v e movements of t h e r e f e r e n c e
p o i n t s i n t h e Adam I s l a n d a r r a y . The a r e a change, r o t a t i o n , average
movement r a t e and d i r e c t i o n of a number of t r i a n g u l a r elements defined by t h r e e neighbouring r e f e r e n c e p o i n t s were c a l c u l a t e d and a r e summarized i n
Table 1. The p r o p o r t i o n a l change of a r e a of an element (AA/A) i s t h e
change i n a r e a of a n element (AA) divided by t h e i n i t i a l a r e a of t h a t
element (A). Rotation i s t h e average r o t a t i o n of t h e t h r e e s i d e s of t h e
element. Average r a t e and bearing a r e t h e average r a t e of movement and
d i r e c t i o n of t h e t h r e e r e f e r e n c e p o i n t s d e f i n i n g t h e element. Elements t o
t h e s o u t h and west showed a r e a l o s s o r compression (&A/A n e g a t i v e ) while
t h e o t h e r elements showed a r e a gain. There i s a l s o a p a t t e r n i n t h e
r o t a t i o n s of t h e elements. Elements t o t h e e a s t of t h e i s l a n d have a
counter-clockwise r o t a t i o n and those t o t h e west, a clockwise r o t a t i o n .
T h i s i n d i c a t e s t h a t t h e i s l a n d i s e x e r t i n g a n i n f l u e n c e on t h e movements
and deformations of t h e i c e cover immediately a d j a c e n t t o it.
It was a l s o p o s s i b l e t o u s e d a t a on t h e change i n d i s t a n c e between any two
r e f e r e n c e p o i n t s t o determine s t r a i n s i n t h e p l a n e of t h e i c e cover. 'Ihese
s t r a i n s were determined over gauge l e n g t h s from
30
m up t o500
m, s c a l e sover which t h e i c e i s n o t n e c e s s a r i l y a homogeneous body. Therefore, t h e
r e s u l t i n g s t r a i n s a r e average o r bulk values a p p l i c a b l e t o t h e d i s t a n c e
over which they were measured. (Local s t r a i n s measured over gauge l e n g t h s
of
0.3
t o 1 m could be s u b s t a n t i a l l y d i f f e r e n t . ) Given t h e u n c e r t a i n t y i nt h e l o c a t i o n of t h e r e f e r e n c e p o i n t s , t h e s t r a i n s determined were a c c u r a t e
P r i n c i p a l s t r a i n s and t h e i r o r i e n t a t i o n s were determined f o r a number of
t r i a n g u l a r elements around Adams Island. The t o t a l p r i n c i p a l s t r a i n change
over t h e measurement p e r i o d from March t o June i s presented i n F i g u r e 5.
The maximum s t r a i n determined over t h e 85-day d u r a t i o n of t h e measurements
was 5000 x m/m, which y i e l d s an average s t r a i n r a t e of about s l .
S t r a i n r a t e s were g e n e r a l l y of t h e order of 1 0 - l o s - l , but f o r some s h o r t
time i n t e r v a l s ( 2 days), s t r a i n r a t e s a s high a s 5 x s - l were
observed. To t h e s o u t h , e a s t and west of t h e i s l a n d , one of t h e p r i n c i p a l
s t r a i n s i n t h e t r i a n g u l a r elements was compressive and o r i e n t e d towards t h e
i s l a n d . To t h e n o r t h , e a s t and west of t h e i s l a n d , elements had l a r g e
t e n s i l e p r i n c i p a l s t r a i n s o r i e n t e d i n a north-south d i r e c t i o n . The n a t u r e
of t h e s t r a i n s shows t h a t t h e i c e s h e e t i s responding t o t h e presence of t h e i s l a n d .
STRAIN MEASUREMENTS
The D e l t a s t r a i n m e t e r s deployed a t Adam I s l a n d were based on t h e S c o t t Polar Research I n s t i t u t e Wirehod Strainmeter (Moore and Wadhams, 1981) and
t h e BP Sunbury s t r a i n m e t e r . They had a gauge l e n g t h of 0.3 m and contained
MARKERS
o
-
1S T R A I N SCALE
Figure 5
t h r e e measuring arms i n a 60' r o s e t t e formation. D r i f t i s g e n e r a l l y l e s s than an e q u i v a l e n t s t r a i n r a t e of 5 x s - l , one o r two o r d e r s of magnitude lower than s t r a i n r a t e expected d u r i n g s i g n i f i c a n t loading events. More s e r i o u s d r i f t o f t e n occurs i n t h e f i r s t one o r two days following i n s t a l l a t i o n , due t o r e l a x a t i o n of r e s i d u a l s t r e s s e s and temperature e q u i l i b r a t i o n .
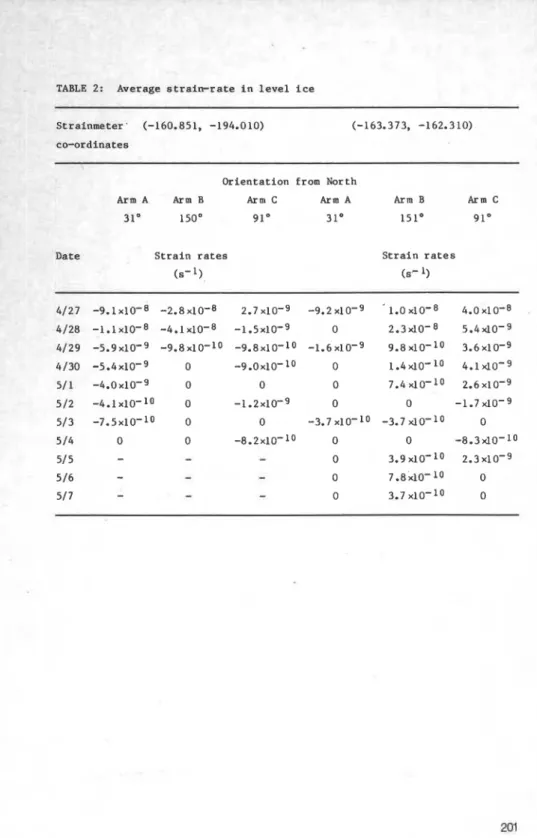
Two instruments were i n s t a l l e d on April 26 on f l a t i c e a t c o o r d i n a t e s -160.851, -194.010 and -163.373, -162.310 ( s e e F i g u r e 4a f o r coordinate system). This a r e a was considered t o be s u f f i c i e n t l y d i s t a n t from Mams I s l a n d t o e l i m i n a t e t h e p r o b a b i l i t y of bending of t h e i c e cover. A s a precaution, t h r e e l e v e l surveys were made during t h e period of measurement. These showed no s i g n of bending w i t h i n t h e accuracy of measurement
(estimated t o be k15 mm over a 30.m l i n e ) .
I c e s t r u c t u r e was examined a t each s t r a i n m e t e r s i t e a t t h e beginning and end of t h e period of measurement. The i c e was about 2 m t h i c k , t h e t o p 50 mm of which was g r a n u l a r , t h e remainder columnar. Ice temperatures ranged from -16'C a t t h e s u r f a c e t o -0.5OC a t t h e base.
By April 29, t h r e e days a f t e r i n s t a l l a t i o n , s t r a i n r a t e d r i f t was below 5 x s-1. h e instrument operated u n t i l i t was removed on May 6. The o t h e r was damaged by a p o l a r bear on May 4. Average s t r a i n r a t e s a r e given i n Table 2. Analysis of t h e d a t a t a p e s revealed t h a t t h e s t r a i n r a t e s never exceeded s-I- Converting t h e s e s t r a i n r a t e s t o s t r e s s
(Sanderson, 1984), average s t r e s s l e v e l s were below 70 H a and never exceeded 140 kPa f o r t h e measurement period.
I N SITU ICE STRESS MEASUREMENTS
A transducer developed by Cox and Johnson (1983) capable of measuring b i a x i a l s t r e s s e s i n t h e plane of t h e i c e cover was used t o make i n s i t u measurements of s t r e s s i n t h e i c e cover. Controlled l a b o r a t o r y t e s t s by Cox and Johnson (1983) with t h e transducer i n i c e demonstrated t h a t t h e sensor has a low temperature s e n s i t i v i t y (5 kPaf°C), a r e s o l u t i o n of 20 kPa and an accuracy of b e t t e r than 10% under a v a r i e t y of loading conditions. Ten of t h e s e b i a x i a l i c e s t r e s s sensors. IRAD Gage t y p e VBS-3, were used i n t h e f i r s t - y e a r l e v e l i c e around Adam Island.
-
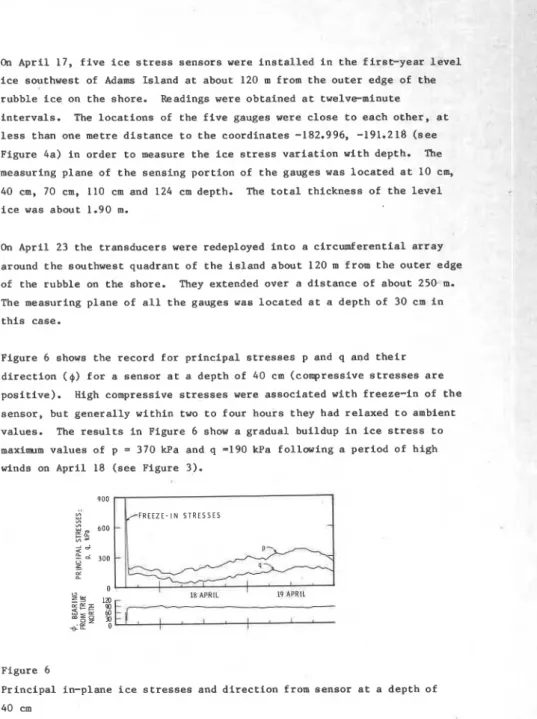
On A p r i l 17, f i v e i c e s t r e s s s e n s o r s were i n s t a l l e d i n t h e f i r s c - y e a r l e v e l i c e southwest of Adam Island a t about 120 m from t h e o u t e r edge of t h e rubble i c e on t h e shore. Readings were obtained a t t w e l v e m i n u t e i n t e r v a l s . The l o c a t i o n s of t h e f i v e gauges were c l o s e t o each o t h e r , a t l e s s than one metre d i s t a n c e t o t h e coordinates -182.996, -191.218 ( s e e Figure 4a) i n order t o measure t h e i c e s t r e s s v a r i a t i o n with depth. The measuring plane of t h e s e n s i n g p o r t i o n of t h e gauges was l o c a t e d a t 10 cm,
40 cm, 70 cm, 110 cm and 124 cm depth. The t o t a l thickness of t h e l e v e l i c e was about 1.90 m.
On April 23 t h e t r a n s d u c e r s were redeployed i n t o a c i r c u m f e r e n t i a l a r r a y around t h e southwest quadrant of t h e i s l a n d about 120 m from t h e o u t e r edge of t h e rubble on t h e shore. They extended over a d i s t a n c e of about 2 5 @ m .
The measuring plane of a l l t h e gauges was l o c a t e d a t a d e p t h of 30 cm i n t h i s case.
Figure 6 shows t h e record f o r p r i n c i p a l s t r e s s e s p and q and t h e i r d i r e c t i o n
(0)
f o r a sensor a t a depth of 40 cm (compressive s t r e s s e s a r e p o s i t i v e ) . High compressive s t r e s s e s were a s s o c i a t e d w i t h freeze-in of t h e s e n s o r , b u t g e n e r a l l y w i t h i n two t o f o u r hours they had r e l a x e d t o ambient values. The r e s u l t s i n Figure 6 show a gradual buildup i n i c e s t r e s s t o maximum values of p = 370 kPa and q =I90 kPa following a p e r i o d of high winds on April 18 ( s e e Figure3).
900 .A / F R E E Z E I N S T R E S S E S m
g,
600-
- m Figure 6 I P r i n c i p a l in-plane i c e s t r e s s e s and d i r e c t i o n from sensor a t a depth ofI 40 cm
I
~
{ 196 IThe maximum i c e s t r e s s occurred about 24 hours a f t e r t h e s t a r t of t h e storm. The o r i e n t a t i o n of t h e maximum p r i n c i p a l s t r e s s was e a s t - w e s t , roughly towards t h e i s l a n d . Similar s t r e s s behaviour was observed a t a, depth of 10 cm, but a t depths of 70 and 110 cm, s t r e s s e s were lower ( l e s s than 50 kPa) and d i d n o t change s i g n i f i c a n t l y d u r i n g t h e period of
measurements. From t h e v e r t i c a l d i s t r i b u t i o n of s t r e s s i t i s apparent t h a t t h e m a j o r i t y of t h e s t r e s s i s c a r r i e d by t h e top q u a r t e r of t h e i c e cover.
The long-term readings with t h e transducers deployed c i r c u m f e r e n t i a l l y around t h e i s l a n d d i d n o t y i e l d s t r e s s e s a s high a s previously recorded. There was a s i m i l a r i t y i n t h e t r e n d s of t h e r e s u l t s f o r a l l t h e s e n s o r s . A sensor placed i n t h e same a r e a a s t h e BP s t r a i n m e t e r s y i e l d e d a maximum p r i n c i p a l s t r e s s of 84 kPa and a minimum p r i n c i p a l s t r e s s of -11 kPa on A p r i l 26.
I
DISCUSSION
I
A complete record of wind speed and d i r e c t i o n , a i r temperature, c u r r e n t and t i d e was obtained f o r t h e study area. As a f i r s t s t e p t o determining t h e i n f l u e n c e of t h e s e environmental e f f e c t s on i c e s h e e t movement, wind and c u r r e n t s t r e s s on t h e i c e cover w i l l be examined. Wind s t r e s s ( T ) on an i c e cover i s given by t h e expression'
= P a C l 0u l O 2
(1)where p i s d e n s i t y of t h e a i r , U 1 0 i s wind v e l o c i t y measured a t 10 m e l e v a t i o n above t h e i c e s u r f a c e and C10 i s t h e mean drag c o e f f i c i e n t f o r 10 m wind v e l o c i t y . Banke e t a 1 (1976) have measured v a l u e s of C 1 0 f o r A r c t i c s e a i c e i n t h e range 1.0 t o 2.5, with a mean v a l u e of 1.7. Using t h e mean value of C10 and a wind speed of 50 h / h r (14 m/s) ( a reasonable value f o r t h e storm period shown i n Figure 3 ) , a wind s h e a r s t r e s s of 0.43 N/m2 was obtained. An equation s i m i l a r t o (1) can be w r i t t e n f o r water ( c u r r e n t ) drag. In t h i s case water d e n s i t y i s used, v e l o c i t y 1 m below t h e bottom s u r f a c e of t h e i c e , and t h e corresponding d r a g
c o e f f i c i e n t . An a p p r o p r i a t e value of drag c o e f f i c i e n t would be 3 x 10⁻³ a t a c u r r e n t of 0.35 m/s (Shirasawa and Langleben, 1976). This y i e l d s a c u r r e n t shear s t r e s s of 0.37 N/m2. The magnitudes of both wind and c u r r e n t shear a r e s i m i l a r , b u t q u i t e s m a l l i n both cases. Examining t h e magnitude and d i r e c t i o n of t h e wind and c u r r e n t shear s t r e s s e s and i c e movements, t h e r e i s no apparent c o r r e l a t i o n between t h e s e f a c t o r s on e i t h e r a short-term o r long-term b a s i s . This suggests t h a t o t h e r environmental
f a c t o r s , o r a c o q d e x combination of them, may be r e s p o n s i b l e f o r t h e i c e cover movements.
It i s unfortunate t h a t measurements of i c e movements, s t r a i n s with t h e BP s t r a i n m e t e r s and s t r e s s e s w i t h t h e IRAD Gage t r a n s d u c e r s operated a t t h e same time during only a four-day period. This proved t o be t o o s h o r t a time t o e s t a b l i s h d i r e c t c o r r e l a t i o n s between t h e v a r i o u s measurements, b u t some comparisons can be made. Average s t r a i n r a t e s c a l c u l a t e d from t h e movements of r e f e r e n c e p o i n t s on t h e i c e s u r f a c e were q u i t e s i m i l a r t o
those determined from t h e BP s t r a i n m e t e r s , s-l. This v a l u e i s a l s o s i m i l a r t o average s t r a i n r a t e s of s - I and 5 x 10-lo s - l estimated i n 1982 a t Adam I s l a n d (Frederking e t a l , 1983).
The in-plane s t r e s s e s i n t h e i c e cover a s c a l c u l a t e d from t h e BP
s t r a i n m e t e r were on average below 70 kPa and never exceeded 140 kPa. The maximum s t r e s s measured with t h e i n s i t u s t r e s s transducers was 370 kPa, but averaged over t h e t h i c k n e s s of t h e i c e cover would be 114 t o 113 of t h e maximum, t h a t i s , 90 t o 120 kPa. This is i n t h e same range a s t h a t
p r e d i c t e d from t h e s t r a i n measurements.
It is i n t e r e s t i n g t o c a l c u l a t e t h e magnitude of t h e i n - p l a n e s t r e s s which could be generated i n an i c e cover by wind shear. Previously a maxiuum wind shear of 0.43 ~ / was c a l c u l a t e d f o r t h e storm p e r i o d i n April. m ~ Applying t h i s s h e a r t o a n a r e a of i c e 10 km by 10 km, a t o t a l f o r c e of 43 MN would be developed. I f t h i s f o r c e a c t e d on Adam Island (200 m wide), and t h e i c e cover was 2 m t h i c k , t h e average in-plane s t r e s s would be about 110 kPa, a v a l u e l i t t l e d i f f e r e n t from t h e above measured and c a l c u l a t e d s t r e s s values. Although t h e s e l e c t e d a r e a over which t h e wind shear a c t s is a r b i t r a r y , t h i s c a l c u l a t i o n provides one explanation f o r t h e magnitude of t h e s t r e s s e s measured.
CONCLUSIONS
The maximum average in-plane s t r e s s i n t h e land-f a s t i c e cover a d j a c e n t t o Adam Island i n l a t e April and e a r l y May, 1983, was about 100 kPa, from both d i r e c t measurements and determinations from measured s t r a i n r a t e s . The i c e cover was moving a t r a t e s between 1 and 5 cmlday during t h i s period. The maxiuum s t r e s s was a s s o c i a t e d w i t h a storm b u t t h e i n c r e a s e and decrease i n s t r e s s lagged behind t h e wind by about 24 hours. Rate of
h o r i z o n t a l movement of t h e i c e cover decreased from about 10ecm p e r day i n
March t o about 2 cm per day i n June. The i s l a n d e x e r t s a l o c a l e f f e c t on
t h e movements and deformations of t h e i c e cover. S t r a i n r a t e s measured
over gauge l e n g t h s from 0.3 t o 500 m were s i m i l a r . Total s t r a i n change i n
t h e i c e cover over t h e t h r e e m o n t h p e r i o d was no more than 0.5%. It i s n o t
y e t p o s s i b l e t o e s t a b l i s h t h e r e l a t i o n between t h e environmental d r i v i n g f o r c e s and t h e movement of t h e i c e cover.
ACKNOWLEDGEMENTS
The l o g i s t i c support provided by t h e P o l a r Continental Shelf P r o j e c t i s
g r e a t l y appreciated, a s i s t h e use of t h e f a c i l i t i e s a t Bdrden S t a t i o n ,
owned by t h e Canadian Department of F i s h e r i e s and Oceans. Also t h e
f i n a n c i a l support of Supply and Services Canada and t h e Panel of Fnergy
Research and Development i s g r a t e f u l l y acknowledged. Technical support i n
t h e f i e l d was provided by t h e A r c t i c Research Establishment, Pond I n l e t . Thanks a r e extended t o E. Lewis a t t h e Bayfield Lab. of t h e Department of
F i s h e r i e s and Oceans f o r a n a l y s i s of t h e c u r r e n t data. Assistance i n
p r e p a r a t i o n s and i n t h e f i e l d provided by P. Jochmann and W. Neper of HSVA,
J.D. Neil, Technical O f f i c e r , NRCC, and M. Inoue, V i s i t i n g Researcher, NKK,
i s g r a t e f u l l y acknowledged. F i n a n c i a l support of t h e German Ministry of
Research and Technology made p o s s i b l e p a r t i c i p a t i o n of HSVA i n t h e p r o j e c t .
REFERENCES
Banke, E.G., Smith, S.D. and Anderson, E.J.. 1976. Recent measurements of
wind s t r e s s on A r c t i c s e a i c e . J . Fish. Res. Board Can., 33.
p. 2307-2317.
Cox, G.F.N. and Johnson, J.B., 1983. S t r e s s measurements i n i c e .
U.S. Army CRREL Report 83-23, Hanover, N.H.
Danielewiw, B.W., Metge, M. and Dunwoody, A.B.. 1983. Cn e s t i m a t i n g l a r g e
s c a l e i c e f o r c e s from d e c e l e r a t i o n of i c e f l o e s . VTT Symposium 38, 7th
I n t e r n a t i o n l Conference on P o r t and Ocean Engineering under A r c t i c Conditions, Helsinki, Finland, 5-9 A p r i l , 1983, Vol. 4, pp. 537-546.
Frederking, R., Sanderson, T., Wessels, E. and Inoue, M.. 1983. I c e
behaviour around a small A r c t i c i s l a n d . VTT Symposium 28, 7th
I n t e r n a t i o n a l Conference on P o r t and Ocean Engineering under A r c t i c Conditions. Helsinki, Finland, 5-9 A p r i l , 1983, Vol. 2, pp. 875-887.
-
Kovacs, A. and Sodhi, D., 1981. Sea i c e p i l i n g a t Fairway Rock, Bering S t r a i t , Alaska: Observations and t h e o r e t i c a l a n a l y s i s . 6 t h I n t . Conf. on P o r t and Ocean E n g i n e e r i n g under A r c t i c C o n d i t i o n s (POAC), QuSbec, 1981, Vol. 11. pp. 985-1000.
Moore, S.C. and Wadhams, P., 1981. Recent developments i n s t r a i n m e t e r design. P r e s e n t a t i o n by S c o t t P o l a r Research I n s t i t u t e t o Workshop on Sea I c e F i e l d Measurements, S t . J o h n ' s , Newfoundland, A p r i l 29
-
May 1, .1980.
Sanderson, T.J.O., 1984. T h e o r e t i c a l and measured i c e f o r c e s on wide s t r u c t u r e s . Paper t o be p r e s e n t e d a t IAHR I c e Symposium. Hamburg, August 1984.
Shirasawa, K. and Langleben, M.P.. 1976. Water d r a g on A r c t i c s e a i c e .
J. Geophys. Res., 81, p. 6451-6454.
TABLE
1: Area changes, r o t a t i o n s and a v e r a g e v e l o c i t i e s of t r i a n g u l a re l e m e n t s f o r i n t e r v a l (1) March 26 t o A p r i l 27 and ( 2 ) May 7 t o June 10, 1983
Area change Rotation* Average r a t e Bearing** Element ( M I A ) % d e g r e e s mmlday d e g r e e s (1) (2) (1) (2) (1) (2) (1) (2) S l S 2 S 3 .02 .21 -.0002 +.I48 8 2 15 25 32 11-S1-S3 -.08 .07 -.072 +.034 83 14 25 30 BS1-BS2-BS3 .10 -.28 +.004 -.010 7 3 24 36 34 17-07-08 .OO -.02 -.039 -.027 87 18 22 60 18-07-08 -.07 -.07 -.037 -.021 8 5 19 22 61 11-01-08 -.20 -.05 -.029 +.045 89 16 23 41 11-01-02 -.33 -03 +.046 -.020 72 19 28 29 12-01-02 -.23 .03 +.073 +.003 70 21 27 25 13-02-03 -20 -.03 +.060 -.012 8 5 26 31 20 14-03-04 .01 .17 -.008 +.065 110 31 30 1 8 14-04-05 .06 .28 -.014 -.033 106 30 31 16 15-04-05 .08 .15 -.016 +.064 106 25 30 32 1 16-05-06 .06 .44 -.067 -.003 103 20 30 27 17-05-06 .10 .24 -.032 +.040 92 18 29 46 17-06-07 -.01 -.04 -.033 -.026 86 18 25 65
*+
c o u n t e r c l o c k w i s e ,-
clockwise **clockwise from t r u e n o r t h200
TABLE 2: Average strain-rate i n l e v e l i c e
Strainmeter' (-160.851, -194.010)
co-ordinates
Orientation from North
Arm A Arm B Arm C Arm A Arm B A r m C
31" 150" 91" 31' 151' 91°
Date Strain rates
( 6 -
Strain r a t e s
T h i s p a p e r , w h i l e b e i n g d i s t r i b u t e d i n r e p r i n t form by t h e D i v i s i o n of B u i l d i n g R e s e a r c h , r e m a i n s t h e c o p y r i g h t of t h e o r i g i n a l p u b l i s h e r . I t s h o u l d n o t be r e p r o d u c e d i n whole o r i n p a r t w i t h o u t t h e p e r m i s s i o n of t h e p u b l i s h e r . A l i s t of a l l p u b l i c a t i o n s a v a i l a b l e f r o m t h e D i v i s i o n may be o b t a i n e d by w r i t i n g t o t h e P u b l i c a t i o n s S e c t i o n . D i v i s i o n of B u i l d i n g R e s e a r c h , N a t i o n a l R e s e a r c h C o u n c i l o f C a n a d a . O t t a w a . O n t a r i o . K1A 0R6. Ce document e s t d i s t r i b u d s o u s forrne d e t i r e - % p a r t p a r l a D i v i s i o n d e s r e c h e r c h e s e n b l t i m e n t . Les d r o i t s d e r e p r o d u c t i o n s o n t t o u t e f o i s l a p r o p r i e t e d e l ' d d i t e u r o r i g i n a l . Ce d o c u m e n t n e p e u t d t r e r e p r o d u i t en t o t a l i t d ou en p a r t i e s a n s l e c o n s e n t e m e n t d e l l € d i t e u r . Une l i s t e d e s p u b l i c a t i o n s d e l a D i v i s i o n p e u t S t r e o b t e n u e en 6 c r i v a n t