HAL Id: hal-00296353
https://hal.archives-ouvertes.fr/hal-00296353
Submitted on 10 Oct 2007
HAL is a multi-disciplinary open access
archive for the deposit and dissemination of
sci-entific research documents, whether they are
pub-lished or not. The documents may come from
teaching and research institutions in France or
abroad, or from public or private research centers.
L’archive ouverte pluridisciplinaire HAL, est
destinée au dépôt et à la diffusion de documents
scientifiques de niveau recherche, publiés ou non,
émanant des établissements d’enseignement et de
recherche français ou étrangers, des laboratoires
publics ou privés.
Observed poleward expansion of the Hadley circulation
since 1979
Y. Hu, Qinjun Fu
To cite this version:
Y. Hu, Qinjun Fu. Observed poleward expansion of the Hadley circulation since 1979. Atmospheric
Chemistry and Physics, European Geosciences Union, 2007, 7 (19), pp.5229-5236. �hal-00296353�
www.atmos-chem-phys.net/7/5229/2007/ © Author(s) 2007. This work is licensed under a Creative Commons License.
Chemistry
and Physics
Observed poleward expansion of the Hadley circulation since 1979
Y. Hu1and Q. Fu21Dept. of Atmospheric Sciences, Peking University, Beijing, China 2Dept. of Atmospheric Sciences, University of Washington, Seattle, USA
Received: 12 June 2007 – Published in Atmos. Chem. Phys. Discuss.: 2 July 2007 Revised: 3 September 2007 – Accepted: 2 October 2007 – Published: 10 October 2007
Abstract. Using three meteorological reanalyses and three
outgoing long-wave radiation (OLR) datasets, we show that the Hadley circulation has a significant expansion of about 2 to 4.5 degrees of latitude since 1979. The three reanalyses all indicate that the poleward expansion of the Hadley circu-lation in each hemisphere occurs during its summer and fall seasons. Results from the OLR datasets do not have such seasonality. The expansion of the Hadley circulation implies a poleward expansion of the band of subtropical subsidence, leading to enhanced mid-latitude tropospheric warming and poleward shifts of the subtropical dry zone. This would con-tribute to an increased frequency of midlatitude droughts in both hemispheres.
1 Introduction
The Hadley circulation is a thermally driven meridional cir-culation. Warmer tropical air rises due to the release of la-tent heat and flows poleward in both hemispheres. Air then cools in the subtropics, sinks and flows back to the tropics, generating an enclosed circulation in each hemisphere. The Hadley circulation is fundamentally important to the climate system and its changes have important impacts on global climate (Diaz and Bradley, 2004). Recent studies are con-cerned with multi-decadal changes of the Hadley circulation with respect to its intensity. Using outgoing longwave radia-tion (OLR) datasets from the Earth Radiaradia-tion Budget Exper-iment (ERBE), Chen et al. (2002) and Wielicki et al. (2002) suggested that the Hadley circulation was intensified in the 1990s. Using reanalysis datasets, Quan et al. (2002), Hu et al. (2005) and Mitas and Clement (2005) showed that the winter cell of the Hadley circulation has large intensification in the past few decades. However, whether the intensifica-tion of the Hadley cell as suggested by some of these studies
Correspondence to: Y. Hu
is real remains controversial (Trenberth, 2002; Held and So-den, 2006).
On the other hand, results from several recent studies sug-gest that the Hadley circulation has poleward expansion since 1979. Based on satellite-borne microwave sounding unit (MSU) data, Fu et al. (2006) showed an enhanced warm-ing in the mid-latitude troposphere. Such a change in tro-pospheric temperature fields indicates a poleward shift in the maximum horizontal temperature gradient and thus implies a poleward shift of subtropical jet streams. Since the loca-tion of the subtropical jet stream marks the poleward edge of the Hadley circulation, Fu et al. (2006) suggest a broadening of the tropics. In studying Northern-Hemisphere midlatitude total ozone trends, Hudson et al. (2006) found that the sub-tropical upper tropospheric front shifted poleward by about 2.75 degree latitudes over 1979–2003, which also implies a poleward shift of the tropospheric subtropical jet stream. Through an analysis of tropopause heights in the subtropics using radiosonde measurements and reanalysis data, Seidel and Randel (2007)1found an expansion of the tropical belt for about 4.25 degree latitudes during 1979–2005.
In this study, we use three meteorological reanalysis datasets to show the direct evidence that the Hadley circu-lation indeed has a poleward expansion in both hemispheres in the recent few decades. We also examine the Hadley cell expansion by analyzing three OLR datasets. We compare the results from reanalyses with those from OLR and MSU datasets to examine the consistency among results based on different observational quantities. Data and methods used in this study are described in Sect. 2. Results from reanaly-sis datasets are in Sect. 3. Results based on OLR and MSU datasets are presented in Sect. 4. Discussion and conclusions are in Sect. 5.
1Seidel, D. J. and Randel, W. J.: Recent widening of the tropical
belt: Evidence from tropopause observations, J. Geophys. Res., submitted, 2007.
5230 Y. Hu and Q. Fu: The Hadley circulation
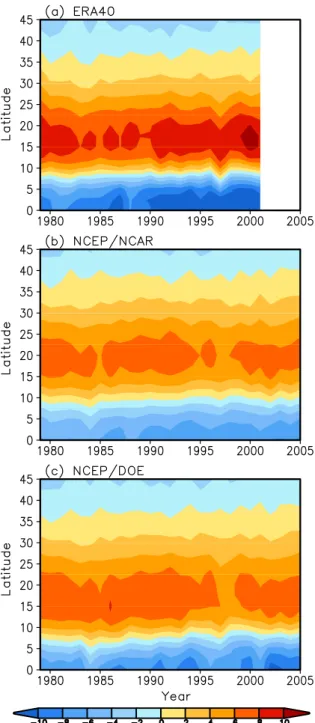
Fig. 1. Time evolution of zonal mean meridional mass
streamfunc-tion (MMS) at 500 hPa in NH for September-November (SON) from three reanalyses. The unit of MMS is 1.0×10¹⁰kg s−1and
the color interval is 2.0×10¹⁰kg s−1.
2 Data and methods
The three reanalysis datasets used in this study are from the European Centre for Medium-Range Weather Forecasts (Up-pala et al., 2005), the National Center for Environmental Pre-diction/National Center for Atmospheric Research (Kalnay et al., 1996) and the National Center for Environmental
Prediction/Department of Energy (Kanamitsu et al., 2002). For simplicity, they are denoted by ERA40, NCEP/NCAR, and NCEP/DOE, respectively. The ERA40 reanalysis used here is from January 1979 to August 2002 (24 years), and NCEP/NCAR and NCEP/DOE reanalyses are from Jan-uary 1979 to December 2005 (27 years). In the analyses of these three datasets, we use the mean meridional mass stream-function (MMS) to characterize the Hadley circula-tion. MMS is obtained by vertically integrating monthly meridional winds in the conventional way (Holton, 1994). Clockwise circulation (the northern cell) is defined as posi-tive, and anti-clockwise circulation (the southern cell) is de-fined as negative. The locations of poleward edges of the Hadley circulation are identified as the latitudes where MMS equals 0 kg s−1, which are obtained using linear interpola-tion. Poleward expansion since 1979 is estimated by calcu-lating linear trends of the edge latitudes. The total expansion of the Hadley circulation is then obtained from the summa-tion of the trends in these edge latitudes in Northern Hemi-sphere (NH) and Southern HemiHemi-sphere (SH).
The three OLR records used here are the High-Resolution Infrared Radiation Sounder (HIRS) Pathfinder dataset (Mehta and Susskind, 1999), the International Satel-lite Cloud Climatology Project (ISCCP) version FD dataset (Zhang et al., 2004), and the Global Energy and Water Cy-cle Experiment (GEWEX) Radiative Flux Assessment (RFA) dataset (Stackhouse, 2004). The periods are from Decem-ber 1979 to August 2003 for HIRS (24 years) and from De-cember 1983 to November 2004 for the ISCCP and GEWEX datasets (21 years). Although the most reliable long-term OLR record is from the active cavity broadband non-scanner wide field of view instruments on the Earth Radiation Bud-get Satellite (ERBS) (Wong et al., 2006), we did not use this dataset because of its low horizontal resolution. However, it is shown that the observed decadal changes in the HIRS Pathfinder OLR and the ISCCP FD record are similar to the OLR changes from ERBS (Wong et al., 2006). The subsi-dence regions associated with the Hadley circulation, due to their dry troposphere and lack of high clouds, can be identi-fied as the region with high OLR. For the OLR records the locations of the poleward edges of the Hadley circulation are defined as the most poleward latitudes where the zonal-mean OLR equals 250 W m−2. In this study all variables are ana-lyzed in terms of zonally averaged values.
3 Poleward expansion in reanalyses
Figure 1 shows the MMS latitude-time plots on the 500 hPa pressure surface for September-November (SON) season (autumn) from the three reanalyses. The band with colors from yellow to dark red indicates the time evolution of the northern branch of the Hadley circulation and the blue band over the tropics is part of the southern branch. In all three plots, the northern edge of the tan band exhibits a systematic
Fig. 2. Same as Fig. 1, except for the SH autumn (March–May).
poleward trend from 1979 onward. For ERA40, the linear trend in the location of the northern edge is about 2.1◦ lati-tude from 1979 to 2002, with a statistical significance above the 95% confidence level (student t-test value is 2.32). For NCEP/NCAR and NCEP/DOE, the poleward extensions are 1.9◦ and 2.5◦ of latitude from 1979 to 2005, respectively, with a statistical significance above the 98% confidence level (student t-test values are about 2.52). From Fig. 1, we can find that the poleward extension of the northern Hadley
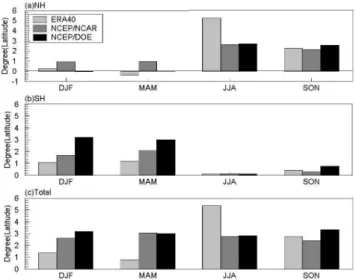
cir-Fig. 3. Poleward shifts of poleward edges of the Hadley
circula-tion from three reanalyses, averaged from 400 to 600 hPa. (a) The northern branch, (b) the southern branch, and (c) total poleward expansion. Positive trends indicate poleward shifts of the Hadley circulation and negative values indicate equator-ward shifts. The ERA40 is for 1979–2002 while the NCEP/NCAR and NCEP/DOE are for 1979–2005. For each branch, statistical significance of the trends in the hemisphere summer and autumn is above the 95% con-fidence level, whereas the relatively weak trends in the hemisphere winter and spring have significant levels below the 90% confidence level.
culation branch appears to be a systematic robust feature of the analyses, but not to be caused due to the Southern Oscil-lation/El Nino events. In addition, the significant poleward expansion is not limited over the period since 1979. It is also found in ERA40 and NCEP/NCAR reanalyses since the 1950s. Because reanalyses before 1979 are less reliable due to not including satellite observations, trend analyses before 1979 are not shown. Moreover, to compare with the results derived from OLR datasets, we focus on the period for 1979– 2005.
A poleward extension is also found for the southern Hadley-circulation branch. Figure 2 shows the latitude-time plot of the Southern Hemisphere (SH) MMS at 500 hPa for March-May (MAM) season (autumn) from the same three reanalyses. The band with colors from shallow to dark blue indicates the time evolution of the southern branch of the Hadley circulation. Similar to that of the northern branch, the poleward edges of the southern branch in all the three datasets demonstrate systematic southward expansions. The largest southward expansion is found in NCEP/DOE, with magnitude close to 3.0 degree latitudes over the 27 years. All the trends are statistically significant.
Trends in edge latitudes, averaged from 400 to 600 hPa, for four seasons and for both branches are summarized in Fig. 3. For the northern branch (Fig. 3a), the poleward extension in all three reanalyses mainly occurs in the boreal summer and
5232 Y. Hu and Q. Fu: The Hadley circulation
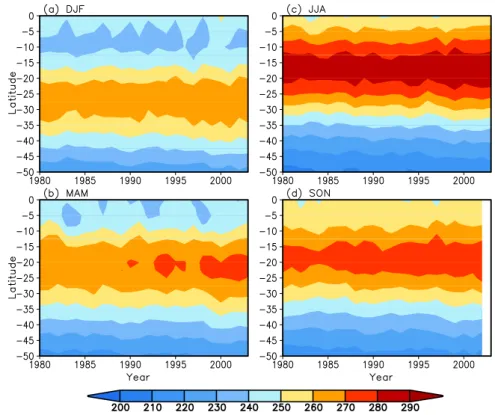
Fig. 4. Time evolution of zonal-mean seasonal HIRS OLR in the Northern Hemisphere. The OLR unit is W m−2, and color interval is
10 W m−2. The 250 W m−2OLR contour is the line between pale blue and yellow colors. (a) DJF, (b) MAM, (c) JJA, and (d) SON.
autumn. In contrast, trends in the boreal winter and spring are either very small or slightly negative (equatorward shrinking of the northern branch). The extension in the summer and au-tumn seasons is about 2.5◦in these reanalyses except in the ERA40 where it goes up to 5◦in JJA. Similarly, the poleward extension of the southern branch mainly occurs in the austral summer and autumn (Fig. 3b). The poleward shifts of the poleward edges in these seasons since 1979 are about 1.0◦, 2.0◦, and 3.0◦, respectively, in the ERA40, NCEP/NCAR, and NCEP/DOE reanalyses, which are generally smaller than those for the northern branch. Note that in both hemispheres student t-test values for the summer and autumn trends in Figs. 3a and b are all larger than 2.0 (above the 95% con-fidence level), whereas the relatively weak trends in winter and spring in both hemispheres are statistically insignificant. Figure 3c shows the total expansion of the Hadley circula-tion in three reanalyses for four seasons. The total expansion is the summation of trends in Figs. 3a and b. The seasonal expansions from NCEP/NCAR and NCEP/DOE in last 27 years are about 2.7◦ and 3.1◦, respectively, with little sea-sonal dependence. However, the expansion in ERA40 ranges from about 1◦ in March-May (MAM) to about 5◦ in June– August (JJA). Such a large seasonal variation in the total ex-pansion, which is inconsistent with the other two reanalyses and the OLR results (as will be discussed below), could be largely due to the problems in ERA40 (Trenberth and Smith,
2006). But the annual-mean expansion of the Hadley circu-lation from ERA40 is 2.6◦(that can be roughly converted to 2.9◦by linearly extrapolating to last 27 years), which agrees well with those from NCEP/NCAR and NCEP/DOE. The agreement among three reanalysis results is very encourag-ing, particularly in view of the significant differences in the climatological states of the Hadley circulation in these re-analyses (Mitas and Clement, 2005): the intensity of the Hadley circulation from ERA40 is much stronger than that in NCEP/NCAR and NCEP/DOE, while the maximum MMS in NCEP/DOE (at about 800 hPa) is centered much lower than those in ERA40 and NCEP/NCAR (at about 450 hPa). It is obvious that in all three reanalyses the Hadley circulation has become wider in almost all seasons during the past 24–27 years.
4 Poleward expansion in OLR
The subsidence regions of the Hadley circulation, because of the dryness of the troposphere and lack of high clouds, can be identified as the region with high OLR. For the OLR records the locations of the poleward edges of the Hadley circulation are roughly defined as the most poleward latitude at which the zonal mean OLR is equal to 250 W m−2. Figure 4 shows the zonally averaged temporal evolution of the OLR from the
Fig. 5. Same as Fig. 4, except for the Southern Hemisphere.
HIRS Pathfinder for four seasons in NH. The poleward ex-tension of the northern Hadley-circulation branch based on the 250 W m−2OLR is about 2.14◦, 2.75◦, 2.56◦and 2.67◦ in latitude for the four seasons, respectively, as shown in Fig. 6a. One can alternatively use other OLR contours to measure the poleward expansion. But results do not change very much. For example, the poleward expansion of contour 240 W m−2is about 2.05◦, 3.11◦, 3.07◦and 3.04◦in latitude for the four seasons. The consistent poleward expansion of different OLR contours can be clearly seen in Fig. 4.
Significant poleward extension in the Southern Hemi-sphere can also be found in HIRS OLR datasets. Time evolu-tion of zonal-mean HIRS OLR in the Southern Hemisphere is illustrated in Fig. 5. Similar to the Northern Hemisphere, the 250 W m−2 OLR contour shows poleward (southward) expansion in all the four seasons, with a magnitude of about 2.0◦ latitudes. In contrast to the reanalysis results, these trends in OLR-contour latitudes in both hemispheres exhibit similar magnitudes for all seasons. At the current stage, it is not clear to us why there is a difference in the seasonal dependence between the reanalyses and OLR datasets. Our research is currently under way to investigate such a differ-ence.
The OLR temporal evolutions in ISCCP FD and GEWEX RFA are similar to those in Figs. 4 and 5 (not shown). Figures 6a and b summarize the trends in latitudes of the 250 W m−2 OLR contour from the three OLR datasets for both
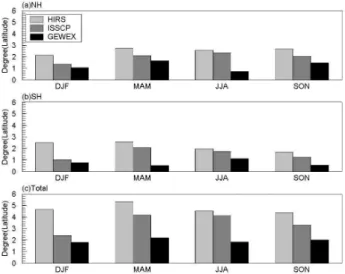
hemi-spheres. Trends from the HIRS OLR are largest, while trends from GEWEX OLR are smallest (generally less than 1.0◦ lat-itude). Again, the trends have no significant seasonality.
Figure 6c shows that the total expansion of the Hadley circulation, indicated by the HIRS Pathfinder OLR, is about 4.5◦latitude for 1980–2003. The total expansions in ISSCP and GEWEX OLR datasets are about 3.5◦and 2.0◦for 1984– 2004, which can be roughly linearly extrapolated to 4.0◦and 2.3◦ for 1980–2003, respectively. The trends from ISSCP and GEWEX also exhibit little seasonal variations in magni-tudes. For ISCCP, the range of the total expansion is from about 2.0◦ in December–February (DJF) to about 4.0◦ in MAM, which is still much less than the seasonal dependence in ERA40. Regardless of the details, our analyses based on different observational datasets (three reanalyses and three OLR datasets) in terms of different physical quantities (MMS versus OLR) all indicate an expansion of the Hadley circu-lation during the last 24–27 years, ranging from about 2.0 to 4.5 degrees of latitude.
The poleward expansion of the Hadley circulation can be also measured by the poleward shift of the jet streams be-cause the subtropical jet streams mark the poleward limit of the tropical Hadley circulation. We derived the poleward shifts of subtropical jet streams for different seasons using the MSU-inferred tropospheric temperature trends for 1979– 2005 (Mears et al., 2003; Fu et al., 2004; Johanson and Fu, 2006) using the geostrophic relation. It is found that the
5234 Y. Hu and Q. Fu: The Hadley circulation
Fig. 6. Poleward expansion of the 250 W m−2contour from three
OLR datasets. (a) NH, (b) SH, and (c) total poleward expansion. Results from three OLR datasets are for 1980–2003 in HIRS and for 1984–2004 in the ISCCP and GEWEX datasets. Student t-test values for the trends in HIRS and ISSCP OLR are larger than 2.9 and 1.8, respectively. For GEWEX OLR, t-test values for the NH trends are larger than 2.5, except the trend in JJA which has a t-test value less than 1.0. The SH trends in DJF and JJA have t-test values larger than 1.75, while t-test values for the trends in MAM and SON are less than 1.0.
northern subtropical jet stream exhibited a northward shift in most seasons with the largest shift occurring during the bo-real summer. The southern subtropical jet stream has exhib-ited the largest shift in the austral summer. That the largest poleward shifts of subtropical jet streams occur in summer in both hemispheres is consistent with the reanalysis results. The total expansions of the Hadley circulation based on MSU observations are 2.4◦and 2.2◦in DJF and JJA, respectively, which are within the ranges of those derived from the reanal-yses and OLR datasets.
5 Discussion and conclusions
Using three reanalysis, three OLR and one MSU datasets, we have shown evidence that the Hadley circulation has pole-ward expansion since 1979. The magnitudes of total expan-sion range from 2 to 4.5 degree latitudes. The magnitudes estimated here are consistent with those derived from other observational quantities including total ozone (Hudson et al., 2006) and tropopause heights (Seidel and Randel, 20071). In a Lagrangian analysis Fueglistaler and Haynes (2005) found a broadening of the latitudinal density distribution of the Lagrangian cold point, which might be an indication of a broadening of the tropical upwelling. The analyses of multi-datasets enhance our confidence on our conclusion about the observed expansion of the Hadley cell since 1979.
One important question remains related to above results: what causes the expansion of the Hadley circulation? At the current stage of our knowledge, there are no clear answers to this question. Here, we present some qualitative discussion following the theoretical arguments by Held and Hou (1980) and Held (2000) on the factors which possibly influence the width of the Hadley circulation. Under assumptions of angu-lar momentum conservation and thermal wind balance, the width of the Hadley circulation is determined by the tropical tropopause height, pole-equator temperature difference and the global mean radiative equilibrium temperature. For the case of greenhouse-induced global warming, the global mean temperature becomes larger, which would lead to a narrower Hadley circulation according to the theoretical argument by Held and Hou (1980). However, increasing greenhouse gases will also cause tropical sea surface temperature warming, which would lead to a higher tropical tropopause height and thus a broader Hadley circulation. Santer et al. (2003) have found from reanalyses that the tropical tropopause height in-creased by several hundred meters between 1979 and 1999. Their GCM simulations showed that human-induced strato-spheric ozone depletion and increasing greenhouse gases ac-count for 80% of the simulated rise in tropopause height. Global warming is also accompanied with changes in merid-ional temperature gradients. From Fu et al. (2006), the pole-equator temperature difference in the NH troposphere gen-erally decreases. Based on Held and Hou’s argument, the weakening in the pole-equator temperature difference would lead to a narrower Hadley circulation. However, the argu-ment in Held and Hou (1980) was based on the eddy-free assumption. In the presence of extratropical eddies, angular momentum conservation will break down at the edges of the Hadley circulation, as pointed out by Held (2000). Thus, the activity of extratropical waves has important influences on the width of the Hadley circulation. Consider that changes in meridional temperature gradients must cause changes in baroclinic wave activity. A smaller temperature difference would cause weaker baroclinic wave activity, which allows angular momentum conservation extending further poleward (Held, 2000). Thus, the Hadley circulation becomes broader. For SH, the results by Fu et al. (2006) show a stronger warm-ing in the north of 30◦S and weaker warming at higher lat-itudes. Though temperature gradients in the southern extra-tropics become larger, temperature gradients in the southern subtropics are reduced. It indicates a weakening of baro-clinic instability in the southern subtropics, also suggesting a broader Hadley circulation in SH. Note that the above is some qualitative discussion. The relationships between the broadening of the Hadley circulation and these factors need to be quantified.
To examine whether increasing greenhouse gases can cause a broadening of the Hadley circulation, Lu et al. (2007) analyzed results from GCM simulations with 21st century greenhouse gas scenarios in the Fourth Assessment Report (AR4) of the Intergovernmental Panel on Climate Change
(IPCC). They found a robust widening of the Hadley circula-tion. But the simulated expansion (∼0.6◦latitude per degree global warming, e.g., from the AR4 A2 scenario simulations) is about an order of magnitude smaller than those based on observations (∼6◦latitude/K by considering an about 3◦ lat-itude expansion corresponding to the 0.5 K global warming for 1979–2005). Lu et al. 2007) showed that the widening of the Hadley circulation in the AR4 simulations has little cor-relations with variations in the tropical tropopause height, but has statistically significant positive correlation with a weak-ening of baroclinic instability in the extratropics. Therefore, they argued that the poleward expansion of the Hadley circu-lation in the AR4 simucircu-lations is caused by the weakening of baroclinic wave activity in the extratropics due to increasing greenhouse gases.
The observed expansion since 1979 might be due to in-creasing greenhouse gases as well as the ozone depletion (Polvani and Kushner (2002) showed that stratospheric polar cooling leads to a poleward shift of subtropical tropospheric jet streams). If so, the observed large expansion would pro-vide a unique test-bed for examining our understanding of such expansion and GCMs’ ability to simulate it. Such a test could be fundamentally important because of the critical role of the Hadley circulation in transporting energy poleward. The reconciliation between model simulations and observa-tions on the Hadley circulation expansion may help improve our understanding of the small equator-to-pole surface tem-perature gradients during the Eocene (Crowley and Zachos, 2000), if the increased atmospheric heat transport is the dom-inant process for maintaining such weak temperature gradi-ents.
The poleward expansion of the Hadley circulation may also be affected by regional factors (Menon et al., 2002, Ra-manathan et al., 2005). For example, Fu et al. (2006) showed that the enhanced midlatitude summer tropospheric warming was much larger over northern China than the warming at other longitudes (see their Fig. S4). Results of GCM simula-tions suggest that the increase in black-carbon concentration in southern China might cause changes in the local merid-ional circulations, with enhanced rising motions in the south and subsidence in the north of China (Menon et al., 2002). It was suggested that such changes in the local circulation due to anthropogenic aerosols caused floods in the south and droughts in the north of China. These changes in regional atmospheric circulations may also contribute to the poleward extension of the zonally averaged Hadley circulation.
The belt of subtropical subsidence motions extends toward higher latitudes as the Hadley circulation expands poleward regardless of the cause. Because subsidence causes adiabatic heating and suppresses convection, this poleward extension would lead to midlatitude tropospheric warming and a pole-ward extension of subtropical dry zones. This would con-tribute to an increased frequency of droughts in both hemi-spheres (Hoerling et al., 2001, Lau et al., 2005). Using precipitation data from the Global Historical Climatology
Network, Zhang et al. (2007) recently found a decrease in subtropical precipitation in NH between 1925 and 1999. It is possible that such a decrease in subtropical precipitation is related to the poleward expansion of the subtropical dry zone. Zhang et al. (2007) also pointed out that the simu-lated decrease in subtropical precipitation by GCMs is much weaker than observations. The disagreement between simu-lated and observed precipitation (Zhang et al., 2007) and the discrepancy of the expansion rate of the Hadley circulation between simulations (Lu et al., 2006) and reanalyses suggest that current GCMs may not have the capability to well simu-late changes in the Hadley circulation.
The poleward expansion of the Hadley circulation may also have important impacts on stratospheric climate. This is because the tropics is the key region for troposphere-stratosphere exchange (e.g., Rosenlof, 2002; Fueglistaler and Haynes 2005). Moreover, Hudson et al. (2006) showed that about 35% of the observed total ozone trend in the Northern Hemisphere since 1979 is due to northward movements of subtropical and polar fronts in the upper troposphere. The change in the key stratospheric composition would lead to stratospheric climate changes.
Acknowledgements. We thank J. M. Wallace, K. E. Trenberth,
I. Held, G. Lau, and J. Edwards for valuable comments and suggestions on the manuscript. We thank P. Stackhouse for his information on the GEWEX RFA dataset. Part of research was done during Q. Fu’s sabbatical visit at the Geophysical Fluid Dynamics Laboratory (GFDL)/NOAA, Princeton University. Y. Hu is supported by the NSF of China under grants 40575031 and 40533016, the Ministry of Education of China under grants 106002, and the National Basic Research Program of China (973 Program, 2007CB411801). Q. Fu is supported by the NASA grants NNG04GM23G and NNG05GA19G and NOAA grant NA17RJ1232.
Edited by: P. Haynes
References
Chen, J. Y., Carlson, B. E., and Del Genio, A. D.: Evidence for strengthening of the tropical general circulation in the 1990s, Sci-ence, 295, 838–841, 2002.
Crowley, T. J. and Zachos, J. C.: Warm Climate in Earth History, edited by: Huber, B. T., Macleod, K. G., and Wing, S. L, Cam-bridge Univ. Press, CamCam-bridge, 2000.
Diaz, H. F. and Bradley, B.: The Hadley Circulation: Present, Past and Future. Kluwer Academic Publishers, The Netherlands, 2004.
Fu, Q., Johanson, C. M., Wallace, J. M., and Reichler, T.: En-hanced mid-latitude tropospheric warming in satellite measure-ments, Science, 312, 1179, 2006.
Fu, Q., Johanson, C. M., Warren, S. G., and Seidel, D. J.: Contri-bution of stratospheric cooling to satellite-inferred tropospheric temperature trends, Nature, 429, 55–58, 2004.
5236 Y. Hu and Q. Fu: The Hadley circulation
Fueglistaler, S. and Haynes, P. H.: Control of interannual and longer-term variability of stratospheric water vapor, J. Geophys. Res., 110, D24108, doi:10.1029/2005JD006019, 2005.
Held, I. M. and Hou, A. Y.: Nonlinear axially symmetric circula-tions in a nearly inviscid atmosphere, J. Atmos. Sci., 37, 515– 533, 1980.
Held, I. M.: The general circulation of the atmosphere. Proc.
Pro-gram in Geophysical Fluid Dynamics. Woods Hole
Oceano-graphic Institution, Wood Hole, MA. http://gfd.whoi.edu/ proceedings/2000/PDFvol2000.html, 2000.
Held, I. M. and Soden, B. J.: Robust response of the hydrological cycle to global warming, J. Clim., 19, 5686–5699, 2006. Hoerling, M. P., Whitaker, J. S., Kumar, A., and Wang, W.: The
midlatitude warming during 1998–2000, Geophys. Res. Lett., 28, 755–758, 2001.
Holton, J. R.: An Introduction to Dynamic Meteorology. Academic Press, New York, 1994.
Hu, Y., Tung, K.-K., and Liu, J.: A closer comparison of early and late winter atmospheric trends in the Northern-Hemisphere, J. Clim., 18, 2924–2936, 2005.
Hudson, R. D., Andrade, M. F., Follette, M. B., and Frolov, A. D.: The total ozone field separated into meteorological regimes, Part II: Northern Hemisphere mid-latitude total ozone trends, Atmos. Chem. Phys., 6, 5183–5191, 2006,
http://www.atmos-chem-phys.net/6/5183/2006/.
Johanson, C. M. and Fu, Q.: Robustness of Tropospheric Temper-ature Trends from MSU Channels 2 and 4, J. Clim., 19, 4234– 4242, 2006.
Kalnay, E., Kanamitsua, M., Kistlera, R., et al.: The NCEP/NCAR 40-year reanalysis project, Bull. Am. Meteorol. Soc., 77, 437– 471, 1996.
Kanamitsu,M., Ebisuzaki, W., Woollen, J., et al.: NCEP-DOE AMIP-II reanalysis (R-2), Bull. Am. Meteorol. Soc., 83, 1631– 1643, 2002.
Lau, N. C., Leetmaa, A., Nath, M. J., and Wang, H. L.: Influences of ENSO-Induced Indo–Western Pacific SST Anomalies on Ex-tratropical Atmospheric Variability during the Boreal Summer, J. Clim., 18, 2922–2942, 2005.
Lu, J., Vecchi, G. A., and Reichler, T.: Expansion of the Hadley cell under global warming, Geophys. Res. Lett., 34, L06805, doi:10.1029/2006GL028443, 2007.
Mears, C. A., Schabel, M. C., and Wentz, F. J.: A reanalysis of the MSU channel 2 tropospheric temperature record, J. Clim., 16, 3650–3664, 2003.
Mehta, A., Susskind, J.: Outgoing longwave radiation from the TOVS Pathfinder Path A data set, J. Geophys. Res., 104(D10), 12 193–12 212, 1999.
Menon, S., Hansen, J., Nazarenko, L., and Luo, Y.: Climate effects of black carbon aerosols in China and India, Science, 297, 2250– 2253, 2002.
Mitas, C. M. and Clement, A.: Has the Hadley cell been strength-ening in recent decades?, Geophys. Res. Lett., 32, L03809, doi:10.1029/2004GL021765, 2005.
Polvani, L. M. and Kushner, P. J.: Tropospheric response to strato-spheric perturbations in a relatively simple general circulation model, Geophys. Res. Lett., 29, doi:10.1029/2001GL014284, 2002.
Quan, X., Diaz, H. F., and Hoerling, M. P.: Changes of The Hadley Circulation Since 1950. The conference on the Hadley circula-tion: Present, Past and Future, 12–15 November, 2002, Hon-olulu, Hawaii, 2002.
Ramanathan, V., Chung, C., Kim, D., et al.: Atmospheric brown clouds: Impacts on S. Asian climate and hydrological cycle. PNAS, 102, 5326–5333, 2005.
Rosenlof, K. H.: Transport changes inferred from HALOE water and methane measurements, J. Meteorol. Soc. Jpn., 80(4B), 831– 848, 2002.
Santer, B. D., Wehner, M. F., Wigley, T. M. L., et al.: Contributions of Anthropogenic and Natural Forcing to Recent Tropopause Height Changes, Science, 301, 479–483, 2003.
Stackhouse Jr., P. W.: GEWEX News, November, 2004.
Trenberth, K. E. and Smith, L.: The vertical structure of temper-ature in the tropics: Different flavors of El Nino, J. Clim., 19, 4956–4973, 2006.
Trenberth, K. E.: Changes in tropical clouds and radiation: Are they real? Science, 296, 2095a, 2002.
Uppala, S. M., Kallberg, P. W., Simmons, A. J., et al.: The ERA-40 reanalysis, Quart. J. Roy. Meteorol. Soc., 131, 2961–3012, 2005. Wielicki, B. A., Wong, T., Allan, R. P., et al.: Evidence for large decadal variability in the tropical mean radiative energy budget, Science, 295, 841–843, 2002.
Wong, T., Wielicki, B. A., Lee III, R. B., et al.: Reexamination of the observed decadal variability of the earth radiation budget using altitude-corrected ERBE/ERBS nonscanner WFOV data, J. Clim. 19, 4028–4040, 2006.
Zhang, X., Zwiers, F. W., Hegerl, G. C., et al.: Detection of human influence on twentieth-century precipitation trends, Nature, 448, 461–465, 2007.
Zhang, Y., Rossow, W. B., Lacis, A. A., et al.: Calculation of radia-tive fluxes from the surface to top of atmosphere based on ISCCP and other global datasets: Refinements of the radiative trans-fer model and the input data, J. Geophys. Res., 109, D19105, doi:10.1029/2003JD004457, 2004.