HAL Id: hal-00305166
https://hal.archives-ouvertes.fr/hal-00305166
Submitted on 24 Apr 2008
HAL is a multi-disciplinary open access
archive for the deposit and dissemination of
sci-entific research documents, whether they are
pub-lished or not. The documents may come from
teaching and research institutions in France or
abroad, or from public or private research centers.
L’archive ouverte pluridisciplinaire HAL, est
destinée au dépôt et à la diffusion de documents
scientifiques de niveau recherche, publiés ou non,
émanant des établissements d’enseignement et de
recherche français ou étrangers, des laboratoires
publics ou privés.
T. Nehls, G. Jozefaciuk, Z. Sokolowska, M. Hajnos, G. Wessolek
To cite this version:
T. Nehls, G. Jozefaciuk, Z. Sokolowska, M. Hajnos, G. Wessolek. Filter properties of seam material
from paved urban soils. Hydrology and Earth System Sciences Discussions, European Geosciences
Union, 2008, 12 (2), pp.691-702. �hal-00305166�
www.hydrol-earth-syst-sci.net/12/691/2008/ © Author(s) 2008. This work is distributed under the Creative Commons Attribution 3.0 License.
Earth System
Sciences
Filter properties of seam material from paved urban soils
T. Nehls1, G. Jozefaciuk2, Z. Sokolowska2, M. Hajnos2, and G. Wessolek11Berlin Institute for Technology, Dept. for Ecology, Chair for Soil Conservation, Salzufer 11-12, 10587 Berlin, Germany 2Institute of Agrophysics of Polish Academy of Sciences, Doswiadczalna 4, 20-290 Lublin, Poland
Received: 9 August 2007 – Published in Hydrol. Earth Syst. Sci. Discuss.: 15 August 2007 Revised: 10 March 2008 – Accepted: 24 March 2008 – Published: 24 April 2008
Abstract. Depositions of all kinds of urban dirt and dust including anthropogenic organic substances like soot change the filter properties of the seam filling material of pervious pavements and lead to the formation of a new soil substrate called seam material.
In this study, the impact of the particular urban form of organic matter (OM) on the seam materials CECpot, the spe-cific surface area (As), the surface charge density (SCD), the
adsorption energies (Ea) and the adsorption of Cd and P b
were assessed. The Cd and P b displacement through the pavement system has been simulated in order to assess the risk of soil and groundwater contamination from infiltration of rainwater in paved urban soils.
As, Ea and SCD derived from water vapor adsorption
isotherms, CECpot, P b and Cd adsorption isotherms where analyzed from adsorption experiments. The seam mate-rial is characterized by a darker munsell-color and a higher Corg (12 to 48 g kg−1) compared to the original seam fill-ing. Although, the increased Corg leads to higher As
(16 m2g−1) and higher CECpot(0.7 to 4.8 cmolckg−1), with 78 cmolckg−1C its specific CECpotis low compared to OM of non-urban soils. This can be explained by a low SCD of 1.2×10⁻⁶molcm−2and a low fraction of high adsorption energy sites which is likely caused by the non-polar character of the accumulated urban OM in the seam material.
The seam material shows stronger sorption of P b and Cd compared to the original construction sand. The retarda-tion capacity of seam material for P b is similar, for Cd it is much smaller compared to natural sandy soils with similar Corgconcentrations. The simulated long term displacement scenarios for a street in Berlin do not indicate an acute con-tamination risk for P b. For Cd the infiltration from puddles can lead to a breakthrough of Cd through the pavement
sys-Correspondence to: T. Nehls
tem during only one decade. Although they contain contam-inations itself, the accumulated forms of urban OM lead to improved filter properties of the seam material and may re-tard contaminations more effectively than the originally used construction sand.
1 Introduction
In urban areas, sealing of soil surfaces leads to ecological problems caused by the increased and accelerated runoff and reduced evapotranspiration compared to non-sealed soils. Cities are normally drier and hotter than the surrounding ar-eas. At heavy rainfalls the exceeding water causes mixed sewage systems to run over. This is one of the main threats to water quality of urban water bodies (Heinzmann, 1998). Therefore, run off reduction by increasing infiltration is among the main ideas of ecological urban planning. This goal can be reached by increased use of pervious pavements. In many European cities, especially in the older parts, they are regularly found. They keep the convenience for the city dwellers but allow infiltration rates of 58 cm d−1 for a mo-saic tile pavement with 20 % of seams, until 155 cm d−1for so called grass pavers having a coverage of open seams of up to 41% (Wessolek and Facklam, 1997).
The seams allow infiltration and the pavers reduce evaporation. Therefore, groundwater recharge rates are 99 to 208 mm a−1 in sealed areas compared to only
80 mm a−1 for a pine-oak forest around Berlin (Wessolek
and Renger, 1998). If rain water accumulates in puddles on the pavements, the groundwater recharge can be greater than 300 mm a−1. Puddles with up to 60 mm depth are no ex-ception in old quarters. We gauged a puddle in front of our department (52◦31′4.03′N; 13◦19′25.79′E) with a volume of 56 L at a horizontal projection of only 2 m2. Rainwater runoff in urban areas is often contaminated, e.g. by heavy metals. Dannecker et al. (1990) and Boller (1997) found P b
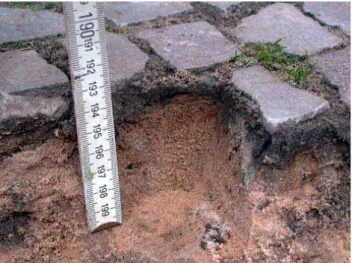
Fig. 1. Dark seam material (0 to 1 cm) compared to the lighter
orig-inal sandy seam filling (1 to 5 cm) at the sidewalk at Pfluegerstrasse, Berlin.
concentrations of up to 0.3 mg L−1in the street runoff, while
Cd concentrations reached up to 0.0076 mg L−1 (Dierkes and Geiger, 1999). The high infiltration rates might result in high contaminant fluxes even if dissolved contaminant con-centrations are low (Dannecker et al., 1990). An assessment of the risk of soil and groundwater contamination requires hydraulic and sorption parameters for the pavers and the con-struction material, mainly sand. Furthermore, after a while, a new horizon, the “seam material”, develops. The term “seam material” describes the soil material in between sin-gle pavestones of pavements, which developed from techno-genic sand. It has a black or brownish black color accord-ing to Munsell soil color table, is mostly only 1 cm thick and contains all kinds of deposited urban dirt like foliage, hairs, oil, dog faeces, food residues, cigarette stubs, glas – in short: any kind of urban waste, small enough to fit into the pavement seams, at least after being milled by pedes-trians or cars. Thereby, pedespedes-trians and cars abrase their soles and tires and these abrasions also end up in the seams. Furthermore seams contain great portions of urban dust and therefore soot, concrete abrasions, aerosols and so on. While the hydraulical characteristics of the seam material have al-ready been investigated (Nehls et al., 2006), the chemical filter properties are still unknown. They can not be extrap-olated from other soils because the organic carbon (Corg) of this material differs from non-urban, natural soils in ori-gin, quality and function. For instance, the percentage of black carbon, a “combustion-produced black particulate car-bon, having a graphitic microstructure” (Novakov, 1984) on Corgis increased compared to non-urban soils (own unpub-lished data). It is hypothesized, that because of its increased Corgcontents, seam material acts as a valuable filter and in-fluences transport processes through the pavement seams.
Therefore, the motivation of this study was to assess the seam materials retardation potential for heavy metals under con-sideration of its special forms of organic matter, its source or sink function and its thickness. Therefore, (i) general surface and filter properties of the seam material were investigated in relation to Corgby ion exchange and water vapor adsorp-tion measurements. Caadsorp-tion exchange capacity, surface area, surface charge density, and adsorption energy were studied. Thereby, the OM itself could be characterized. Furthermore, (ii) the seam materials specific adsorption of Pb and Cd, two relevant toxic heavy metals of different mobility and affinity to organic matter, were exemplarily studied. Finally, (iii) the heavy metal solute transport through the pavement system considering the seam material have been simulated using the investigated parameters.
2 Material and methods 2.1 Sites and sampling
Samples were taken in Berlin and Warsaw, two cities with similar climatic, geologic and geomorphologic conditions, but different industrial activity, traffic intensity and contami-nation history. The sampling sites were located close to roads or directly on roads.
Samples consisted of the material that fills spaces be-tween single stones of pavements. The dark seam material at 0 to 1 cm depth was always easily distinguishable from a much brighter 1 to 5 cm layer (Fig. 1). The upper layer is influenced by all external factors and deposits, while the deeper one was taken as representative of the original seem filling material, which is not severely altered by external de-posits. The seam material was scraped up using one–way polyethylene teaspoons - once, under suspicious observation of the police.
In Berlin (B-samples), we sampled both the seam mate-rial and the original seam filling layer, while only the upper layer was sampled in Warsaw (W-samples). Samples were taken in the following streets: Monbijouplatz (B1, B1a), Weidendamm (B2, B2a), Schnellerstrasse (B3, B3a), from different places at the Grosser Stern (B4–B8, B4a), Emilii Plater (W1), Jerozolimskie (W2), Pulawska (W3), Rzy-mowskiego (W4), Stanow Zjednoczonych (W5), Modlinska (W6), Slowackiego (W7), Wilanowska (W8) and Rowecki Bridge (W9). Sampling sites were located on sidewalks within 2 m from roads with different traffic intensity, while samples from the Pfluegerstrasse (B9, B10) were sampled directly on the road. Samples B1a-B4a have been taken from the same sites as B1 to B4, the index “a” indicates that sam-ples consist of original seam filling material (1 to 5 cm). 2.2 General chemical properties
Munsells’s color was determined for fresh samples. The pH(CaCl2) and electric conductance (EC) have been
measured using standard methods (ISO 10390, DIN-ISO 11265).
The samples W8 and W9 showed higher EC than the other samples (see Table 2). Together with the Berlin samples B2 and B9 they have been additionally analysed for Cl− and SO2−4 using capillary electrophoresis (Agilent 3D CE). It has been calculated how much of the measured EC is caused by Cl−and SO2−4 following the empirical relation between EC [mS cm−1] and ionic strength I [mol L−1] at 298 K given by Griffin and Jurinak (1973):
I ∼= 0.013 EC (1)
and the relationship between individual ion concentration
ci [mol L−1], its valency zi[-] and I :
I = 0.5Xciz2i (2)
The potential cation exchange capacity (CECpot) was de-termined at pH 8.2 using a batch method with cation ex-change and re-exex-change (Mehlich, 1984) because of high EC of the samples. The total carbon content, Ctotand Corg were determined conductometrically after combustion (Carlo Erba, C/N analyzer, Corgafter HCl-treatment to remove car-bonates).
2.3 Surface properties
The specific surface area (As) and the adsorption
ener-gies (Ea) were calculated from water vapor adsorption
isotherms using the vacuum chamber method at the temper-ature T=294±0.1 K. Prior to the adsorption measurement, soil sample aliquots of 3 g were dried in a hermetic chamber with concentrated sulphuric acid until constancy of weights. Then, they were exposed to 20 stepwise rising water vapor pressures (p/ps) ranging from 0.005 to 0.98 which were
con-trolled by sulfuric acid solutions. The samples were equili-brated with the corresponding water vapour until constancy of weights. The higher p/ps is, the longer the time gets for
equilibration, at the highest step more then one week was necessary. The mass of adsorbed water, a, was the difference between the weight of the humid sample and the dry sample (dried for 24 h at 378 K). Results of triple weightings had a coefficient of variation (CV ) of 3.7 %, averaged values were used for further calculations.
Aranovich’s theory of polymolecular adsorption has been used to obtain the capacity of a mono-molecular layer from the experimental water vapour adsorption isotherms (Fig. 2). In contrast to the standard Brunauer-Emmett-Teller (BET) model (Brunauer et al., 1938), Aranovich’s isotherm al-lows vacancies in the adsorbed layer and describes the polymolecular adsorption over a broader and more realis-tic range of p/ps (≈0.05<p/ps<0.8) than the BET does
(≈0.05<p/ps<0.3) (Aranovich, 1992): a = amC p/ps (1 + C p/ps)√(1 − p/ps) , (3) 0 1 2 3 4 5 0.0 0.3 0.6 0.9 p/ps a [10 -2 g g -1 ] B2 B4 B10 B2a B4a W2 W6 W9 salinity
Fig. 2. Measured water-vapor adsorption isotherms for seam
ma-terial of pavements in Berlin (B) and Warsaw (W); (a=mass of ad-sorbed water, p/ps=water vapour pressure).
where p/ps [Pa Pa−1] is the water vapour pressure , a [g] is
the adsorbed water at a given p/ps, am[g] is the statistical
monolayer capacity and C=eEa −Ec¯R T , a constant related to the
adsorption energy, ¯Ea[J] and condensation energy of water,
Ec[J].
Aranovich’s isotherm was fitted to the experimental data (measured a vs. adjusted p/ps) to derive values for amand
C.
Having am, we calculated As [m2] of the sample using the
following equation:
As =
amL ω
M . (4)
Here, L is the Avogadro number (6.02×10²³ molecules per mole), M [g mol−1] is the molecular mass of the adsorbate and ω is the area occupied by a single adsorbate molecule (1.08×10⁻¹⁹m2for water). Knowing As, the surface charge
density SCD [cmolcm−2] can be calculated:
SCD = CECA pot
s
, (5)
The adsorption energy distribution functions showing frac-tions f of surface sites of different adsorption energies, (f (Ei)), were calculated from adsorption isotherms data,
us-ing the theory of adsorption on heterogeneous surfaces (Ja-roniec and Brauer, 1986). Aranovich’s isotherm (Aranovich, 1992) was applied to describe local adsorption effects in the total adsorption isotherm 2T(p), which is the sum of
Table 1. Input parameters for the numerical simulation of heavy metal displacement through a pavement soil column. 2r residual water
content, 2s water content at saturation, α 1/matric potential at air entry, n fitting parameter, KS water conductivity at saturation, ρBdry
bulk density, KS1,2∗ and 2∗s indicate derived effective model parameters for realizing the two chosen water flow conditions, Kf(P b, Cd)
Freundlich’s equilibrium constant for P b and Cd, m Freundlich’s exponent for P b and Cd, cP b,Cddissolved heavy metal concentrations.
general model parameters length unit: cm, time unit: d, mass unit: mg length of the column: 20 cm; number of nodes: 101 upper boundary condition: constant pressure head 9u
lower boundary condition: constant pressure head 9l
seam material construction sand soil hydraulic parameters
2r h cm3cm−3i 0.117 0.058 2s h cm3cm−3i 0.527 0.424 α hcm−1i 0.034 0.058 n [−] 1.514 1.401 KS h cm d−1 i 715 374 ρB h g cm−3i 1.16 1.51
water flow parameters in the model
9u= 9l [cm] 0
KS1,2∗ hcm d−1i 0.12, 0.48
2∗s hcm3cm−3i 0.264 for KS1∗ (0.298 for KS2∗ ) 0.231 for KS1∗ (0.265 for KS2∗ ) adsorption parameters
B1 B2 B4 B9 B1a B2a B4a B9a
Kf(Pb) h mg1−mLmkg−1i 2638 2133 1321 1416 499 272 833 738 m(Pb) [−] 1.00 1.00 0.45 0.62 0.92 1.00 0.55 0.62 cP b(soil water)hmg L−1i 0 0.22 0.02 0.04 0.04 0.46 0.01 0.01 cP b(rainwater) h mg L−1 i 0.3 Kf(Cd)[mg1−mLmkg−1] 20.38 16.95 19.37 15.18 6.92 5.41 5.66 8.61 m(Cd) [−] 0.70 0.38 0.62 0.28 0.63 0.41 0.40 0.34 cCd(soil water) h mg L−1i 0.013 0.020 0.004 0.020 0.023 0.013 0.020 0.019 cCd(rainwater) h mg L−1 i 0.01
adsorptions on sites of energy Ei, weighted by their
frac-tions, f (Ei): 2T(p) = 1 √ 1 − x n X i=1 Cix (1 − Cix)f (Ei) . (6)
Here, x = p/psand Ci is the value of the constant C for sites
of kind i. Solving Eq. (6) for f (Ei) is an ill-conditioned
problem. Small variation in experimental data caused by het-erogeneity of the samples and detections capabilities of the balance leads to large variation in estimation of site fractions. Therefore, a condensation approximation CA was inserted
(Harris, 1968). This method is based on the replacement of the local isotherm by a step-function. The final formula for the calculation of site fractions then becomes:
f (Ei) =
√
1 − xi+12τ(Ei+1) −√1 − xi 2τ(Ei)
Ei+1− Ei
. (7)
From f (Ei) values, the average water vapor adsorption
en-ergy, ¯Ea, can be calculated by the following equation as
de-scribed by Jozefaciuk and Shin (1996):
¯ Ea=
X
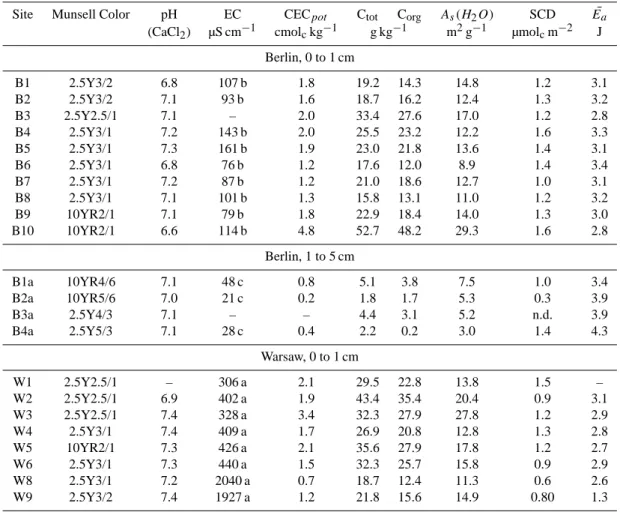
Table 2. Surface properties and general characteristics of seam materials and original seam fillings from Berlin and Warsaw. Values in one
column followed by the same letter are not significantly different at p<0.05; N=20.
Site Munsell Color pH EC CECpot Ctot Corg As(H2O) SCD E¯a
(CaCl2) µS cm−1 cmolckg−1 g kg−1 m2g−1 µmolcm−2 J
Berlin, 0 to 1 cm B1 2.5Y3/2 6.8 107 b 1.8 19.2 14.3 14.8 1.2 3.1 B2 2.5Y3/2 7.1 93 b 1.6 18.7 16.2 12.4 1.3 3.2 B3 2.5Y2.5/1 7.1 – 2.0 33.4 27.6 17.0 1.2 2.8 B4 2.5Y3/1 7.2 143 b 2.0 25.5 23.2 12.2 1.6 3.3 B5 2.5Y3/1 7.3 161 b 1.9 23.0 21.8 13.6 1.4 3.1 B6 2.5Y3/1 6.8 76 b 1.2 17.6 12.0 8.9 1.4 3.4 B7 2.5Y3/1 7.2 87 b 1.2 21.0 18.6 12.7 1.0 3.1 B8 2.5Y3/1 7.1 101 b 1.3 15.8 13.1 11.0 1.2 3.2 B9 10YR2/1 7.1 79 b 1.8 22.9 18.4 14.0 1.3 3.0 B10 10YR2/1 6.6 114 b 4.8 52.7 48.2 29.3 1.6 2.8 Berlin, 1 to 5 cm B1a 10YR4/6 7.1 48 c 0.8 5.1 3.8 7.5 1.0 3.4 B2a 10YR5/6 7.0 21 c 0.2 1.8 1.7 5.3 0.3 3.9 B3a 2.5Y4/3 7.1 – – 4.4 3.1 5.2 n.d. 3.9 B4a 2.5Y5/3 7.1 28 c 0.4 2.2 0.2 3.0 1.4 4.3 Warsaw, 0 to 1 cm W1 2.5Y2.5/1 – 306 a 2.1 29.5 22.8 13.8 1.5 – W2 2.5Y2.5/1 6.9 402 a 1.9 43.4 35.4 20.4 0.9 3.1 W3 2.5Y2.5/1 7.4 328 a 3.4 32.3 27.9 27.8 1.2 2.9 W4 2.5Y3/1 7.4 409 a 1.7 26.9 20.8 12.8 1.3 2.8 W5 10YR2/1 7.3 426 a 2.1 35.6 27.9 17.8 1.2 2.7 W6 2.5Y3/1 7.3 440 a 1.5 32.3 25.7 15.8 0.9 2.9 W8 2.5Y3/1 7.2 2040 a 0.7 18.7 12.4 11.3 0.6 2.6 W9 2.5Y3/2 7.4 1927 a 1.2 21.8 15.6 14.9 0.80 1.3
The calculation of adsorption energy distribution functions (f (Ei) vs Ei) was performed using Eq. (7). Energy values
were expressed in the units of thermal energy (RT ), as scaled energies (E¯a−Ec
RT ). A scaled energy equal to 0 represents an
adsorption energy equal to the condensation energy of the vapor. The maximum adsorption energy in the condensa-tion approximacondensa-tion is related to the minimum value of p/ps
which was around 0.004 in our case. This corresponds to an energy adsorption of around –5.5. Thus, it was reason-able to assume –6 as the maximum energy for the samples. However, this value can be considered only as a first estimate of the maximum energy because of the lack of experimental data at small relative pressures. We arbitrarily set the maxi-mum energy to –8 assuming that if there were no sites with higher adsorption energies than –6, the corresponding values of f (Ei) will be close or equal to zero. In order to reduce the
noise of the measurements, only pairs of values of f (Ei),
which differ for at least 2 units were used.
2.4 Adsorption isotherms for Cd and P b
Adsorption isotherms were obtained for Corgaffected, immo-bile P b and moimmo-bile Cd according to OECD guideline 106 (OECD, 2000). One gram of soil has been equilibrated with 45 ml 0.01 M CaCl2overnight. Then, P b and Cd were added in 5 ml 0.01 M CaCl2solution for 48 h of equilibration. For all samples five stepwise rising solute concentrations begin-ning with destilled water were added. Therefore, the result-ing adsorption isothermes include one desorption step and span over a wide range of concentrations (dissolved concen-trations range from 0.05 to 10 mg L−1for P b and from 0.001 to 5 mg L−1for Cd). After two hours of shaking, the origi-nal pH of the samples were re-adjusted with KOH. Dissolved phase HM concentrations were measured in the supernatant after 20 min of centrifugation at 1000× g.
The corresponding solid phase concentration was analyzed like following. In order to consider only the HM frac-tion which is involved in adsorpfrac-tion processes, the 0.025 M
(NH4)2EDTA (pH 4.6) extractable portion has been de-termined (Welp and Br¨ummer, 1999) in advance for the
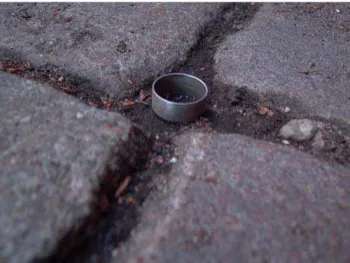
Fig. 3. Undisturbed sampling of seam material (0 to 1 cm) from a
cobbled stone paved street using special 3.3 cm3cylinders in an old residential area at the site Pfluegerstrasse, Berlin.
individual samples. The samples were extracted with con-centrated HNO3(soil/acid ratio=1/20) for 360 min at 453 K under pressure. The difference of HNO3and EDTA extract is the residual concentration which has not been considered as adsorbed phase.
For the fitting of an adsorption isotherm to the experimen-tal data with complex solid phases like soils, the use of the Freundlich model is widely recommended (Stumm and Mor-gan, 1996):
Cs = KfClm , (9)
where Cs [mg kg−1] is the sorbed concentration in the
solid phase, Cl [mg L−1] is the dissolved concentration, Kf
[mg1−mLmkg−1] is the Freundlich distribution coefficient, describing the soil material’s affinity to the solute. The expo-nent m is a measure for the linearity of the adsorption.
Freundlich’s model is favoured before Langmuir, because it does not expect similar energy sites but can be seen as a sum function of Langmuir isotherms for the individual en-ergy sites (Sposito, 1980). So it is adequate to describe the seam material which is a mixture of sorbents with varying surface characteristics and adsorption energy sites.
The adsorption characteristics are studied to describe the mobility of the heavy metals. A good method to compare different adsorption characteristics with different degrees of linearity is to calculate the retardation factor R, which de-rives from the convection-dispersion equation and describes the retardation of substances compared to a conservative, non sorbing tracer: R = 1 +ρB 2 ∂Cs ∂Cl , (10)
where ρB [g cm−3] is the dry bulk density and 2 [m3m−3]
is the water content of the soil. For non-linear adsorption of solutes described by Freundlich’s model R becomes:
R = 1 + ρB 2mKfC
m−1
l . (11)
2.5 Simulation of the Cd and P b displacement
The filter effect of the seam material has been assessed by a numerical HM displacement simulation using the software HYDRUS 1D v2.02 (US Salinity Laboratory USDA-ARS, 1991, Riverside, CA, USA). It solves the Richards equation numerically and applies the convection dispersion equation for the solute transport. It also includes Freundlich’s adsorp-tion model (Simunek et al., 1999). The employed input data are shown in Table 1.
It was the goal to assess the impact of the chemical prop-erties (special form of OM), the importance (thickness) and the source/sink function (contamination status) of the seam material on heavy metal displacement. The travel times were simulated through a 20 cm long column of (i) construction sand, (ii) a 1 cm thick seam material and 19 cm of construc-tion sand and (iii) 20 cm of seam material. The soil hydrauli-cal parameters of the site B9 have been applied while the chemical features of the sites B1, B2, B4 and B9 have been used for the simulation. Travel time in that context indi-cates the period of time which is required to recover 95 % of the upper boundary concentration at the lower boundary of the column. The measured background concentrations in the soil were (a) ignored (no contamination) and (b) consid-ered as initial conditions. So, six scenarios ia, ib, iia, iib,
iiia, iiib have been simulated. Scenarios ia and iiia compare
the maximum retardation capacity of the original construc-tion material with that of the seam material, while in iia the maximum retardation of the realistic soil material mixture is assessed. The scenarios a and b are then used to assess the actual source/sink potential of the construction sand and the seam material.
Groundwater recharge rates of 120 mm a−1 and of 480 mm a−1(simulating infiltration from puddles) were ap-plied (Wessolek and Renger, 1998). Furthermore, the open seam surface area of 27 %, measured at site B9, was in-cluded to get the daily groundwater recharge rates of 0.12 and 0.48 cm d−1for the open seam area as the net infiltra-tion rate at the upper boundary. Thus, annual evapotranspi-ration has been indirectly considered, but seasonal variations have been disregarded. The water flow was not simulated but realized by accordingly chosen boundary conditions and derived effective parameters for the site B9: Ks∗of 0.12 and 0.48 cm d−1, respectively and pressure heads of 0 cm for the upper and lower boundary conditions. The according arti-ficial saturated water contents, 2∗s corresponded to Ks∗ and were derived from K(9) and 2(9) functions fitted to mea-sured porosity (Nehls et al., 2006) and Ksdata (Table 1). For
material up to bulk densities which have been determined us-ing small cylinders which fitted in the intersection of seams on the cobble stone paved street at site B9 (Fig. 3 and Nehls et al., 2006). For the original construction sand, undisturbed cylinders were taken from the layer beneath the pavestones.
For simulating the actual HM contaminations of the ma-terials, their dissolved equilibrium concentrations were mea-sured and applied (see Table 1).
The infiltrating water can be contaminated too. Rain water runs over the pavements takes up soluble contaminants and accumulates in puddles and infiltrates and evaporates or infil-trates directly through the seams. The concentrations of this infiltrating surface water at the upper boundary for P b and
Cd were chosen to be 0.3 and 0.01 mg L−1, respectively.
3 Results and discussion
3.1 General and surface properties
The seam material shows a neutral soil reaction with an av-erage pH of 7.1 (SD=0.2, N=17), which is typical for urban soils. It is most likely caused by concrete abrasions from buildings (Burghardt, 1994). For the seam material, addition-ally the adjacent pavers can be direct sources of constant car-bonate supply as pedestrians not only abrase the soles of their shoes but also the surface of concrete or limestone pavers. The difference of Ctotand Corg, most probably carbonates, is 5 g kg−1(SD=2 g kg−1, N=18).
The EC is significantly higher in Warsaw compared to Berlin (p<0.05, N=20) (Table 2). The reason for that is most probably a more frequently use of deicing salts on streets of Warsaw compared to Berlin (see below). There was no dif-ference between the seam material and the original construc-tion sand detectable.
The seam material is dark. The Munsell colors objectively prove and quantify this observation (Table 2). Like in “natu-ral” soils this coloration can be explained by an enrichment of OM, which in this case could be black soot. Measured Corgvaries from 12 to 48 g kg−1in the 0 to 1 cm layer and is higher than in the 1 to 5 cm layer (less than 3 g kg−1) (Ta-ble 2). A displacement of Corginto the 1 to 5 cm layer can be expected (Fig. 1). However, the low Corg contents in the 1 to 5 cm layers allow to regard it as original and only slightly altered. Besides that, it cannot be excluded, that the con-struction sand already contained different concentrations and forms of OM.
The CECpot of the 0 to 1 cm layer in Berlin is not significantly different from that in Warsaw. With 1.2 to 4.8 cmolckg−1the CECpotof the seam material is low com-pared to values of 12 to 20 cmolckg−1 for non-urban Ger-man sandy soils (Renger, 1965) or compared to values of 8 to 36 cmolckg−1for Berlin sandy forest soils with similar Corgcontents (Wilczynski et al., 1993).
Fig. 4. Relationship between organic carbon content (Corg) and
potential cation exchange capacity (CECpot) in seam materials (SM,
doted), sandy German soils (GS, solid) (Renger, 1965) and sandy forest soils (FS, dashed) (Wilczynski et al., 1993).
With 0.5 cmolckg−1soil, the CECpotof the 1 to 5 cm layer is significantly smaller than in the first layer. Compared to the original seam filling represented by the 1 to 5 cm layer, the depositions of urban dirt lead to an approximately four times higher CECpot in the seam material. Like for other sandy soils the CECpotof the seam material depends mainly on OM (Renger, 1965). The CECpot of seam materials is proportional to As which depends on Corg (Figs. 4 and 5). Both regression lines intersect the y-axis close to (0;0), which indicates that only Corg compounds contribute substantially to As and to CECpot.
Due to it’s special quality, the contribution of the seam material‘s Corgto CECpotis only 78 cmolckg−1C, (Fig. 4). However, the CECpot of non-urban soil OM has been esti-mated to be around 300 cmolckg−1C by Parfitt et al. (1995) for New Zealand soils and by Krogh et al. (2000) for Dan-ish soils. Higher CECpotof up to 680 cmolckg−1C were ob-served in acidic sandy forest soils (Wilczynski et al., 1993).
As mentioned above, the OM of seam materials consist of different constituents, not everything can be referred to as humus. Black carbon (BC) for instance accounts for up to one third of the Corgfraction (own unpublished data). Al-though BC contributes to the CECpotof soils, its contribution is lower than that of humus (Tryon, 1948).
Assumed, the CECpot of the seam material is solely de-pending on Corg(axis intersection at CECpot=0), the CECpot of the OM rises, if not C=Corg, but C=Corg−BC is applied for the correlation (85 cmolckg−1C, r2=0.77 for Corg and 97 cmolckg−1C, r2=0.77 if C=Corg−BC is applied).
The low contribution of seam materials Corgto CECpotcan be explained by its low specific surface area (Fig. 5) and its low surface charge density. The first of the two reasons can
Fig. 5. Contribution of seam material’s Corg(SM) to specific
sur-face area measured by water vapour desorption isothermes As
com-pared to forest soil’s Corg (FS) investigated by Wilczynski et al.
(1993).
be ascribed to the spheroidal particulate character of the Corg (Nehls et al., 2006) resulting in low As (presuming similar
substance densities) compared to humus. The samples from Berlin and Warsaw show a similar behavior resulting in a strong correlation between Corgand As (r2=0.8). As it can
be seen from the slope of the linear regression line, As of
the seam material’s Corgis about 509 m2g−1C. Wilczynski et al. (1993) investigated a Berlin forest soil using the same methodology for measuring Asand found the contribution of
Corgto As to be up to 1062 m2g−1C.
The SCD of a soil sample is a measure for the quantity of polar functional groups. The SCD of the seam material is seven times lower than that of sandy forest soils (Wilczyn-ski et al., 1993; Hajnos et al., 2003), which causes the com-parable low CEC at similar Corg levels (Fig. 4). Hajnos et al. (2003) report a SCD of 2.9 to 10.6×10⁻⁶molcm−2 for Berlin sandy forest soils, while the SCD of seam mate-rial is not greater than 1.2×10⁻⁶molcm−2. The low SCD of
the seam material’s Corglikely is caused by unpolar organic substances.
This statement is supported by the distribution of Ea
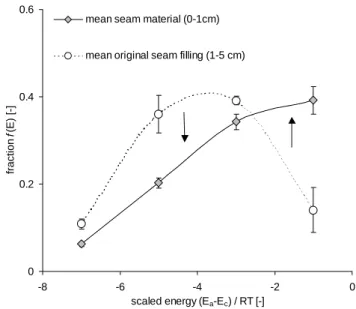
(Fig. 6). Medium energy sites dominate in the original con-struction sand. In the studied seam materials the water bind-ing forces are lower. Most of the seam materials show a high number of low energy sites and only a low number of higher energy sites. This indicates a higher fraction of polar sur-faces in the lower layer. The shift between the construction sand and the seam material is caused by the accumulation of non-polar substances, mainly OM. Additionally, the organic substances may have coated polar mineral surfaces in the up-per layer. 0 0.2 0.4 0.6 -8 -6 -4 -2 0 scaled energy (Ea-Ec) / RT [-] fraction f (E ) [-]
mean seam material (0-1cm)
mean original seam filling (1-5 cm)
Fig. 6. Distribution of scaled adsorption energy levels for seam
ma-terials and original seam filling (sand) from Berlin and Warsaw. The arrows indicate the shift in adsorption energy fractions due to the deposition of urban dust. Error bars show standard errors, N = 19 for seam materials, N=4 for original seam filling.
Higher polarity (indicated by ¯Ea) usually results in higher
SCD. However, there is no dependence between ¯Eaand SCD
for the seam material. Likely, the low ¯Eais caused by the
adsorption of water by deicing salts, which are mainly NaCl, sometimes CaCl2 and MgCl2, and CaSO4as impurity. For samples W8 and W9, Cl−is 0.349 and 0.413 g L−1, SO2−4 is 0.019 and 0.045 g L−1respectively. Cl−alone causes 37 and 46 % of the EC of samples W8 and W9, Cl−together with SO2−4 causes 40 and 53 % of the measured EC (see Ta-ble 2). The latter percentage is likely caused by calculation of EC from I by the equation of Griffin and Jurinak (1973) which was derived empirical for natural aquatic systems and soil extracts not including pavement seam materials. Differ-ent accuracies of the EC measuremDiffer-ents compared to the elec-trophoresis measurements may also play a role. In samples B2 and B9 Cl−is 0.0003 and 0.0014 g L−1and causes only 0.6 and 4 % of the measured EC. Different to the Warsaw samples the influence of SO2−4 for B2 and B9 with concen-trations of 0.002 and 0.004 g L−1is higher. Cl−together with SO2−4 causes 9 and 21 % of the measured EC for B2 and B9. This indicates, that for B2 and B9 deicing salts play not the same important role as for W8 and W9.
We found ¯Eadecreasing with increasing EC which is
re-lated logarithmically with low hydration energy of the salt cations. Similar relations of adsorption energy and soil salin-ity parameters are observed in natural saline environments (Jozefaciuk et al., 1996; Toth and Jozefaciuk, 2002).
3.2 Heavy metal adsorption
The Freundlich Kf values for P b and Cd are higher in the
0 to 1 cm layer than in the 1 to 5 cm layer. The values for
m are similar for both depths. However, a comparison of Kf without considering m is not meaningful. Therefore, the
retardation factors were calculated, which consider both pa-rameters. They vary from 2056 to 94817 for P b and from 42 to 485 for Cd for chosen ρB=1.5 g cm−3, cl=0.1 mg L−1,
2=0.3 m3m−3(Table 3). Thereby, the seam material retards
P b stronger than the original construction sand.
3.2.1 P b adsorption
For samples from Berlin, the higher adsorption potential of the seam material compared to the construction sand cor-responds to higher Corg contents, which is expressed by the correlation of the retardation factor, R and Corg[g g−1] (R=281986 Corg+ 3600; r2=0.82). Thereby, two samples have been excluded from the dataset: B1 and B2. For both samples, the Freundlich parameters were fitted with a spec-ified range for m: 0≤m≤1 to meet the conditions for Fre-undlich’s model stated by Sposito (1980).
There is no correlation of Corgand R for the Warsaw sam-ples. The samples from Warsaw have higher R (p<0.05, N=9) at similar Corg, caused by higher Kf (p<0.05, N=9)
and similar values for m. Following Sposito (1980) that in-dicates a higher variance of adsorbers in Warsaw, providing adsorption sites with a broader range of P b adsorption en-ergies. This might be due to, (i) a different kind of OM in Warsaw, which provides more adsorption sites for P b com-pared to Berlin. However, this is not supported by different water adsorption energies (Ea) nor by different surface areas
or different EDTA-extractable and total P b concentrations. More likely, it shows (ii) the greater importance of other adsorbers than the studied organic substances for the War-saw samples. In Berlin, P btot correlates closely with Corg, indicating same sources, e.g. combustion processes and/or strong adsorption of P b on OM. However, the lacking corre-lation for the Warsaw samples could also be an effect of (iii) the small number of samples compared to the high spatial variability in urban soils.
3.2.2 Cd adsorption
The adsorption of Cd to the soil substrate is higher in the seam material compared to the original construction mate-rial. All retardation factors are higher for the seam material compared to the construction sand (Table 3). Compared to
P b, for Cd the improved sorption capacity is not a result of
the deposition of OM, as there is no corellation between R and Corg, nor Cdtotand Corg. So the deposition of other ad-sorbers,like Mn and Fe-oxides which have not been studied here, could be relevant. There is no difference in the adsorp-tion behaviour of samples from Warsaw or Berlin of Cd.
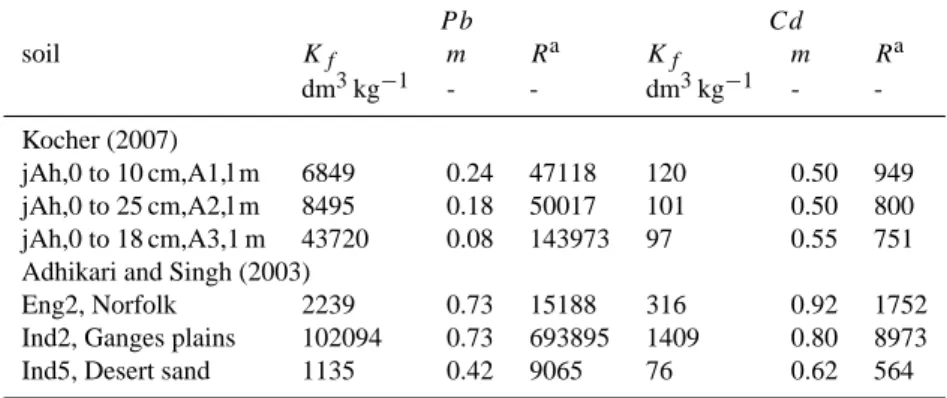
Compared to natural sandy soils, the seam material shows a similar retardation of P b but a low retardation of Cd. Kocher (2007) investigated sandy soils along federal high-ways in Germany for their HM retention while Adhikari and Singh (2003) investigated sandy soils from India and Eng-land (Table 4). The soils A1, A2, and A3 from Kocher (2007) had higher Corg(31, 50, and 50 g kg−1) and slightly lower pH values (6.5,6.6, and 6.1)compared to seam materials but were comparable in terms of clay content (see Nehls et al., 2006). For a comparison, the retardation factors were computed for the same case like in Table 3. For P b, the values are slightly, but not significantly higher. This is due to similar Kf, but
low values for m (0.24, 0.18, and 0.08) indicating a highly non-linear adsorption favouring adsorption at low concentra-tions.
For Cd Kocher (2007) reports of similar m values, while the values for Kf are significantly higher in road side soils
compared to seam materials. So, the Cd retardation in road-side soils is clearly higher compared to seam materials. 3.3 Simulated HM displacement
For the groundwater recharge rate of 120 mm a−1, the sim-ulated displacement times vary from 315 to 2350 a for P b and from 37 to 253 a for Cd (Table 5). At the site B2, the measured dissolved equilibrium concentration of P b in the soil is already higher than the concentration in the infiltrat-ing surface water. For Cd, however all sites show higher soil water than rainwater concentrations. In these scenar-ios, every rainfall is a net HM displacement. Apart from these cases, the positive filter effects of urban depositions, which were already discussed by means of retardation fac-tors, could be approved by the simulations for all cases but one. In the simulations, besides adsorption behaviour, also the soil hydraulic properties and the dry bulk densities were considered. The smaller dry bulk density of the seam mate-rial compared to the construction matemate-rial results in a smaller number of adsorption sites per volume unit in the seam mate-rial although the number of adsorption sites per mass unit of the seam material is higher than in the original construction material. The displacement of Cd at the site B4 is the one example that shows this effect. If the scenarios ia and iiia for the site B4 are calculated with the original seam filling’s dry bulk densities, the travel period through the seam material would be 105 a and therefore higher than that of the origi-nal seam filling. So except for the displacement of Cd at the site B4 we conclude that in general, the seam material has a positive impact on the retardation of Cd and P b. Although the impact is detectable, it is not substantial and the forma-tion of only 1 cm thick layer of seam material does not lead to longer travel periods. However, the potential of the urban dirt as a P b filter is clearly to be seen if the scenarios iiib are compared to scenarios ia: even contaminated seam ma-terial is a much better filter than any clean construction sand. For Cd, the background contamination is that high, that both
Table 3. Heavy metal adsorption parameters of seam material from Berlin and Warsaw. Kf Freundlich’s equilibrium constant, m
Freundlich’s exponent, ctottotal heavy metal concentrations in soil, R retardation factor, cldissolved concentraion, 2 soil water content, ρB
dry bulk density.
P b Cd
Site Kf m r2 ctot Ra Kf m r2 ctot Ra
mg1−mLmkg−1 mg kg−1 mg1−mLmkg−1 mg kg−1 Berlin, 0 to 1 cm B1 2638(b) 1.00 0.87 68.5 19919 20.4 0.70 0.98 2.0 147 B2 2133(b) 1.00 0.71 91.0 15916 17.0 0.38 0.99 9.5 155 B4 1321 0.45 0.93 309.5 8685 19.4 0.62 0.99 n.d. 162 B5 977 0.44 0.96 290.2 6398 12.2 0.54 0.94 2.0 108 B6 1111 0.54 0.84 190.1 7901 12.2 0.21 0.93 6.1 82 B7 1376 0.93 0.96 222.0 10518 13.0 0.25 0.96 8.4 100 B8 1056 0.58 0.91 163.4 7653 16.5 0.29 0.98 6.9 121 B9 1416 0.62 0.86 203.5 10476 14.2 0.48 0.94 2.0 119 B10 2483 0.57 0.95 480.0 17914 15.2 0.28 0.98 6.1 110 Berlin, 1 to 5 cm B1a 499 0.92 0.96 38.3 3817 6.9 0.63 0.81 2.1 62 B2a 272(b) 1.00 0.99 49.6 2056 5.4 0.41 0.99 5.2 53 B4a 833 0.55 0.95 72.6 5961 5.7 0.40 0.69 4.0 43 B9a 738 0.62 0.93 135.6 5449 8.6 0.34 0.99 13.0 82 Warsaw, 0 to 1 cm W1 12558(b) 1.00 0.97 148.1 94817 20.3 0.30 0.98 2.9 145 W2 8052 0.89 0.97 180.9 61784 11.9 0.18 0.85 5.1 87 W3 4699 0.76 0.95 159.3 35982 12.1 0.15 0.76 5.5 77 W5 2738 0.91 0.87 99.7 20965 33.6 0.28 0.90 8.5 280 W8 2234 0.75 0.98 98.5 17088 8.4 0.10 0.89 5.2 42 W9 3078 0.88 0.89 270.7 23627 79.2 0.55 0.99 5.0 485 aρ B=1.5 g cm−3, cl=0.1 mg L−1, 2=0.3 m3m−3 (b)
isotherms were fitted with 0≤m≤1
Table 4. Published adsorption data for soils comparable to seam material concerning organic matter and clay content.
P b Cd soil Kf m Ra Kf m Ra dm3kg−1 - - dm3kg−1 - -Kocher (2007) jAh,0 to 10 cm,A1,l m 6849 0.24 47118 120 0.50 949 jAh,0 to 25 cm,A2,l m 8495 0.18 50017 101 0.50 800 jAh,0 to 18 cm,A3,1 m 43720 0.08 143973 97 0.55 751 Adhikari and Singh (2003)
Eng2, Norfolk 2239 0.73 15188 316 0.92 1752 Ind2, Ganges plains 102094 0.73 693895 1409 0.80 8973 Ind5, Desert sand 1135 0.42 9065 76 0.62 564
aρ
Table 5. Simulated heavy metal displacement through a 20 cm paved soil column at different sites in Berlin.
Scenario P b Cd
B1 B2 B4 B9 B1 B2 B4 B9 travel periodafor 120 mm a−1
ia (uncontaminated sand) 610 315 1253 1072 37 92 100.8 176 ib (contaminated sand) 584 0 1159 1016 0 0 0 0 iia (uncontaminated sand with seam material) 612 320 1255 1075 39 93 101.4 179 iia (contaminated sand with seam material) 588 0 1158 1008 0 0 0 0 iiia (uncontaminated seam material) 2350 1901 1603 1578 90 185 83 253 iiib (contaminated seam material) 2350 1315 1341 1392 0 0 60 0
aindicate moment when 95% of applied concentration are detected at lower boundary
seam material and original construction sand act as a source rather than as a sink.
Because of the abundance of puddles at streets and side-walks in urban areas, we simulated the infiltration of accumu-lated rainwater runoff from puddles. Realizing a higher infil-tration rate of 0.48 instead of 0.12 cm d−1influences the soil water content and therefore the pore water velocities. The average ratio between the traveltimes for 120 mm a−1 and
480 mm a−1 is 1/4. The calculated traveltimes range from
10 to 100 a for Cd. As the pavements at the investigated sites were constructed from the early 1900s on, a substan-tial mass of heavy metals may already have left the upper soil layers. The displacement risk for P b even from puddles is rather low. However, the simulated infiltration from pud-dles shows the high importance of non-uniform infiltration in urban areas. It therefore underlines the need of knowledge on soil surface properties for realistic risk assessments, e.g. for more mobile substances such as glyphosate (Kempenaar et al., 2007).
4 Conclusions
Depositions of all kinds of urban dirt form the seam mate-rial, which has different properties than the original material. Compared to the original construction sand, the depositions lead to increased specific surface area and cation exchange capacity. Compared to natural OM this anthropogenic form of organic material has a rather small surface area and sur-face charge density which results in comparable low cation exchange capacity.
In terms of heavy metal mobilisation and retention the seam material can act as a filter and a source depending on the element. Thereby the source as well as the filter effect are low because of the typical thin layer of only 1 cm. The simulated break through times for one dimensional matric flow suggest, that there is no general risk of a groundwater contamination from traffic released Cd and P b. However, the infiltration of rainwater from puddles can lead to fast
dis-placement of Cd, which may leave the pavement system af-ter only a decade. We conclude, that the seam maaf-terial is a interesting model substrate to show the positive and nega-tive impacts of deposited dust on ecological soil functions in urban areas.
Acknowledgements. We greatefully thank the DFG (WE
1125/18-1) and the Polish Academy of Sciences for funding. Furthermore, we thank especially H. Stoffregen for his help and discussions. Edited by: P. Grathwohl
References
Adhikari, T. and Singh, M.: Sorption characteristics of lead and cadmium in some soils of India, Geoderma, 114, 81–92, 2003. Aranovich, G.: The theory of polymolecular adsorption, Langmuir,
8, 736–739, 1992.
Boller, M.: Tracking heavy metals reveals sustainability deficits of urban drainage systems, Water Science and Technology, 35, 77– 87, 1997.
Brunauer, S., Emmett, P. H., and Teller, E.: Adsorption of gases in multimolecular layers, Journal of the American Chemical Soci-ety, 60, 309–319, 1938.
Burghardt, W.: Soils in urban and industrial environments, Journal of Plant Nutrition and Soil Science, 157, 205–214, 1994. Dannecker, W., Au, M., and Stechmann, H.: Substance Load in
Rainwater Runoff from Different Streets in Hamburg, The Sci-ence of the Total Environment, 93, 385–392, 1990.
Dierkes, C. and Geiger, W. F.: Pollution retention capabilities of roadside soils, Water Science and Technology, 39, 201–208, 1999.
Griffin, R.A. and Jurinak, J.J.: Estimation of Activity-Coefficients from Electrical Conductivity of Natural Aquatic Systems and Soil Extracts, Soil Science, 116, 26-30, 1973.
Hajnos, M., Jozefaciuk, G., Sokolowska, Z., Greiffenhagen, A., and Wessolek, G.: Water storage, surface, and structural properties of sandy forest humus horizons, Journal of Plant Nutrition and Soil Science, 166, 625–634, 2003.
Harris, L.: Adsorption on a patchwise heterogeneous surface. I. Mathemantical analysis of the step function approximation of the local isotherm, Surface Science, 10, 129–145, 1968.
Heinzmann, B.: Improvement of the surface water quality in the Berlin region, Water Science and Technology, 38, 191–200, 1998.
Jaroniec, M. and Brauer, P.: Recent progress in determination of energetic heterogeneity of solids from adsorption data, Surface Science Reports, 6, 65–117, 1986.
Jozefaciuk, G. and Shin, J.: Water vapor adsorption on soils. II.Estimation of adsorption energy distributions using local BET and Aranovich isotherms, Korean Journal of Soil Science and Fertilizer, 29, 218–225, 1996.
Jozefaciuk, G., Toth, T. and Szendrei, G. (2006) Surface and mi-cropore properties of saline soil profiles. Geoderma, 135, 1-15, 1996
Kempenaar, C., Lotz, L. A. P., van der Horst, C. L. M., Beltman, W. H. J., Leemnans, K. J. M., and Bannink, A. D.: Trade off between costs and environmental effects of weed control on pavements, Crop Protection, 26, 430–435, 2007.
Kocher, B.: Eintr¨age und Verlagerung strassenverkehrsbedingter Schwermetalle in Sandb¨oden an stark befahrenen Ausserort-strassen, in: Boden¨okologie und Bodengenese 38, edited by Renger, M., Wessolek, G., Kaupenjohann, M. and Alaily, F. , Berlin : Fachgebiete Bodenkunde / Standortskunde und Bo-denschutz, Institut f¨ur ¨Okologie, Technische Universit¨at Berlin, 2007.
Krogh, L., Breuning-Madsen, H., and Greve, M. H.: Cation-exchange capacity pedotransfer functions for Danish soils, Acta Agriculturae Scandinavica Section B-Soil and Plant Science, 50, 1–12, 2000.
Mehlich, A.: Mehlich-3 soil test extractant: a modification of Mehlich-2 extractant, Communications in Soil Science and Plant Analysis, 15, 1409–1416, 1984.
Nehls, T., Jozefaciuk, G., Sokolowska, Z., Hajnos, M., and Wes-solek, G.: Pore-system characteristics of pavement seam mate-rials of urban sites, Journal of Plant Nutrition and Soil Science, 169, 16–24, 2006.
Novakov, T.: The role of soot and primary oxidants in atmospheric chemistry, The Science of the Total Environment, 36, 1–10, 1984.
OECD: OECD Guideline for the testing of chemicals No. 106: Ad-sorption - DeAd-sorption Using a Batch Equilibrium Method, 2000. Parfitt, R., Giltrap, D., and Whitton, J.: Contribution of organic matter and clay minerals to the cation exchange capacity of soils, Communications in Soil Science and Plant Analysis, 26, 1343– 1355, 1995.
Renger, M.: Berechnung der Austauschkapazit¨at der organischen und anorganischen Anteile der B¨oden, Zeitschrift f¨ur Pflanzen-ern¨ahrung und Bodenkunde, 110, 10–26, 1965.
Simunek, J., Sejna, M., and vanGenuchten, M.: The HYDRUS-2D Software Package for Simulating the two-dimensional movement of water, heat, and multiple solutes in variably-saturated me-dia, Tech. rep., U.S. Salinity Labaoratory, Riverside, CA 92507, 1999.
Sposito, G.: Derivation of the Freundlich Equation for Ion Ex-change Reactions in Soils, Soil Science Society of America Jour-nal, 44, 652–654, 1980.
Stumm, W. and Morgan, J.: Aquatic Chemistry, John Wiley and Sons, Inc., New York, 3 rd ed. edn., 1996.
Toth, T. and Jozefaciuk, G.: Physicochemical properties of a solonetzic toposequence, Geoderma, 106, 137–159, 2002. Tryon, E.: Effect of charcoal on certain physical, chemical and
bi-ological properties of forest soils, Ecbi-ological Monographs, 18, 82–114, 1948.
Welp, G. and Br¨ummer, G. W.: Adsorption and solubility of ten metals in soil samples of different composition, Journal of Plant Nutrition and Soil Science, 162, 155–161, 1999.
Wessolek, G. and Facklam, M.: Standorteigenschaften und Wasser-haushalt von versiegelten Fl¨achen, Journal of Plant Nutrition and Soil Science, 160, 41–46, 1997.
Wessolek, G. and Renger, M.: Bodenwasser- und Grundwasser-haushalt, in: Stadt¨okologie, edited by Sukopp, H. and Wittig, R., pp. 186–200, Gustav Fischer, Stuttgart, 1998.
Wilczynski, W., Renger, M., Jozefaciuk, G., Hajnos, M., and Sokolowska, Z.: Surface area and CEC as related to qualitative and quantitative changes of forest soil organic matter after lim-ing, Journal of Plant Nutrition and Soil Science, 156, 235–238, 1993.