HAL Id: hal-00317245
https://hal.archives-ouvertes.fr/hal-00317245
Submitted on 1 Jan 2004
HAL is a multi-disciplinary open access
archive for the deposit and dissemination of
sci-entific research documents, whether they are
pub-lished or not. The documents may come from
teaching and research institutions in France or
abroad, or from public or private research centers.
L’archive ouverte pluridisciplinaire HAL, est
destinée au dépôt et à la diffusion de documents
scientifiques de niveau recherche, publiés ou non,
émanant des établissements d’enseignement et de
recherche français ou étrangers, des laboratoires
publics ou privés.
An effect of the ionospheric Alfvén resonator on
multiband Pc1 pulsations
K. Prikner, K. Mursula, J. Kangas, R. Kerttula, F. Z. Feygin
To cite this version:
K. Prikner, K. Mursula, J. Kangas, R. Kerttula, F. Z. Feygin. An effect of the ionospheric Alfvén
resonator on multiband Pc1 pulsations. Annales Geophysicae, European Geosciences Union, 2004, 22
(2), pp.643-651. �hal-00317245�
Annales
Geophysicae
An effect of the ionospheric Alfv´en resonator on multiband Pc1
pulsations
K. Prikner1, K. Mursula2, J. Kangas2, R. Kerttula2, and F. Z. Feygin3
1Geophysical Institute, Academy of Sciences of the Czech Republic, Bocni II, 14131 Praha 4, Sporilov, Czech Republic 2Department of Physical Sciences, University of Oulu, P. O. Box 3000, FIN-90014 Oulu, Finland
3United Institute of Physics of the Earth, Russian Academy of Sciences, Bolshaya Gruzinskaya 10, 123810 Moscow, Russia
Received: 9 September 2002 – Revised: 18 June 2003 – Accepted: 25 June 2003 – Published: 1 January 2004
Abstract. On 2 December 1999, the magnetometer stations
in northern Finland registered structured Pc1 activity simul-taneously in three distinct frequency bands. Using simulta-neous EISCAT radar measurements of the high-latitude iono-sphere, we have studied the ionospheric resonator properties during this multiband Pc1 event. The frequencies of the three structured Pc1 bands were found to closely correspond to the second, third and fourth harmonic of the calculated funda-mental frequency of the ionospheric Alfv´en resonator (IAR). In addition, those frequencies of the three pearl bands that were closest to the exact IAR harmonics were found to have the strongest intensities. The results demonstrate that the res-onator can have an important role on ground-based Pc1 ac-tivity over a notably large frequency range, favoring trans-mission of waves with frequencies close to the resonator’s eigenfrequencies. Since the frequencies of all three bands correspond to the maximum rather than the minimum of the transmission coefficient, the traditional bouncing wave packet model needs to be revised.
Key words. Ionosphere (auroral ionosphere; ionosphere –
magnetosphere interactions; wave propagation)
1 Introduction
Pc1 pulsations are magnetospheric electromagnetic ion cy-clotron (EMIC) waves observed on the ground. At subau-roral latitudes Pc1 events typically occur in the frequency range of 0.2–3.0 Hz, showing only a single narrow frequency band in the dynamic spectrum. However, in addition to these single-band events, one sometimes observes two or even more bands occurring simultaneously. We call these phenomena multiband Pc1 events. There are two traditional mechanisms to explain the generation of multiband Pc1 ac-tivity: ionospheric waveguide ducting of Pc1 waves from multiple sources in the equatorial magnetosphere (Greifinger Correspondence to: K. Mursula
and Greifinger, 1968), and the spectral splitting by the mag-netospheric heavy (He+and O+) ions (Young et al., 1981;
Kozyra et al., 1984).
The effect of the ionosphere on Pc1 activity observed on the ground has received more observational evidence re-cently (Mursula et al., 2000; Prikner et al., 2000; Kerttula et al., 2001; Prikner et al., 2001). The Alfv´en speed has strong gradients above the ionospheric F layer which can cause wave reflection and lead to the formation of a reso-nant cavity termed the ionospheric Alfv´en resonator (IAR) by Polyakov and Rapoport (1981). Since the scale size of the resonator is of the order of the Pc1 wavelength, it is able to trap Pc1 waves incident from above the ionosphere and af-fect their spectral properties and even their appearance on the ground. For example, it has been found (Mursula et al., 2000) that the Pc1 frequency on the ground corresponds to the fre-quency of the first maximum (minimum) of the transmission (reflection) coefficient, i.e. to the fundamental frequency of the resonator (Lysak, 1991, 1993). This indicates that the IAR can act as a band-pass filter for Pc1 waves and deter-mine, together with the magnetospheric wave source, the fre-quencies of the waves that can be observed on the ground.
Earlier studies of the IAR effects on ground-based Pc1 pul-sations have mainly concentrated on single-band events. In this paper we study the resonator properties during a multi-band Pc1 event by using EISCAT radar measurements of the ionosphere above the station detecting Pc1 signals. The ob-tained results demonstrate that the IAR can affect ground-based Pc1 activity over a notably large frequency range.
2 Observations
2.1 Pc1 dynamic spectrum
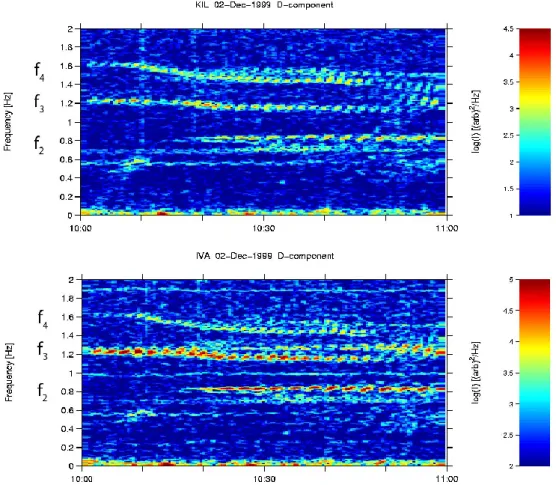
Figure 1 shows the dynamic spectrum of the D-component of multiband Pc1 pulsations registered at the Kilpisj¨arvi (KIL; geographic coordinates 69.0◦latitude, 20.9◦longitude, 65.9◦ CGM latitude, 105.3◦ CGM longitude, L = 6.0) and Ivalo
644 K. Prikner et al.: An effect of the ionospheric Alfv´en resonator on multiband Pc1 pulsations
Fig. 1. The dynamic spectra (D-components) of a multiband Pc1 event registered at the Kilpisj¨arvi (KIL) and Ivalo (IVA) stations on
2 December 1999 between 10:00–11:00 UT.
(IVA, geographic coordinates 68.7◦latitude, 27.3◦longitude,
65.0◦ CGM latitude, 109.8◦ CGM longitude, L = 5.6) sta-tions in northern Finland on 2 December 1999, from 10:00 to 11:00 UT. (There LT is about 2 h ahead of UT.) The magne-tometer data (sampling rate 20 Hz) have been analyzed using an FFT width (and spectral window size) of 2048 points, and a time step of 512 points.
At about 10:20–10:45 UT, both stations register three simultaneous and fairly stable frequency bands located at
f2∼0.68 − 0.85 Hz, f3∼1.12 − 1.31 Hz, and at f4∼1.44 −
1.57 Hz. (Band numbering will be discussed in Sect. 2.3.) One can also see that there is a fourth narrow and much weaker band at f ∼0.53−0.59 Hz which is more pronounced at KIL. All the f2−f4bands show systematic variation in
intensity typical for the so-called structured or “pearl” pulsa-tions. Moreover, the frequency range of about 0.2–2.0 Hz is typical for Pc1 pearls. At both stations, the intensity within the three pearl bands varies with frequency, so that the up-per part of the f2band is more intense than the lower part,
whereas the lower part dominates in the f3 and f4 bands.
(Note that the upper ∼1.3 Hz part of the f3 band is hardly
visible at KIL.) The f3and f4bands do not last much longer
than displayed in Fig. 1, whereas band f2, starting at about
10:00 UT, lasted up to about 11:30 UT.
2.2 EISCAT measurements and the numerical method of the IAR simulation
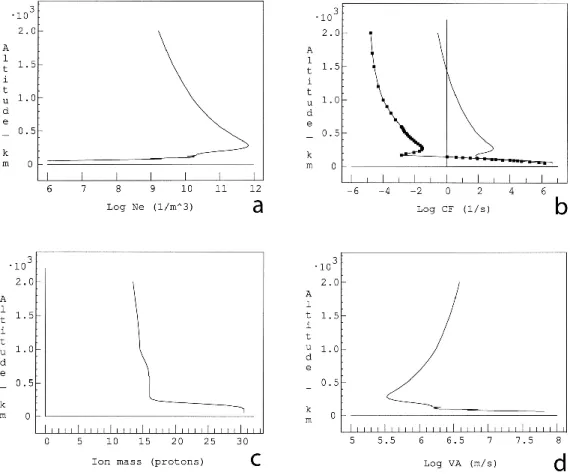
Simultaneously with the multiband Pc1 activity, the EISCAT radar was monitoring the high-latitude ionosphere at Tromsø. Since the radar operated in the CP1 mode, where the radar beam was directed along the background magnetic field, the measurements correspond quite well to the ionospheric con-ditions above KIL which is situated nearly at the same lati-tude but ∼2◦eastward of Tromsø. Figure 2 depicts the
alti-tude profiles of electron density from EISCAT observations (a), the modelled electron and ion collision frequencies (b), the local effective ion mass (c), and Alfv´en velocity (d), up to 2000 km at 10:30 UT. One can see that all these profiles are very smooth, indicating very stable local ionospheric condi-tions at that time. The corresponding profiles (not shown) obtained at a slightly earlier (∼10:00 UT), as well as at a later time (∼12:00 UT) indicate that quiet conditions per-sisted during several hours. Quiet conditions are expected, since the Sodankyl¨a K index was 2, 0, 0, and 0 during the first four 3-hour intervals on that day.
Note that the EISCAT measurements extended only up to 600 km and that the profiles have been extrapolated from this altitude upward. Due to practical reasons concerning
Fig. 2. The altitude profiles of electron density (a), electron (solid line) and ion (solid line with points) collision frequencies (b), local effective
ion mass in units of proton mass (c), and Alfv´en velocity (d) based on EISCAT measurements at Tromsø on 2 December at 10:30 UT. Note that extrapolation has been used at altitudes above 600 km.
numerical simulation method, the ionospheric transmission layer has been constrained to a region where heavy ions (mainly O+) play a significant role, i.e. up to the altitude
of about 2000 km. The O+ion density was assumed to
de-crease exponentially with height. At higher altitudes the light ions (H+ and partially He+) dominate, contributing mainly to wave attenuation, but not significantly to the resonator fre-quency characteristics. The decrease in Neis slower than the
exponential due to the increasing content of the H+ ions at higher altitudes. This can also be seen in Fig. 2c as a gradual decrease in the effective ion mass at altitudes above 700 km. The effect of the ionosphere on ion cyclotron waves was modelled using the 4×4-matrix procedure of Prikner and Vagner (1983, 1991). The simulation uses the following in-put data:
a) Characteristics of the plasma medium, including realis-tic height profiles of the electron density, effective ion mass and particle collision frequencies. The ionosphere is presented as a stack of thin (10 km) and homogeneous planar layers from 50 km up to 2000 km in an exter-nal dipole magnetic field with ME =8.17 × 10²²A m2.
Below 50 km the atmosphere is taken to be neutral and the conductivity of the Earth’s surface is 10−2S/m.
b) Wave propagation characteristics, including the polar-ization of the incident homogeneous plane wave (in general Alfv´enic L||- or isotropic R-mode), its
fre-quency, and the orientation of the wave vector k with respect to BE(z) in the magnetic meridian plane. The
inclination αE of BE(z) is assumed constant with
al-titude above the ground and is negative in the North-ern Hemisphere. We have assumed here a parallel in-cidence (k||BE)of a left-handed field-aligned Alfv´enic
(L||-mode) wave. Thus the incidence angle of k with
respect to the horizontal plane β|| = −αE =77◦in the
Kilpisj¨arvi region was used.
As an output from computations we obtain the altitude pro-files of the complex amplitudes of the E- and B-wave fields. Using this data we can determine the normalized real hor-izontal and vertical components of the wave fields at any frequency and altitude. Normalization is made by divid-ing the horizontal real wave amplitude by the corresponddivid-ing amplitude of the incident wave. Thus, the reflection coeffi-cient RC(f ) is determined as the ratio of the reflected field magnitude on the upper boundary of the ionosphere to the magnitude of the incident wave, and the transmission coeffi-cient TC(f ) is the ratio between the wave transmitted to the ground and the magnitude of the incident wave.
646 K. Prikner et al.: An effect of the ionospheric Alfv´en resonator on multiband Pc1 pulsations
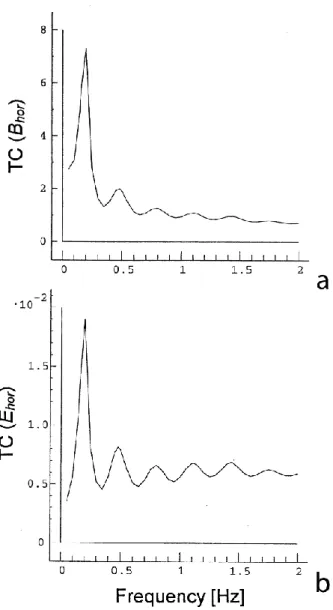
Fig. 3. The transmission coefficient of the left-handed field-aligned
Alfv´enic (L||) wave horizontal magnetic (a) and electric (b) field at
10:30 UT. The model ionosphere extends up to 2000 km.
2.3 Model results
Figure 3 presents the frequency spectrum of the transmission coefficient of the horizontal component of the wave magnetic (a) and electric (b) field at 10:30 UT at Ivalo. As depicted in Fig. 3, altogether six maxima exist below 2.0 Hz. The first and highest maximum at about f0 = 0.20 Hz corresponds
to the fundamental frequency of the resonator and the five smaller maxima, located at f1 = 0.48 Hz, f2 = 0.80 Hz,
f3 = 1.12 Hz, f4 = 1.44 Hz and f5 = 1.75 Hz are
spondingly the first five harmonics. The TC maxima corre-spond to frequency windows for EMIC waves to propagate through the ionosphere to the ground. Note that the posi-tions and widths of these maxima are mostly determined by the electron density profile. It is also important to note that reasonable variations in the extrapolated Ne-profile do not
practically affect the positions of TC maxima.
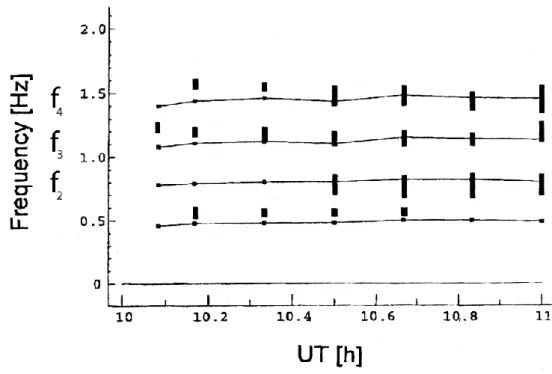
Figure 4 depicts the calculated frequencies f1−f4of the
resonator’s transmission maxima and the observed frequen-cies of the Pc1 bands at KIL between 10:00–11:00 UT at the EISCAT data sampling interval of 1T = 5 min. The fre-quencies of all the three pearl bands f2−f4correspond quite
well to the respective harmonic frequencies of the resonator, in particular during the latter half of the interval studied. (The numbering of the Pc1 bands presented above is based on this correspondence.) However, this matching is slightly weaker in the case of the unstructured Pc1 band at f ∼0.53−0.59 Hz. This may at least partly explain why the signal is so weak on the ground.
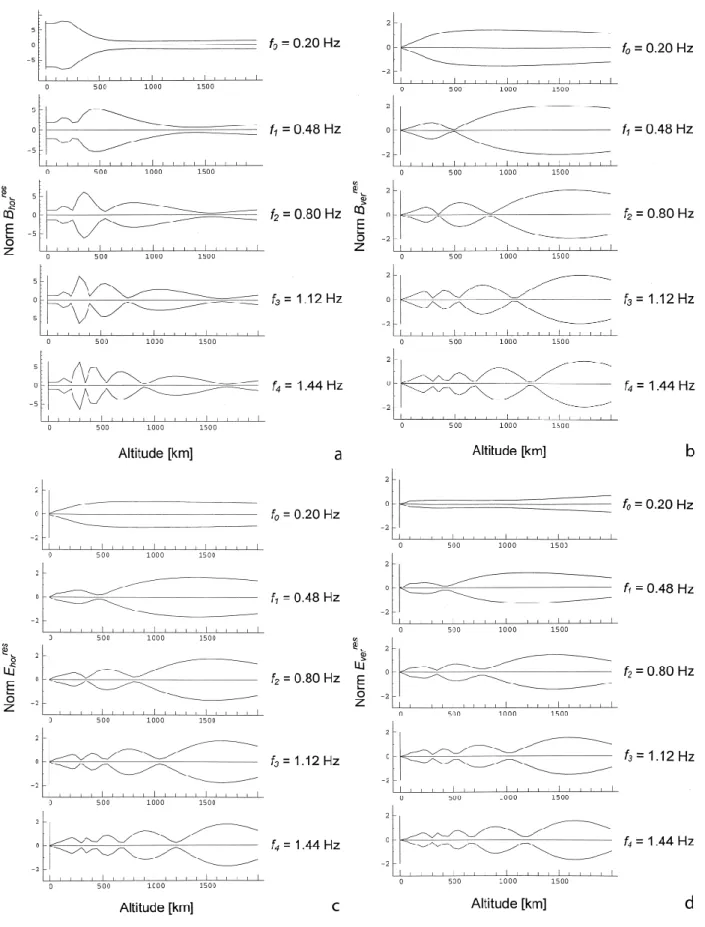
The normalized altitude profiles of the modeled wave magnetic (electric) horizontal and vertical components at fre-quencies f0−f4are shown in Figs. 5a and 5b (5c and 5d),
respectively. As above, we have assumed a field-aligned in-cident L|| mode wave at 10:30 UT. The profiles of all these
standing wave modes are highly non-monotonic in the verti-cal direction. The amplitudes of antinodes of Bhorincrease
with decreasing altitude down to about 300 km, which is op-posite to Bvert and both E-field components. Bhor maxima
(i.e. antinodes) correspond to minima (nodes) in Bvert and
vice versa. The nodes (antinodes) in Bvertcoincide with the
nodes (antinodes) in the both E-field components. Thus, Bhor
is the largest component in the F region. This is also true on the ground, where only Bhorhas a perceptible value. We have
also made calculations of the altitude profiles of the total Poynting vector for all harmonics using the method presented by Vagner (1982) and by Prikner and Vagner (1983, 1991). These calculations (not shown here) show that the normal-ized vertical component of the Poynting vector is practically constant in the whole ionosphere and always directed down-wards.
3 Discussion
3.1 Resonator properties
Geomagnetic conditions were very quiet during the morn-ing hours on 2 December 1999. At that time the EISCAT radar measured high electron densities around the F region maximum and a very smooth decrease in density at greater heights. These ionospheric conditions led to a formation of an ionospheric resonator with a fundamental frequency peak of about 0.20 Hz. This is significantly smaller than the funda-mental frequency of about 0.5 Hz found in our earlier study when a substorm process strongly decreased the resonator dimensions (Mursula et al., 2000; Prikner et al., 2000). The substorm effects on the ionosphere were discussed in terms of the formation of an ionospheric trough above the station observing an IPDP (Interval of Pulsations with Diminishing Period) wave event. The trough is formed during the sub-storm by enhanced electric currents which lead to a plasma outflow from the high altitude ionosphere and increase the O+density gradient. As a result of this outflow the IAR fun-damental frequency increases, in accordance with the
simul-Fig. 4. Calculated harmonic frequencies of the resonator (horizontal lines) and the observed frequencies of the Pc1 bands (vertical lines) at
KIL station on 2 December at 10:00–1100 UT. The calculations were carried out on the basis of the EISCAT data sampling intervals with
1T =5 min. The input parameters (incident L||mode wave and zmax=2000 km) are the same as in Fig. 3.
taneously observed increase in IPDP frequency. Moreover, the increase in fundamental frequency naturally leads to an increase in the harmonic frequencies. Thus, the harmonic frequencies during the substormrelated IPDP event studied by Mursula et al., 2000 were located above 1.5 Hz, while four harmonics were found below 1.5 Hz in the present case. During quiet geomagnetic conditions, as studied here, the plasma density decreases more slowly with altitude. Accord-ingly, such conditions give lower resonator frequencies than substorm conditions and quiet geomagnetic conditions favor the formation of multiband Pc1 pulsations on the ground, as indicated by the present study.
3.2 Multiband Pc1 pearls
As seen in Fig. 1, a multiband pearl Pc1 event was observed at IVA and KIL during about 30 min around 10:30 UT. The pearl bands were located at f2∼0.68 − 0.85 Hz, f3∼1.12 −
1.31 Hz and at f4−1.44 − 1.57 Hz. Pearls are the main
type of Pc1 pulsations at low- and mid-latitudes (e.g. Be-nioff, 1960), showing often a close connection to the plasma-pause (e.g. Fraser et al., 1989; Erlandson et al., 1992; Mur-sula et al., 2001). It is worthwhile to note here that the pearl structure is generated in the magnetosphere, and not in the ionosphere, for example due to the IAR operation. Conjugate studies where pearl events have been observed si-multaneously on the ground and in the magnetosphere con-firm the view that the pearl structure is indeed generated in the magnetosphere (Mursula et al., 2001). The traditional model assumes that pearls are due to a wave packet
bounc-ing between the opposite hemispheres (Jacobs and Watan-abe, 1964; Obayashi, 1965; Kenney and Knaflich, 1967). However, it has been found that the ionospheric reflection is very small (e.g. Erlandson et al., 1992; Mursula et al., 2000) while a rather strong amplification would be neces-sary in the source region in the standard bouncing model. According to an alternative model that has obtained more ob-servational evidence recently, long-period ULF waves (Pc3-5 pulsations) modulate the equatorial plasma, leading to repet-itive enhancements in the Pc1 intensity with a period of a modulating ULF wave (Rasinkangas et al., 1994; Plyasova-Bakounina et al., 1996; Mursula et al., 1997; Rasinkangas and Mursula, 1998; Mursula et al., 2000; Mursula et al., 2001). In this model, the classical tenet of the bouncing wave packet model, the roughly alternate appearance of packets in conjugate hemispheres, may be explained by antisymmet-ric ULF wave modes. Note also that the ULF modulation operates more effectively in a region of large plasma den-sity gradients. Therefore, both models naturally explain the well-known preferred occurrence of Pc1 pearls around the plasmapause (Mursula et al., 2001). However, it is clear that more studies, both by ground and satellite observations, are needed in order to re-examine these basic properties of pearl pulsations.
Let us next discuss the possible mechanisms producing the observed multiband pearls. A closer inspection of Fig. 1 shows that the pearl repetition period decreases with increas-ing band frequency. At about 10:20–10:45 UT, the average repetition periods for bands f2, f3and f4 are about 172 s,
av-648 K. Prikner et al.: An effect of the ionospheric Alfv´en resonator on multiband Pc1 pulsations
Fig. 5. The normalized altitude profiles of amplitudes of the magnetic field horizontal component Bhor(a), the vertical component Bver(b),
erage pearl dispersion around 10:30 UT for bands f2, f3
and f4is about 2300 s/Hz, 1000 s/Hz and 800 s/Hz,
respec-tively (zero meaning no dispersion). In the bouncing wave packet model, the decreasing repetition period with increas-ing frequency can be explained by a shorter path length at lower L shells, where a higher magnetic field intensity yields a higher ion gyrofrequency and, correspondingly, a higher Pc1 wave frequency. In the ULF modulation model, this is explained by the shorter ULF period at inner L shells. The increasing pearl slopes (smaller dispersion) with increasing frequency indicate, in both models, that the pearl dispersion has less time to evolve on shorter field lines of the inner L shells. Accordingly, these two observations suggest that the three pearl bands are due to an ionospheric ducting of Pc1 waves from multiple sources, with the f2(f4) band being
generated in the outermost (innermost) L shell. The formula Lp=5.6 − 0.46 Kpmax(where Kpmaxis the maximum Kp
in-dex in the preceding 24 h) by Carpenter and Anderson (1992) gives an approximate plasmapause location Lp ∼4.7 in the
present case. This suggests that the source producing the pearl bands is situated at equatorial latitudes lower than KIL (L = 6.0) and IVA (L = 5.6).
On the other hand, multiband Pc1 activity can also be pro-duced by magnetospheric heavy ions (mainly He+and O+). Dynamic spectra of Pc1 waves often show a gap in spectral power just above each heavy ion gyrofrequency (Mauk et al., 1981; Young et al., 1981; Kozyra et al., 1984). Theoretically, the wave growth is divided into separate branches divided by heavy ion gyrofrequencies. Assuming that the source con-taining heavy ions is located around L = 4.5 − 5.0, the ap-proximate values of the equatorial H+, He+and O+
gyrofre-quencies in this L range vary for H+from 5.4 Hz to 3.9 Hz, for He+from 1.3 Hz to 1.0 Hz, and for O+ from 0.3 Hz to 0.2 Hz. Since the frequencies of all three pearl bands are much higher than the calculated O+gyrofrequency in this L shell range, O+ions were not able to produce any of these bands. (If the lowest band f2 were produced by O+, the
source should be at L<3.5, which is unrealistically far in-side from the estimated plasmapause.) Assuming that the source region is located around L∼5, the f2band could then
be produced by He+ ions and the f3and f4 bands by H+
ions. On the other hand, if the source region is around L
∼4.5, the f2 and f3 bands could be produced by He+ and
f4by H+ions. This implies that in this scenario both He+
and H+ions would have been involved in the generation of
the three bands. However, since the pearl repetition period and dispersion systematically correlate with band frequency, which cannot easily be explained in terms of heavy ions, we conclude that the multiband structure is probably due to the ionospheric ducting of waves from a radially wide multifre-quency source in the equatorial magnetosphere. In order to fully solve the origin of this multiband event, satellite mea-surements of Pc1 waves would be needed from the equatorial magnetosphere (see related observations for another multi-band Pc1 event in Mursula et al., 2001).
3.3 Correspondence of resonator harmonics and pearl Pc1 frequencies
Assuming a dipole field and using the observed wave fre-quencies we can calculate the L shell of band f2to be some
20% larger than that of band f4. However, due to the
con-vergence of field lines this implies an ionospheric distance of about 300 km between the footpoints of these waves. Taking into account the extremely quiet conditions, we can therefore neglect the latitudinal change of the ionosphere and use the same model ionosphere for all three wave bands. Moreover, the small difference in the wave inclination angle for calcu-lations can be neglected (it does not affect substantially the transmission coefficient spectra).
As depicted in Fig. 4, the frequencies of the three Pc1 bands were found to coincide well with the resonator har-monics f2−f4during most of the one-hour interval studied.
This indicates that the resonator can act as a band-pass fil-ter, determining the frequencies of Pc1 waves that can prop-agate to the ground. This result is in qualitative agreement with our earlier studies (Mursula et al., 2000; Prikner et al., 2001, 2002), where we found that the Pc1/IPDP frequency on the ground corresponds to the fundamental frequency of the resonator. However, there the resonator harmonics did not appear because of the effect of substorm activity on the resonator.
Further evidence for the possible resonator effect can be seen in Fig. 1. As already mentioned above, the Pc1 in-tensity during the one-hour interval is not the same over the band. This is true for both stations and all three bands. The high-frequency (∼0.8 Hz) part of the f2band is significantly
stronger than the low-frequency (∼0.7 Hz) part. In contrast, in the case of the f3(f4)band, the low-frequency ∼1.15 Hz
(∼1.45 Hz) part of the band is more intense than the high-frequency ∼1.3 Hz (∼1.55 Hz) part. This indicates that the resonator suppresses that part of the band whose frequency significantly differs from the respective harmonic frequency. Also, the weakness of the unstructured band at about 0.6 Hz may be due to the fact that its frequency is only partly coin-cident with the IAR f1frequency.
According to the bouncing wave packet hypothesis, pearl Pc1 waves can only grow at those frequencies where the ionospheric reflection coefficient (RC) has a maximum (e.g. Belyaev et al., 1984, 1987; Feygin et al., 1994). However, as shown above, the frequencies of all the three pearl bands correspond to a maximum of the modelled transmission efficient and, therefore, to a minimum of the reflection co-efficient. This gives further evidence to support our earlier view (Mursula et al., 2000), that the pearl generation can-not be explained in terms of the traditional bouncing wave packet model. Calculations (not shown here) indicate that even considerable changes in heavy ion concentration and slope of the exponential decrease of Niabove 600 km do not
significantly change the frequency spectra of TC and RC. In order to make a more detailed analysis, ionospheric (EIS-CAT) measurements up to about 2000 km during a Pc1 event would be helpful.
650 K. Prikner et al.: An effect of the ionospheric Alfv´en resonator on multiband Pc1 pulsations
3.4 Normalized vertical profiles of wave characteristics
As observed in Fig. 5, all the wave modes are highly non-monotonic with altitude, because of the nearly exponential decrease of electron density above the F-region peak. At the fundamental frequency f0≈0.20 Hz, the amplitude of Bhor
(Fig. 5a) exhibits a maximum at low altitudes and a mini-mum at high altitudes. This suggests that the resonator has a quarter-wave character at the fundamental frequency. Also, the four harmonics f1−f4correspond to the odd multiples
of the theoretical fundamental frequency of 0.16 Hz. Such shifts in harmonic frequency are in accordance with ear-lier studies (see, e.g. Cummings et al., 1969; Takahashi and McPherron, 1982; Lysak, 1993, 1999), and a quarter-wave type nature of the resonator.
Figures 5b–d also show that the normalized amplitude of antinodes of Bvert and both E components decrease toward
the Earth, which is seen at the fundamental frequency, as well as at the higher harmonics. On the other hand, Bhor
(Fig. 5a) always has a maximum around the altitude of the F-region peak. This is in agreement with our earlier results when studying wave characteristics at the fundamental fre-quency (Prikner et al., 2000). This indicates that the great-est wave amplification takes place around F-region heights. It is important to note that only the Bhor component has a
significant value on the ground, reflecting the common view that ground-based signatures of Pc1 events are due to this component. The remarkable decrease of Bvertand the two
E-field components towards the ground is a consequence of in-creasing electric conductivity towards the lower ionosphere, in particular of the highly conducting E–F1 layer.
4 Conclusions
The ionospheric Alfv´en resonator (IAR) is known to affect ground-based Pc1 pulsation activity, favoring transmission of waves whose frequency coincides with the first maximum of the transmission coefficient, i.e. to the resonator’s funda-mental frequency. In this paper we have studied the resonator properties when magnetometer stations in northern Finland registered three simultaneous bands of Pc1 pearls. We found that the frequencies of the observed pearl bands (f2∼0.8 Hz,
f3∼1.2 Hz and at f4∼1.45 Hz) coincided very well with the
third, fourth and fifth maximum of the transmission coeffi-cient spectrum, i.e. with the respective higher harmonic fre-quencies of the resonator. Furthermore, we found that the wave intensity within each band decreased when the wave frequency deviated from the respective harmonic frequency of the resonator. This gives further evidence for the possi-bility that the resonator favors wave transmission at selected frequencies (frequency windows), and suggests that it can af-fect incident Pc1 waves over a notably large frequency range. Since the pearl frequencies were found to correspond to the maxima of the transmission coefficient and minima of the reflection coefficient, the present results do not support the traditional bouncing wave packet model, which assumes that
pearls grow at frequencies where the ionospheric reflection has a maximum.
Acknowledgements. J. K., R. K. and K. M. gratefully acknowledge
the financial support by the Academy of Finland. F. Z. F. acknowl-edges the financial support by the Commission of the European Union (research grant INTAS99-0335) and the Russian Fund for Basic Research (research grants 02-05-64610 and 02-05-64612). K. P. thanks T. B¨osinger, J. Manninen and J. Kultima for mag-netic data, and R. Kuula for EISCAT data. K. P. acknowledges also the financial support of the EU’s 5th Frame Programme un-der the IHP Programme (contract HPRI200100132). The EISCAT Scientific Association is supported by the Suomen Akatemia of Fin-land, Centre National de la Recherche Scientifique, France, Max-Planck Gesellschaft, Federal Republic of Germany, National In-stitute of Polar Research of Japan, Norges Almenvitenskapelige Forskningsrad of Norway, Naturvetenskapliga Forskningsradet of Sweden, and the Science and Engineering Research Council of the United Kingdom.
Topical Editor M. Lester thanks M. Engebretson and D. Wright for their help in evaluating this paper.
References
Belyaev, P. P., Polyakov, S. V., Rapoport, V. O., and V. Y. Trakht-engertz: The fine structure of the radiation of an Alfv´en maser, Geomagn. Aeron., 24, 202–205, 1984.
Belyaev, P. P., Polyakov, S. V., Rapoport, V. O., and Trakhtengertz, V. Y.: The formation of the dynamic spectra of geomagnetic pul-sations in the Pc1 range, Geomagn. Aeron., 27, 561–564, 1987. Benioff, H.: Observations of geomagnetic fluctuations in the period
range 0.3 to 120 seconds, J. Geophys. Res, 65, 1413–1422, 1960. Carpenter, D. L. and Anderson, R. R.: An ISEE/Whistler model of equatorial density in the magnetosphere, J. Geophys. Res., 97, 1097–1108, 1992.
Cummings, W. D., O’Sullivan, R. J., and Coleman, Jr., P. J.: Stand-ing Alfv´en waves in the ionosphere, J. Geophys. Res., 74, 778– 793, 1969.
Erlandson, R. E., Anderson, B. J., and Zanetti, L. J.: Viking mag-netic and electric field observations of periodic Pc1 waves: Pearl pulsations, J. Geophys. Res., 97, 14 823–14 832, 1992.
Feygin, F. Z., Nekrasov, A. K., Mursula, K., Kangas, J. and Pikkarainen, T.: Coherent multiple Pc1 pulsation bands: Pos-sible evidence for the ionospheric Alfv´en resonator, Ann. Geo-phys., 12, 147–151, 1994.
Fraser, B. J., Kemp, W. J., and Webster, D. J.: Ground-satellite study of a Pc1 ion cyclotron wave event, J. Geophys. Res., 94, 11 855–11 863, 1989.
Greifinger, C. and Greifinger, P.: Theory of Hydromagnetic propa-gation in the ionospheriv waveguide, J. Geophys. Res., 73, 7473– 7490, 1968.
Jacobs, J. A. and Watanabe, T.: Micropulsation whistlers, J. Atmos. Terr. Phys., 26, 825–829, 1964.
Kenney, J. F. and Knaflich, H. B.: A systematic study of structured micropulsations, J. Geophys. Res., 72, 2857–2869, 1967. Kerttula, R., Mursula, K., Pikkarainen, T., and Kangas, J.:
Storm-time Pc1 activity at high and middle latitudes, J. Geophys. Res., 106, 6213–6227, 2001.
Kozyra, J. U., Cravens, T. E., Nagy, A. F., Fontheim, E. G., and Ong, R. S. B.: Effects of energetic heavy ions on
electromag-netic ion cyclotron wave generation in the plasmapause region, J. Geophys. Res., 89, 2217–2233, 1984.
Lysak, R. L.: Feedback instability of the ionospheric resonant cav-ity, J. Geophys. Res., 96, 1553–1568, 1991.
Lysak, R. L.: Generalized model of the ionospheric Alfv´en res-onator, in: Auroral Plasma Dynamics, AGU, Geophysical Mono-graph, 80, 121–128, 1993.
Lysak, R. L.: Propagation of Alfv´en waves through the ionosphere: dependence on ionospheric parameters, J. Geophys. Res., 104, (A5), 10 017–10 030, 1999.
Mauk, B. H., McIlwain, C. E., and McPherron, R. L.: Helium cy-clotron resonance within the Earth’s magnetosphere, Geophys. Res. Lett., 8, 103, 1981.
Mursula, K., Rasinkangas, R., B¨osinger, T., Erlandson, R. E., and P.-A. Lindqvist: Nonbouncing Pc1 wave bursts, J. Geophys. Res., 102, 17 611–17 624, 1997.
Mursula, K., Prikner, K., Feygin, F. Z., Br¨aysy, T., Kangas, J., Kert-tula, R., Pollari, P., Pikkarainen, T., and Pokhotelov, O. A.: Non-stationary Alfv´en resonator: new results on Pc1 pearls and IPDP events, J. Atmos. Sol.-Terr. Phys., 62, 299–309, 2000.
Mursula, K., Br¨aysy, T., Niskala, K., Mozer, F., and Russell, C. T.: Pc1 pearls revisited: Structured electromagnetic ion cyclotron waves on Polar satellite and on ground, J. Geophys. Res., 106, 29 543–29 553, 2001.
Obayashi, T.: Hydromagnetic whistlers, J. Geophys. Res., 70, 1069–1078,1965.
Plyasova-Bakounina, T. A., Kangas, J., Mursula, K., Molchanov, O. A., and Green, A. W.: Pc 1-2 and Pc 4-5 pulsations observed at a network of high-latitude stations, J. Geophys. Res., 101, 10 965– 10 973, 1996.
Polyakov, S. V. and Rapoport, V. O.: Ionospheric Alfv´en resonator, Geomagn. Aeron., 21, 610–614, 1981.
Prikner, K., Mursula, K., Feygin, F. Z., Kangas, J., Kerttula, R., Pikkarainen, T., Pokhotelov, O. A., and Vagner, V.: Non-stationary Alfv´en resonator: vertical profiles of wave character-istics, J. Atmos. Sol.-Terr. Phys., 62, 311–322, 2000.
Prikner, K., Mursula, K., Kangas, J., and Feygin, F. Z.: Ionospheric Alfv´en resonator control over the frequency-variable Pc1 event in Finland on May 14, 1997, Studia Geoph. et Geod., 45, 363– 381, 2001.
Prikner, K., Mursula, K., Kangas, J., Feygin, F. Z., and Kerttula, R.: Numerical simulation of the high-latitude non-stationary iono-spheric Alfv´en resonator during an IPDP event, Studia Geoph. et Geod., 46, 507–526, 2002.
Prikner, K. and Vagner, V.: Numerical modelling of the ionospheric filtration of ULF micropulsation signal, Studia Geoph. et Geod., 27, 173–190, 1983.
Prikner, K. and Vagner, V.: Numerical solution to the problem of ionospheric filtration of ULF waves in the Pc1 range. The total wave field inside the ionospheric transition layer, Studia Geoph. et Geod., 35, 90–99, 1991.
Rasinkangas, R., Mursula, K., Kremser, G., Singer, H. J., Fraser, B. J., Korth, A., and Hughes, W. J.: Simultaneous occurrence of Pc5 and Pc1 pulsations in the dawnside magnetosphere: CRRES observations, in: Solar-wind Sources of Magnetospheric Ultra-Low-Frequency Waves, Geophysical Monograph, 81, 417–424, edited by Engebretson, M. J., Takahashi, K., and Scholer, M., AGU, 1994.
Rasinkangas, R. and Mursula, K.: Modulation of magnetospheric EMIC waves by Pc 3 pulsations of upstream origin, Geophys. Res. Lett., 25, 869–872, 1998.
Takahashi, K. and McPherron, R. L.: Harmonic structure of Pc3-4 pulsations, J. Geophys. Res., 87 (A3), 1504–1516, 1982. Vagner, V.: Numerical solution of ionospheric filtration of ULF
waves (Part 1 – Method), Travaux G´eophysiques, XXX (No 575), 199–229, 1982.
Young, D. T., Perraut, S., Roux, A., de Villedary, C., Gendrin, R., Korth, A., Kremser, G., and Jones, D.: Wave-particle interac-tions near +He observed on GEOS 1 and 2 1. Propagation of ion cyclotron waves in He+-rich plasma, J. Geophys. Res., 86, 6755–6772, 1981.