HAL Id: insu-00828179
https://hal-insu.archives-ouvertes.fr/insu-00828179
Submitted on 10 Jun 2013
HAL is a multi-disciplinary open access archive for the deposit and dissemination of sci-entific research documents, whether they are pub-lished or not. The documents may come from teaching and research institutions in France or abroad, or from public or private research centers.
L’archive ouverte pluridisciplinaire HAL, est destinée au dépôt et à la diffusion de documents scientifiques de niveau recherche, publiés ou non, émanant des établissements d’enseignement et de recherche français ou étrangers, des laboratoires publics ou privés.
Alexandre Boisson, Pietro de Anna, Olivier Bour, Tanguy Le Borgne, Thierry
Labasque, Luc Aquilina
To cite this version:
Alexandre Boisson, Pietro de Anna, Olivier Bour, Tanguy Le Borgne, Thierry Labasque, et al.. Re-action chain modeling of denitrification reRe-actions during a push-pull test. Journal of Contaminant Hydrology, Elsevier, 2013, 148, pp.1-11. �10.1016/j.jconhyd.2013.02.006�. �insu-00828179�
ACCEPTED MANUSCRIPT
1
Reaction chain modeling of denitrification reactions during a push pull test
Boisson A1,2,*., de Anna P1,3., Bour O1., Le Borgne T1., Labasque T1., and Aquilina L1.
1
Géosciences Rennes-OSUR, UMR CNRS 6118, University of Rennes 1, France
2
Now at BRGM, D3E/NRE, Indo-French Centre for Groundwater Research, Hyderabad, India
3Now at Massachusetts Institute of Technology, MA, USA
*Corresponding author.
E-mail adress: [email protected] (A.Boisson)
Abstract
Field quantitative estimation of reaction kinetics is required to enhance our understanding of biogeochemical reactions in aquifers. We extended the analytical solution developed by Haggerty et al. (1998) to model an entire 1st order reaction chain and estimate the kinetic parameters for each reaction step of the denitrification process. We then assessed the ability of this reaction chain to model biogeochemical reactions by comparing it with experimental results from a push pull test in a fractured crystalline aquifer (Ploemeur, French Brittany). Nitrates were used as the reactive tracer, since denitrification involves the sequential reduction of nitrates to nitrogen gas through a chain reaction (NO3- → NO2- → NO →N2O → N2) under anaerobic conditions. The kinetics of nitrate
consumption and by-products formation (NO2- , N2O) during autotrophic denitrification were quantified by using
a reactive tracer (NO3-) and a non-reactive tracer (Br-). The formation of reaction by-products (NO2-, N2O, N2)
has not been previously considered using a reaction chain approach. Comparison of Br- and NO3
breakthrough curves showed that 10 % of the injected NO3- molar mass was transformed during the 12 hour experiment (2%
into NO2
-, 1% into N2O and the rest into N2 and NO). Similar results, but with slower kinetics, were obtained
from laboratory experiments in reactors. The good agreement between the model and the field data shows that the complete denitrification process can be efficiently modeled as a sequence of first order reactions. The 1st order kinetics coefficients obtained through modeling were as follows: k1= 0.023 h-1, k2= 0.59 h-1, k3= 16 h-1, k4= 5.5 h-1. A next step will be to assess the variability of field reactivity using the methodology developed for modeling push-pull tracer tests.
ACCEPTED MANUSCRIPT
2
1. Introduction
Predicting reactive transport remains a challenge in hydrogeology. Within this field, the reduction of nitrates by denitrification (Korom, 1992; Mariotti, 1986) is common in soil and groundwater since the use of fertilizers in modern agriculture has led to high nitrate concentrations in aquifers. Understanding the kinetics of denitrification is important for determining the attenuation of nitrate concentrations in aquifers and for management. Denitrification is the sequential reduction of nitrates to nitrogen gas which occurs under anaerobic conditions and can be represented as the following chain reaction (Betlach and Tiedje, 1981):
NO3- (aq) NO2- (aq) NO(gas) N2O(gas) N2(gas) (1)
Various studies involving batch experiments and column experiments have been used to quantify the reaction kinetics at the laboratory scale ( Amirbahman et al., 2003; Postma and Appelo, 2000; Vongunten and Zobrist, 1993). However, due to the difficulties of reproducing natural conditions in laboratory experiments as well as the scale effects related to physical heterogeneity (Dentz et al., 2011), field measurements are required to quantify reactive transport at the field scale. Thus different experimental setups have been developed to quantify denitrification reactions in the field using borehole networks (McAllister and Chiang, 1994), isotopic characterization (Otero et al., 2009, Pauwels et al., 2010), tracer tests (Pauwels et al., 1998) and push-pull tests ( Addy et al., 2002; Istok et al.,1997; Kim et al., 2005; McGuire et al., 2002).
However, these reactions are often studied on very small time scales (hours in the case of push-pull tests). In experiments of short duration and under dynamic conditions, the reactions are often incomplete and lead to the formation of by-products, such as nitrites and nitrous
ACCEPTED MANUSCRIPT
3 oxide in the case of nitrate reduction. Knowledge of the kinetics of nitrate consumption and by-products production is essential to better understand these biogeochemical reactions.
To tackle this problem we developed a model of the entire denitrification chain reaction and compared it with field measurements. Our aim was to provide a framework which allowed assessment of the complete chain reaction. Nitrate degradation in natural media has already been modeled as a first order degradation process (Knowles, 1982; Pauwels et al., 1998 ). Analytical solutions for first order chain reactions have already been developed but generally require knowledge of the transport properties of the medium (Bauer et al., 2001; Quezada et al., 2004). However, as suggested by Haggerty et al. (1998), the first order reaction rate can be determined from push pull tests using a simplified analytical solution without direct knowledge of the physical properties of the aquifer. Such a solution is very useful in the case of push pull tests since this kind of experiment does not require knowledge of physical parameters such as porosity and limited information about transport is available without further experiments. Following Haggerty et al. (1998), we developed a semi-analytical solution to model nitrate reduction and by-products formation through a first order chain reaction. Field and laboratory experiments were then conducted to assess its reliability for predicting by-products formation.
Most field studies have been focused on aquifers contaminated by hydrocarbons i.e. heterotrophic denitrification since the hydrocarbons are used as carbon sources (Cozzarelli et al., 1999; Schroth et al., 1998; Vandenbohede et al., 2008). However denitrification may also have an important role in zones of intensive agriculture with low organic carbon contents, as in the crystalline aquifers of French Brittany (Aquilina et al., 2012; Tarits et al., 2006). In the case of the Ploemeur aquifer (Brittany, France), it has been shown that due to the very low carbon content, heterotrophic denitrification is negligible but that nitrate reduction occurs via microbial autotrophic denitrification with pyrite following Eq.(2 & 3) (Tarits et al., 2006):
ACCEPTED MANUSCRIPT
4 5 FeS2 + 14 NO3- + 4 H+ 7 N2 + 10 SO42- + 2 H2O + 5 Fe2+ (2)
5 Fe2+ + NO3- + 7 H2O 5 FeOOH + ½ N2 + 9 H+ (3)
Although this reaction can occur under abiotic conditions, it is very slow under such conditions (Weber et al., 2001). In aquifers the reaction rate is controlled in part by the repartition and development of microbial populations (Philippot et al., 2009). Autotrophic denitrification has been studied in various countries of western Europe, namely in sandy aquifers in the Netherlands (Miotliński, 2008; Postma et al., 1991; Zhang et al., 2012; Zhang et al., 2009) or Spain (Otero et al., 2009), in limestone aquifers in France (Mariotti et al., 1988) or England (Hiscock et al., 2003; Muhlherr and Hiscock, 1998;), in gravel and sandy aquifers in Germany (Fukada et al., 2003, Weymann et al., 2008) but very few studies have been conducted to assess the kinetics of autotrophic denitrification in fractured crystalline media (Pauwels et al., 1998; Tarits et al., 2006). Therefore, our second objective was to quantify autotrophic denitrification in a fractured crystalline aquifer. This was done through laboratory tests and in situ push pull test experiments. In highly heterogeneous media it is clear that push-pull tests can only provide a local evaluation of the reaction kinetics. However, compared to classical tracer tests, they allow denitrification to be measured on a field scale with good tracer recovery.
Among the various by-products Eq.(1), the formation of nitrous oxide, a major greenhouse gas, has been largely studied in aquifers and sediments (Mosier et al., 1998). Measurements of denitrification, including those of the by-products, are difficult to obtain as the gases produced, mainly N2 and to a lesser extent N2O, are already present in the natural
environment. Different methods have been used to quantify this production, ranging from laboratory experiments ( Laverman et al., 2010; Silvennoinen et al., 2008) to the aquifer scale (Hiscock et al., 2003; Muhlherr and Hiscock, 1998; Weymann et al., 2008). These studies provided reliable results but few of them were able to quantify nitrous oxide formation on the
ACCEPTED MANUSCRIPT
5 field scale from an accurately known input of nitrate into the system (Addy et al., 2002; Kim et al., 2005; Weymann et al., 2008). Moreover, to our knowledge, no field scale experiment has been carried out to quantify the production of nitrous oxide from autotrophic denitrification, which was the third objective of this study.
In the first section, we present the experimental setups, and the modeling approach developed. We then describe the results obtained in the field and the laboratory, which were used in the model to determine kinetic parameters.
2. Material and methods
2.1. Site presentation
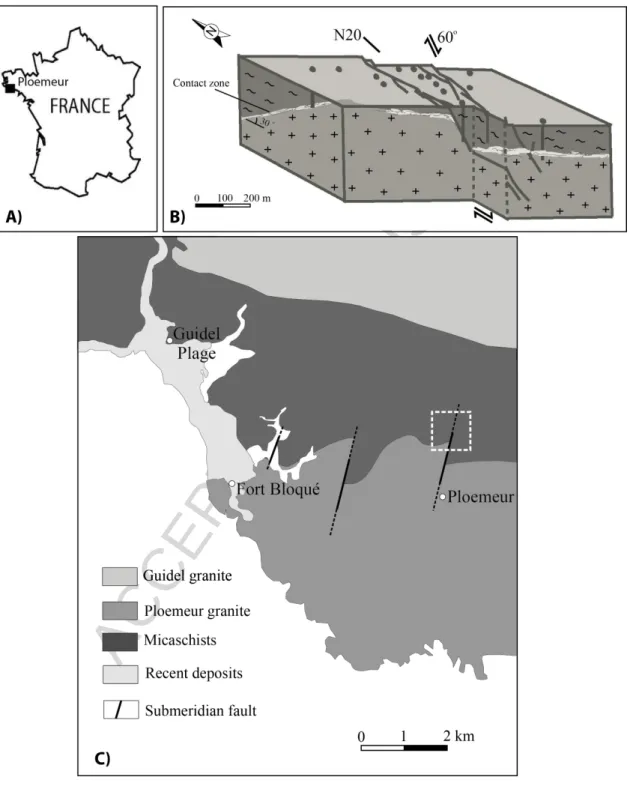
The crystalline rock aquifer of Ploemeur is the main source of tap water for the town of Ploemeur (18 000 hab) with an annual water production rate of about 1.106 m3/year since
1991. The pumping site and the productive boreholes are located at the contact zone between the Ploemeur granites and the overlying micaschists (Fig. 1) (Touchard, 1999). This contact zone, which dips moderately to the north (around 30°) consists of alternating deformed granitic sheets (including mylonites and pegmatite-bearing breccias) and enclaves of micaschists, pegmatite and aplite dykes, as well as quartz veins (Ruelleu et al., 2010). Flow in this geological media is highly heterogeneous and localized in a limited number of fractures at depths ranging between 40 and 150 m within the pumping site (Le Borgne et al., 2006). Deformation and permeability may be locally enhanced by a steeply dipping fault striking North 20°, with combined dextral strike-slip and normal components (Fig. 1). It should be noted that boreholes drilled only in the Ploemeur granite (south of the contact zone) or only in the micaschists (north of the contact zone) were mostly unproductive.
ACCEPTED MANUSCRIPT
6 About 60% of the watershed surface is devoted to agriculture, which results in nitrate concentrations that vary between 40 and 120 mg/L in most of the boreholes around the pumping site. However, the nitrate concentrations in the pumping well remained below 5 mg/L. Due to pumping within the area (Le Borgne et al., 2006; Leray et al., 2012), a mixing of different chemical water groups may also occur in the Ploemeur site (Fig. 1b). Previous studies (Tarits et al., 2006) revealed the occurrence of a microbial autotrophic denitrification reaction related to fractures containing pyrite but the reaction kinetics have not been quantified.
To avoid any influence from the pumping site and any contamination of the pumped water, the push-pull test was carried out at an experimental site located 3 km away in the same geologic and hydrogeologic conditions (Fig. 1c). This secondary site consisted of four boreholes 70 to 100 m deep. All four boreholes were located within a very small area (12 x 3 m) to facilitate the tracer and push-pull tests. This site is very similar to another nearby experimental site that has been described in detail in Le Borgne et al. (2007). The lithologies consist mainly of fractured and deformed micaschists, but pegmatites and aplites may be encountered locally. Although the boreholes are very close to each other, the site is highly heterogeneous with variable transmissivity from the different boreholes (mean transmissivity 2.10-4 m/s). Water level measurements did not reveal any gradient between the different
boreholes. The low gradient and low permeability imply that flow between the different boreholes is very slow. The site was characterized by performing a set of pumping tests within the different screened boreholes and by carrying out single and cross borehole flowmeter tests using an impeller and a heatpulse flowmeter (Molz et al. 1994; Paillet, 1998). In addition, a multi-parameter probe TROLL 9500 (WinSitu) was used for temperature, conductivity, dissolved oxygen, Eh and pH logging. Water chemistry measurements,
ACCEPTED MANUSCRIPT
7 including CFC analysis, were also obtained from the different boreholes at different depths and times.
The F26 borehole, which is characterized by a single fracture zone at 64 m depth, was selected for the push-pull test. The concentration of dissolved oxygen in the entire water column was below 250 µg/L (probe detection limit). No nitrates or nitrites were observed in this borehole before the experiment. Continuous monitoring of the Ploemeur site (de Dreuzy et al., 2006; Tarits et al., 2006) revealed that this borehole was characterized by a very low NO3- concentration with the occasional occurrence of NO2- whereas the NO3- concentrations
in some surrounding boreholes were maintained at around 40 mg/L. This indicates that NO3
-reduction occurs naturally in the aquifer in the vicinity of this well. 2.2. Push pull test design
A push-pull test consists of the injection of a known tracer solution in a single monitoring well followed by the extraction of the solution mixed with groundwater from the same well (Becker and Shapiro, 2003; Gouze et al., 2008; Haggerty et al., 2001; Istok et al., 1997; Le Borgne and Gouze, 2008; Meigs and Beauheim, 2001; Tsang, 1995). This push-pull method does not provide direct information about medium parameters such as porosity or the water rock interaction surface. Indeed, porosity and dispersivity cannot be determined from a push-pull test as the flow field is reversed in the middle of the experiment (Altman et al., 2002; Gouze et al., 2008; Haggerty et al., 2001). The breakthrough curve obtained during a push-pull experiment is controlled by irreversible dispersion which includes i) diffusion and its interaction with small-scale heterogeneities, ii) fracture matrix mass transfer and iii) mixing and reactivity (Le Borgne and Gouze, 2008).
The tracer solution was composed of 1425 mg/L Br- (KBr, Fisher scientific – Laboratory
ACCEPTED MANUSCRIPT
8 The tracer solution was injected at a flow rate of 1 m3/h for 15 min followed by a 55 min
injection of water pumped from another borehole containing no nitrate or nitrite and with an oxygen concentration below 0.5 mg/L. These conditions were required to ensure the anaerobic conditions necessary for denitrification. We also checked that pumping in the borehole did not influence the water levels and flow conditions in the injection borehole. A resting time of 70 min was respected to allow tracer diffusion in the medium before back-pumping the tracer solution for 10 hours. This procedure led to a maximum residence time of about 12 hours for the tracer solution within the aquifer.
2.3. Borehole monitoring
The investigated borehole (F26) was 220 mm in diameter and screened from 45 to 79 m. The water level was at 3.9 m bgs. The injection was done at 64 m depth within the fractured zone. A multi-parameter probe TROLL 9500 (WinSitu), located at 50 m depth in the borehole, was used to measure O2, Eh, pH, conductivity and temperature. A borehole spectrophotometer
(SCAN Spectrolyser), located at 55 m depth, allowed in situ continuous monitoring of the nitrate concentrations within the borehole between the pump and the flow zone. Water sampling and chemical analyses of the pumped water were also carried out. The spectrophotometer had been developed for in situ borehole monitoring to a depth of 100 meters. A specific calibration curve was determined. The pump (Grundfos MP1) used for tracer recovery was located at 40 m depth and the pumping rate was 1 m3/h, similar to the
injection rate. Since no fractures are present between 40 and 64 m depth difference between injection and recovery depth does not affect significantly the breakthrough curves. In addition, a pressure sensor (STS DLN 70) was placed at 10 meters depth in the injection borehole and in nearby boreholes.
ACCEPTED MANUSCRIPT
9 2.4. Laboratory experiments: reactors
To compare our field results with those of laboratory experiments, the reaction was also assessed using batch reactors. These experiments were conducted in order to 1) assess the reaction in a non-dynamic and controlled medium, 2) to compare laboratory kinetics with field results as few data were available. The reactors were filled with crushed granite (200 g, average size 0.6 mm) and untreated site water (400 mL) pumped from the injection well F26. As there was no poisoning, the microbial population naturally present in the water was expected to develop and to catalyze the reaction. Rocks were collected from core drilling of a borehole (at 60 m depth) located on the Ploemeur site 3 km away and crushed in the laboratory. Previous laboratory experiments involving samples of either granite or micaschist had given similar results in terms of reactivity and reaction kinetics. The low oxygen concentration (below 0.4 mg/L) in the water in the batch reactors was kept constant. The reactors consisted of 500 ml glass bottles closed with a plastic septum to allow sampling with a syringe. The bottles were purged with argon and kept under an argon atmosphere (gas headspace of 100 mL). A nitrate solution made from NaNO3 powder (Fisher Scientific –
Laboratory reagent grade) was injected to obtain an initial concentration of 37.5 mg/L in the reactor at the beginning of the experiment. The reactors were set up in triplicate and no relevant differences were observed between replicates. The reactors were analyzed for anions once a day and every two days for cations, organic and inorganic carbon. Gases (N2O) were
not measured due to the large volume needed for the analyses (500 mL). The experiments were run for 815 hours.
2.5. Analytical methods
Before analysis, the anions, carbon and cations samples were filtered through a 0.2 µm Sartorius filter. The major anions (NO3-, Br-, SO42-, Cl-, F-) were analyzed using a Dionex DX
ACCEPTED MANUSCRIPT
10 120 ion chromatograph. Organic and inorganic carbons were analyzed using a Shimadzu 5050A Total Organic Carbon analyzer (detection limit 400 ppb). The volume required for the analyses was 5 mL. The uncertainty for the anion measurements was 4%. Cations were analyzed by ICPMS (HP 4500) after acidification with nitric acid. Gases were obtained by headspace equilibrium, extraction and analyzed by µGC/TCD (Agilent Micro GC3000 (SRA Instruments)). This method and the use of large volumes (500mL) for the analyses allowed an uncertainty of 5% for the nitrogen gases (N2O; N2).
2.6. Model development
The different reaction coefficients and the consistency of nitrate consumption and by-products formation were then estimated by testing the applicability of a model based on the following chain of 1st order reactions:
(4)
This model of chain kinetics was based on the analysis presented by Haggerty et al. (1998) for quantifying reactive push-pull tests. This reaction can be considered as irreversible under the studied conditions with very low oxygen content. The main advantages of the model were that: i) it allowed estimation of the reaction rate coefficient; ii) it was not dependent on the aquifer parameters since breakthrough curves do not depend on porosity or permeability and iii) it did not require a use of solutions for flow and transport (numerical or analytical). Two basic hypotheses were assumed. All the injected chemicals were locally well mixed and the retardation factors were the same for all tracers in the push-pull test.
The breakthrough curve of the conservative tracer concentration provides an estimate of the dilution of the injected solutions. The relative concentrations of the conservative and reactive tracer are given by:
ACCEPTED MANUSCRIPT
11
(5)
where and are the initial concentrations of the reactive and the conservative
tracers injected in the well; and and the concentrations of reactive and conservative tracers that are measured during the extraction phase (Jury and Roth, 1990). Since the chain reaction also takes place during the injection phase, this effect also needs to be taken into account. For an injection time tinj at a constant injection flow rate Qinj, the nitrate
concentration after the injection is given by:
(6)
where the constant A depends only on the constant of reaction k1, the injection time and the
initial concentration ratio and is given by:
(7)
Eq. (6) can then be used to provide a semi-analytical estimation of the concentrations of the by-products of the chain reaction in Eq. (4). The evolution of all by-products over time was obtained by applying the following reasoning. The concentration evolution of a given product with time is the result of competition between its production from previous by-products in the chain, and its consumption. Both terms, production or degradation, are characterized by a reaction constant ki (i=2,3,4) so that a non-homogeneous ordinary
ACCEPTED MANUSCRIPT
12
(8)
where the general solution is given by
(9)
and Gi is an integration constant fixed by the initial concentration of the i-th species. The
production term for the i-th species is given by Eq. (9). In accordance with Haggerty et al. (1998), in Eq (6) we considered the bromide concentration as a dilution coefficient. Therefore the bromide concentration did not have to be integrated over time to find the analytic solution for the chain reaction. We thus defined a relative concentration as:
(10)
By solving the kinetics for this redefined relative concentration, the concentrations could be recovered by multiplying the relative concentration by the bromide concentration. We thus obtained for the different chemical components of the chain:
(11)
(12)
(13)
ACCEPTED MANUSCRIPT
13
(15)
(16)
For N2, which is the result of the whole denitrification chain, there is no degradation and N2 is
solely dependent on a production term:
(17)
which leads to
(18)
with
(19)
For the fitting procedure, we adopted a standard approach to estimate the parameters of the model from the field data which minimized the sum of squared residuals, a residual being the difference between an observed value and the fitted value provided by a model. In our case 4 parameters needed to be estimated, namely the 4 reaction constants of the 4 steps in the chain. Each chemical species measured in the chain of reactions is associated with a semi-analytical solution (dependent on the field measurement of bromide concentration). We therefore defined for each solution "u" the estimator Su defined by:
ACCEPTED MANUSCRIPT
14 and the global estimator:
(21)
We fitted k1 by minimizing S1. Once k1 had been fixed, we minimized S2 to estimate k2 and
continued for the following species. We then assessed the validity of our solution by checking from synthetic data that the total mass balance was maintained throughout the process.
In the following section, we first present results obtained from the laboratory experiments and then a description and modeling of the field experiment.
3. Results
3.1. Laboratory reactor experiments
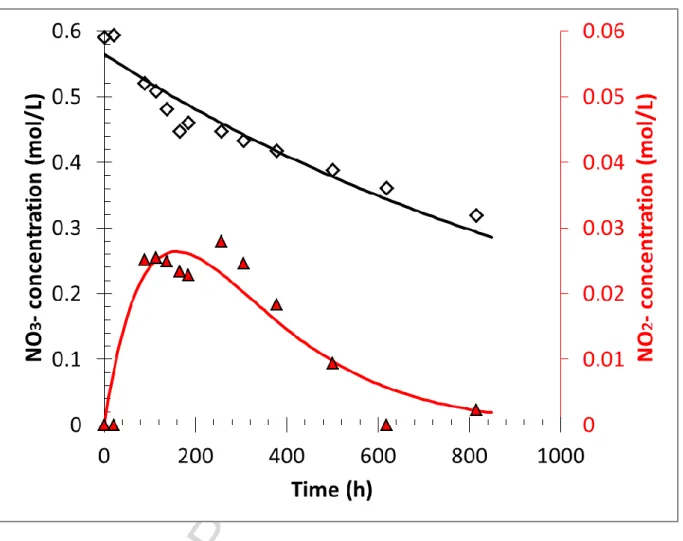
The initial nitrate concentration of 6.10-4 mol/L in the batch reactors decreased between 0 and
815 hours (Fig. 2). First order kinetic parameters were obtained from this concentration time course by applying the following equation:
(22)
Where CNO3(t) is the nitrate concentration at time t and CoNO3 is the initial concentration. The
first order kinetic parameter, k1, obtained from the experimental data is k1=0.0008 h-1. This
degradation represents the first step of the reaction (4) and all the NO3- that has been degraded
may be considered as degraded to NO2-. During its production, the NO2- is also being
degraded to NO. This can be modeled according to a first order reaction rate as in the following equation:
ACCEPTED MANUSCRIPT
15
(23)
Where GNO2 is the initial concentration of nitrites, CNO2- prod corresponds to the NO3- reduced
and k2 is the first order kinetic parameter. The parameter obtained (k2 = 0.0059 h-1)for NO2
-was higher than for NO3- indicating that NO2- was degraded more rapidly than NO3-.
However, this degradation did not occur fast enough to prevent an accumulation of NO2-.
These data were then used 1) to compare the behaviors of nitrate and nitrite evolution with the field experiment and 2) as reference kinetic parameters because no published data are available for this chain reaction.
3.2. Push-Pull breakthrough curves
In the following section the results of the push-pull experiment are discussed and the developed model is used to obtain first order kinetic parameters for the complete chain reaction.
3.2.1. Data analysis
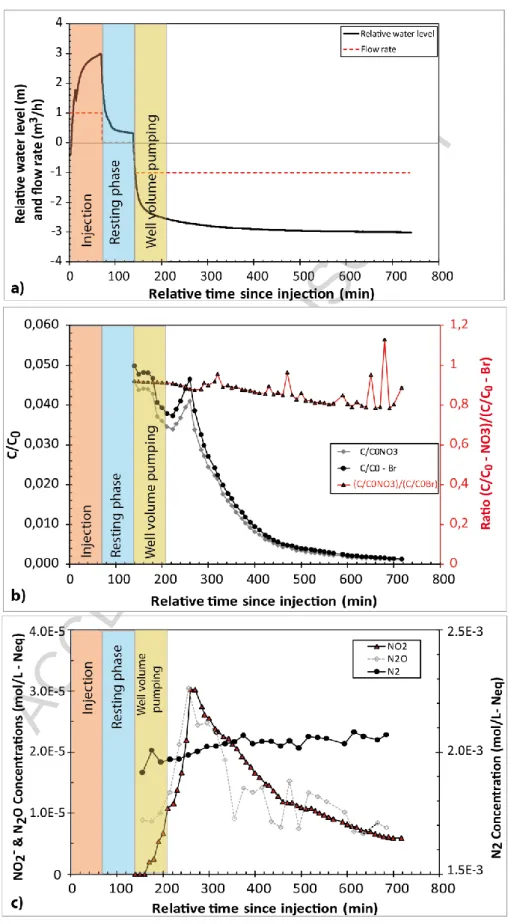
The breakthrough curves obtained when pumping back the tracers are shown in Fig. 3. Drawdown (Fig. 3a), relative tracer concentrations (Fig. 3b) and concentrations of by- products (Fig. 3c) are plotted against relative time since injection. In these plots, time 0 to 70 min corresponds to the injection phase (tracer from 0 to 16 min and chaser from 16 to 70 min), and time 70 to 140 min corresponds to resting time. Since the pump was located at 40 m depth in the borehole whereas the injection was carried out at 64 m in front of the fracture zone, a volume of water in the borehole located between the fractured zone and the pump needed to be removed before water in the aquifer could be extracted and sampled. Note that part of this water volume might also have been slightly mixed with tracer solution during the injection phase. Thus the volume pumped between 140 and 215 min corresponded to the
ACCEPTED MANUSCRIPT
16 volume of water that remained in the borehole. This volume of about 1.25 m3, was pumped
for 75 min and corresponded to i) the volume between the bottom of the fractured zone and the pump plus, ii) the wellbore storage implied by the observed rapid drawdown in the well during this period. Later times, from 215 to 720 min, correspond to tracer recovery from the aquifer. The relative concentration during the recovery phase was very low: C/C0=0.05. This was because the tracer was injected in a large borehole (22 cm diameter) at a low flow rate due to the poor permeability of the medium. Therefore this low relative concentration was mainly derived from the injection process but did not affect the parameter estimations from the model.
3.2.1.1. Reactivity within the borehole
From 140 to 215 min, some tracer was detected in the pumped water (Fig. 3) although the pumped volume corresponded to the volume of water present in the borehole prior to water sampling from the aquifer. This implies that some partial mixing of the tracer mass occurred within the borehole. Moreover, during this phase, the ratio CNO3(t)/C0NO3/CBr(t)/C0Br was less
than 1 implying that NO3- reduction occurred within the borehole. This reaction may be
related to Fe2+ oxidation as predicted by Eq. (2) since Fe2+ was present in the borehole water
(5 mg/L) and considerable bacterial development related to iron oxides had been observed in nearby piezometers. It should be noted however that this reaction, which represented 28% of the total NO3- reduced during the whole experiment, was characterized by the absence of NO2
-production.
3.2.1.2. Reactivity within the aquifer
No organic carbon was detected in the water before or during the test (< 0.04 mg/L), implying that the observed reaction was autotrophic denitrification. Abiotic denitrification is considered to be very slow (Weber et al., 2001) which means that it cannot be observed in a single day
ACCEPTED MANUSCRIPT
17 experiment in natural systems. Moreover bacteria are always present in natural hydrosystems and considerable biofilm development had been observed in another borehole close-by. Thus, it seems reasonable to consider this as a microbially-mediated reaction. An autotrophic reaction due to pyrite-bearing fractures had been previously observed in the Ploemeur site (Tarits et al., 2006) following Eq. (2) and (3). A slight increase of SO42- from 33 mg/L to 50
mg/L was also observed during the experiment which further suggests an autotrophic reaction. Nevertheless, this increase of SO42- cannot be fully correlated with the observed
NO3- reduction and may be partially related to mixing. However, even when such a
denitrification reaction occurs, the stoichiometric ratios are often not fully observed due to mixing and precipitation (Pauwels et al., 1998; Zhang et al., 2012). The concentration of Fe2+
also suggests the possibility of the reaction defined in Eq. (3). We thus considered in the following that the observed autotrophic reaction was ruled by Eq. (2) and (3).
For times longer than 215 min, which corresponded to water extracted from the aquifer, the CNO3(t)/C0NO3 and CBr(t)/C0Br ratios were relatively low due to dilution during the injection
phase (Fig. 3a) but the CNO3(t)/C0NO3 / CBr(t)/C0Br ratio remained below 1 which indicated
NO3- reduction (Fig. 3b). This exhibited a linear decrease with time. Extrapolation of this
slope to an early stage of the experiment led to a ratio CNO3(t)/C0NO3 / CBr(t)/C0Br of 1 (no
NO3- reduction) at time 0 min. This shows that the reaction started at the beginning of the
experiment without a biological lag phase, which is consistent with the reactivity observed within the borehole during continuous monitoring under ambient conditions. This possible lag phase may typically correspond to the adaptation time required for a microbial population to adapt to a new component before consuming it (e.g.: production of new enzymes) (Marazioti et al., 2003). Thus the microbial population appears to be already adapted and did not need a lag time before starting NO3- reduction.
ACCEPTED MANUSCRIPT
18 Fig. 3c displays the reaction by-products and shows that the production of NO2- and N2O is
clearly related to the NO3- concentration. For both products, the peaks are located at the same
time as those of NO3- and Br- . The breakthrough curves of these by-products confirm the
occurrence of the reactivity observed from the difference between the CNO3(t)/C0NO3 and
CBr(t)/C0B ratios.
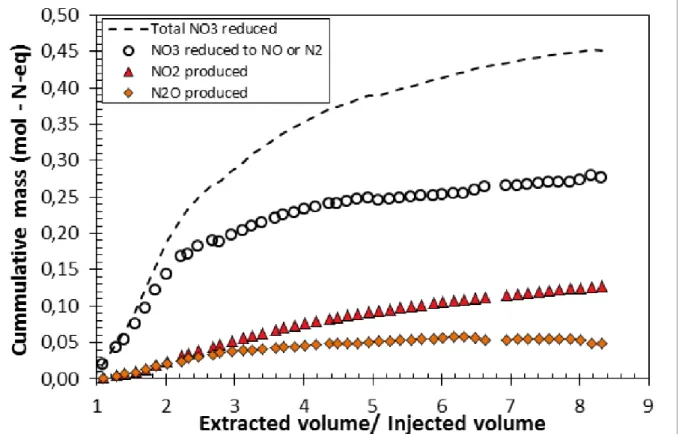
The cumulative NO3- quantity reduced, the NO3- reduced to NO or N2 (total NO3- reduced
minus NO2- and N2O produced), the NO2- produced and the N2O produced are shown on Fig.
4. The total injected NO3- mass in the geological medium was 4.6 mol. The total quantity of
NO3- reduced was 0.45 mol, i.e., only 9.8% of the injected quantity. Moreover, the
denitrification reaction was incomplete and only part of the reduced NO3- was reduced to N2.
About 0.13 mol of NO2- (2.7% of the injected mass and 29% of the reduced NO3-) and 0.096
mol of N2O (0.048 mol-Neq) was produced (1% of the injected quantity and 8% of the
reduced NO3-). Those results are summarized in Table 1.
3.2.2. Modeling results
The cumulative mass of NO3- reduced and by-products are plotted on Fig. 5 with the semi
analytical solutions for the different elements. As explained, the early times of the breakthrough curves for NO3- and Br- (from 140 to 215 min after injection) are indicative of
reactivity occurring in the borehole (9 data points). To satisfy data integration needs, 9 artificial data points were created, for Br- only, between pumping time 0 and the peak. These
data were created by fitting the peak location and magnitude to the analytical solution. As our fitting procedure was carried out on i) peak location and ii) the decay slope, this procedure had little effect and acted only on the initial slope of the concentration increase and the magnitude of the breakthrough curve. Therefore a slight difference was observed between the cumulative mass of NO3- given in Fig. 4 and Fig. 5. This difference corresponds to the 28%
ACCEPTED MANUSCRIPT
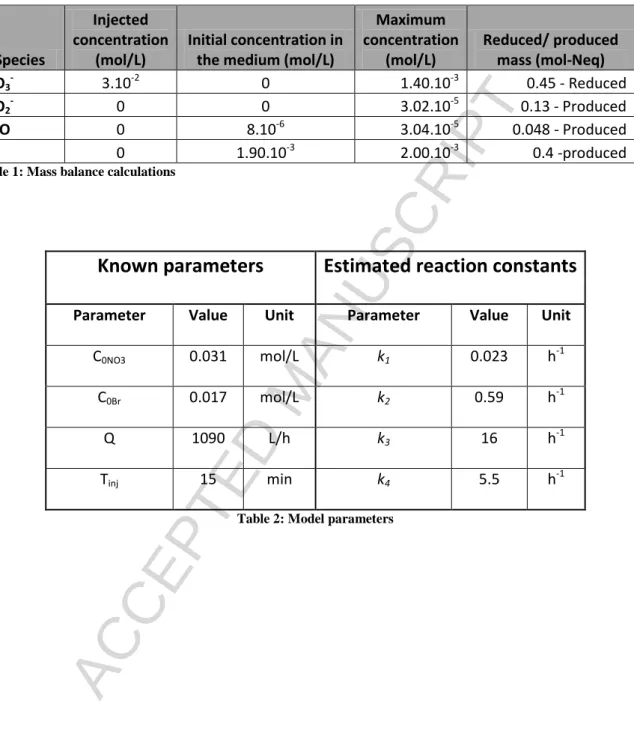
19 reduction calculated in section 3.2.1.1. Other elements were not affected. The parameters used and the estimated reaction constants are given in Table 2.
4. Discussion
4.1. Model limitations
The main factors influencing the estimation of reaction coefficients were breakthrough tailing and peak locations. The decay slope in the case of NO3- is only dependent on the k1 value
whereas the NO2- decay slope integrates both k1 and k2. The NO decay slope integrates k1, k2
and k3 whereas N2O integrates k1, k2, k3 and k4. These parameters can therefore be easily
determined in the case of k1 as nitrate is the only element involved (Haggerty et al., 1998) but
due to integration of the previous parameters, the uncertainty increases along the chain reaction and the parameters for the end of the chain reaction are therefore much less well-defined. The last parameter determination should be considered as a relative estimate with the greatest uncertainty. In summary, a variation of k4 has almost no influence on the modeled
concentration of N2O whereas the entire chain reaction is much more influenced by the choice
of k1 which is the principal parameter of the chain reaction.
4.2. Modeled kinetic parameters
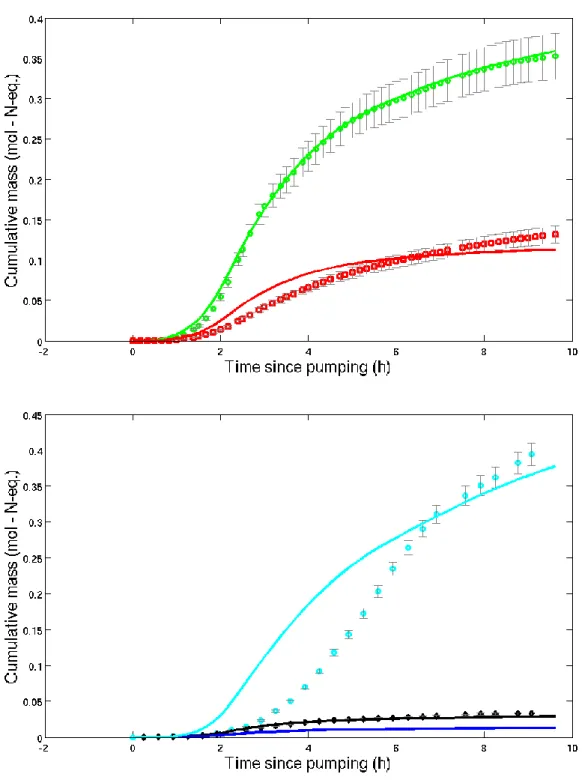
The measured versus modelled cumulative masses (Fig. 5) showed very good agreement. The modelled masses followed the global behavior of the experiment. The constant k1 derived
from the model was similar to that obtained from the solution of Haggerty et al. (1998). The deviations between experimental data and the model can be explained in various ways. First, the reaction rate at each step may evolve with time as it is related to microbial development. As NO3- reduction begins with the injection the indigenous populations seem to already be
ACCEPTED MANUSCRIPT
20 (Marazioti et al., 2003), the next step, NO2- reduction, may exhibit a lag phase due to
population adaptation since low or negligible NO2- concentrations are usually present in the
geological medium. This adaptation phenomenon is also true for the other steps of the chain reaction and may explain the slight differences between predicted and observed NO2
-concentrations (Fig. 5). A second effect which was not taken into account is related to the heterogeneity of the medium. As the injected solution flows through heterogeneous media, it experiences different flow velocities depending on the fracture aperture. This may locally change both the reaction rates and microbial population developments since the contact surface and residence time in each flow path may be different. Nevertheless, the good agreement between the experimental data and the model shows that the proposed chain reaction can be used with success as a first-order model of autotrophic denitrification.
For both experiments, the estimated kinetic parameters (ki) were coherent. For both
experiments the k2 values were higher for NO2- (k2=0.5 h-1) than for NO3- (k1=0.022 h-1). This
more rapid degradation has been observed by various authors in laboratory experiments. The obtained value of k1=0.022 h-1 for field experiments is nevertheless within the lowest range of
values presented in McGuire et al. (2002)and references herein. However the reaction rates for the heterotrophic reactions assessed by McGuire et al. (2002) are expected to be greater than for our autotrophic reaction. For the by-products, no studies have been found in the literature to allow comparison, so the absolute values of the parameters cannot be further compared.
4.3. In situ / laboratory experiments comparison
The kinetic parameters derived from batch laboratory experiments and the push pull field experiment, did not lead to the same first order reaction rates. Faster rates were observed in the field (k1=0.0035 h-1 in the case of laboratory experiments and 0.023 h-1 in the case of the
ACCEPTED MANUSCRIPT
21 field experiment). For NO2- the coefficients were k2= 0.59 h-1 for the field experiment and
k2=0.0081 h-1 for the batch experiment, leading to an even larger difference between the
laboratory experiments and push-pull tracer tests. Discrepancies between laboratory and field experiments are common due to differences in conditions such as fracture coating minerals, existing bacterial biofilms and/or redox conditions and the water rock interaction ratio. Although field measurements may also present some variability due to chemical heterogeneity (McGuire et al., 2002; Schroth et al,. 1998) and flow heterogeneity, they confirm the need for in situ field measurements to assess the reactivity of natural systems.
4.4. By-products production
In both experiments the amount of NO3- reduced was relatively limited (10 % in the case of
push pull and 50% in the case of the laboratory reactor). However, the formation of by-products was well quantified and indicated an incomplete reaction. When subtracted from the total amount of NO3- reduced, it was apparent that only 0.28 mol of NO3- was reduced to N2
or NO (curve labeled NO3 reduced to NO or N2 in Fig. 4). The proportion of N2O produced
was higher than observed in other experiments (Laverman et al., 2010; Silvennoinen et al., 2008). For example, Laverman et al. (2010) reported N2O produced to NO3- reduced ratios of
0.06% as compared to 8% in our experiments. Although autotrophic denitrification has been observed to produce a higher rate of N2O per NO3- consumed (Weymann et al., 2010), our
ratios are larger than those previously measured. However our model of the dependency of the different by-products of a chain reaction shows that the ratios of by-product formation over NO3- reduced were not constant and evolved with time. The observed ratios were
therefore dependent on the duration of the experiments. Moreover, the reaction kinetics may vary with the location, the microbial community (Holtan-Hartwig et al., 2000) and temperature (Holtan-Hartwig et al., 2002). The observed difference is difficult to interpret and indicates that more data are required to better characterize the field dynamics of
ACCEPTED MANUSCRIPT
22 denitrification. For this purpose, it could be interesting to carry out reactive push-pull tests with different injection or resting durations. To increase the accuracy of the measurements it might also be useful to perform nitrogen isotopic analyses as done by previous authors (Fukuda et al., 2003; Mariotti et al., 1988; Otero et al., 2009; Pauwels et al., 2010; Zhang et al., 2012). As the microbial reaction fractionates the nitrogen isotopes and the local isotopic ratios are relatively well known (Pauwels et al., 2010) this would allow better quantification of the extent of denitrification.
5. Conclusions
The model developed for chain reaction interpretation provides a comprehensive framework for assessing a chain reaction via push-pull tests. It allows derivation of the kinetic parameters and a better understanding of the interactions between different kinetic parameters. As expected the estimated constant k1 for the transformation of NO3- to NO2- is the main
parameter of the model. We were able to highlight the fact that biogeochemical reactions such as denitrification may be efficiently modeled as a chain reaction. This model can easily be used to model other chain reactions as it does not require any direct information about the aquifer properties (geometry, porosity, permeability or dispersivity).
The push pull test, which was carried out in a fractured crystalline aquifer to test the model, was also compared to batch experiments performed on rock and water samples from the site. This field experiment demonstrated the reliability of using push pull tests to assess the autotrophic denitrification reaction including by-products formation. The NO3- reduction
coefficient rates determined from laboratory experiments revealed lower coefficients than the field estimates. This study provides a first set of coefficients for the complete reaction kinetics which was not available previously. Further experiments, possibly using nitrogen isotopes, could be carried out to assess the evolution of the reaction rate with time and its dependency
ACCEPTED MANUSCRIPT
23 on flow conditions. The role of the heterogeneity of the medium at the field scale could also be further investigated.
Acknowledgements
The French National Research Agency ANR is acknowledged for its financial funding through the MOHINI project (ANR-07-VULN-008) as well as the European Union RDF INTERREG IVA France (Channel)-England program through the CLIMAWAT project. The field data investigations were also supported by the network of hydrogeological research sites H+ (SOERE H +). The authors are also grateful to Dr. Greg B. Davis and anonymous reviewers for their valuable and constructive comments.
ACCEPTED MANUSCRIPT
24
References
Addy, K., Kellog, D.Q., Gold, A.J., Groffman, P.M., Ferendo, G., Sawyer, C., 2002. In situ push-pull method to determine ground water denitrification in riparian zones. Journal of Environmental Quality 31 (3), 1017-1024.
Altman, S.J., Meigs, L.C., Jones, T.L., McKenna, S.A., 2002. Controls of mass recovery rates in single-well injection-withdrawal tracer tests with a single-porosity, heterogeneous conceptualization. Water Resources Research 38 (7), 1125.
Amirbahman, A., Schonenberger, R., Furrer, G., Zobrist, J., 2003. Experimental study and steady-state simulation of biogeochemical processes in laboratory columns with aquifer material. Journal of Contaminant Hydrology 64 (3-4), 169-190.
Aquilina, L., Vergnaud-Ayraud, V., Labasque, T., Bour, O., Molenat, J., Ruiz, L., de Montety, V., De Ridder, J., Roques, C., Longuevergne, L., 2012. Nitrate dynamics in agricultural catchments deduced from groundwater dating and long-term nitrate monitoring in surface- and groundwaters. The Science of the Total environment 435-436, 167-78.
Bauer, P., Attinger, S., Kinzelbach, W., 2001. Transport of a decay chain in homogenous porous media: analytical solutions. Journal of Contaminant Hydrology 49 (3-4), 217-239.
Becker, M.W., Shapiro, A.M., 2003. Interpreting tracer breakthrough tailing from different forced-gradient tracer experiment configurations in fractured bedrock. Water Resources Research 39 (1), 1024.
ACCEPTED MANUSCRIPT
25 Betlach, M.R., Tiedje, J.M., 1981. Kinetic explaination for accumulation of nitrite, nitric oxide, and nitrous oxide during bacterial denitrification. Applied and Environmental Microbiology 42 (6), 1074-1084.
Cozzarelli, I.M., Herman, J.S., Baedecker, M.J., Fischer, J.M., 1999. Geochemical heterogeneity of a gasoline-contaminated aquifer. Journal of Contaminant Hydrology 40 (3), 261-284.
Dentz, M., Le Borgne, T., Englert, A., Bijeljic, B., 2011. Mixing, spreading and reaction in heterogeneous media: A brief review. Journal of Contaminant Hydrology 120-21, 1-17.
de Dreuzy, J.R., Bodin, J., Le Grand, H., Davy, P., Boulanger D., Battais A., Bour O., Gouze P., Porel G., 2006. Groundwater database for site and processes studies. Ground Water 44 (5), 743-748.
Fukada, T., Hiscock, K.M., Dennis, P.F., Grischek T., 2003. A dual isotope approach to identify denitrification in groundwater at a river-bank infiltration site. Water Research 37, 3070–3078.
Gouze, P., Le Borgne, T., Leprovost, R., Lods, G., Poidras, T., Pezard, P., 2008. Non-Fickian dispersion in porous media: 1. Multiscale measurements using single-well injection withdrawal tracer tests. Water Resources Research 44 (6), W06426.
Haggerty, R., Schroth, M.H., Istok, J.D., 1998. Simplified method of "push-pull" test data analysis for determining in situ reaction rate coefficients. Ground Water 36 (2), 314-324.
Haggerty, R., Fleming, S.W., Meigs, L.C., McKenna, S.A., 2001. Tracer tests in a fractured dolomite 2. Analysis of mass transfer in single-well injection-withdrawal tests. Water Resources Research 37 (5), 1129-1142.
ACCEPTED MANUSCRIPT
26 Hiscock, K.M., Bateman, A.S., Muhlherr, I.H., Fukada, T., Dennis, P.F., 2003. Indirect emissions of nitrous oxide from regional aquifers in the United Kingdom. Environmental Science & Technology 37 (16), 3507-3512.
Holtan-Hartwig, L., Dörsh, P., Bakken, L.R., 2000. Comparison of denitrifying communities in organic soils: kinetics of NO3 and N2O reduction. Soil Biology and Biochemistry 32, 833-843.
Holtan-Hartwig, L., Dörsh, P., Bakken, L.R., 2002. Low temperature control of soil denitrifying communities: kinetics of N2O production and reduction. Soil Biology and Biochemistry 34, 1797-1806.
Istok, J.D., Humphrey, M.D., Schroth, M.H., Hyman, M.R., Oreilly, K.T., 1997. Single-well, ''push-pull'' test for in situ determination of microbial activities. Ground Water 35 (4), 619-631.
Jury, W.A., Roth, K., 1990. Transfer function and solute movement through soil. Birkhauser Verlag, Basel.
Kim, Y., Kim, J.H., Son, B.H., Oa, S.W., 2005. A single well push-pull test method for in situ determination of denitrification rates in a nitrate-contaminated groundwater aquifer. Water Science and Technology 52 (8), 77-86.
Knowles, R., 1982. Denitrification. Microbiological Reviews 46 (1), 43-70.
Korom, S.F., 1992. Natural denitrification in the saturated zone - a review. Water Resources Research 28 (6), 1657-1668.
ACCEPTED MANUSCRIPT
27 Laverman, A.M., Garnier, J.A., Mounier, E.M., Roose-Amsaleg, C.L., 2010. Nitrous oxide production kinetics during nitrate reduction in river sediments. Water Research 44 (6), 1753-1764.
Le Borgne, T., Bour, O., Paillet, F.L., Caudal, J.P., 2006. Assessment of preferential flow path connectivity, and hydraulic properties at single-borehole and cross-borehole scales in a fractured aquifer. Journal of Hydrology 328, 347-359.
Le Borgne T., Bour, O., Riley, M.S., Gouze, P., Pezard, P., Belghoul, A., Lods, G., Le Provost, R., Greswell, R.B., Ellis, P.A, Isakov, E., Last, B.J., 2007. Comparison of alternative methodologies for identifying and characterizing preferential flow paths in heterogeneous aquifers. Journal of Hydrology 345 (3), 134-148.
Le Borgne, T., Gouze, P., 2008. Non-Fickian dispersion in porous media: 2. Model validation from measurements at different scales. Water Resources Research 44 (6), 10.
Leray S., de Dreuzy J.-R. Bour O., Labasque T. and Aquilina L., 2012. Contribution of age data to the characterization of complex aquifers. Journal of Hydrology 464, 54-68.
Marazioti, C., Kornaros, M., Lyberatos, G., 2003. Kinetic modeling of a mixed culture of Pseudomonas denitrificans and Bacillus subtilis under aerobic and anoxic operating conditions. Water Research 37 (6), 1239-1251.
Mariotti, A., 1986. Denitrification in groundwaters, principles and methods for its identification - a review. Journal of Hydrology 88, 1-23.
Mariotti, A., Landreau, A,. Simon, B., 1988. 15N isotope biogeochemistry and natural denitrification process in groundwater: Application to the chalk aquifer of northern France. Geochimica and Cosmochimia Acta 52, 1869-1878.
ACCEPTED MANUSCRIPT
28 McAllister, P.M., Chiang, C.Y., 1994. A practical approach to evaluating natural attenuation of contaminant in groundwater. Ground Water Monitoring and Remediation 14 (2), 161-173.
McGuire, J.T., Long, D.T., Klug, M.J., Haack, S.K., Hyndman, D.W., 2002. Evaluating behavior of oxygen, nitrate, and sulfate during recharge and quantifying reduction rates in a contaminated aquifer. Environmental Science & Technology 36 (12), 2693-2700.
Meigs, L. C., Beauheim, R. L., 2001. Tracer tests in a fractured dolomite: 1. Experimental design and observed tracer recoveries, Water Resources Research 37 (5), 1113-1128.
Miotliński, K., 2008. Coupled reactive transport modeling of redox processes in a nitrate-polluted sandy aquifer. Aquatic Geochemistry 14 (2), 117-131.
Molz, F.J., Boman, G.K., Young, S.C., Waldrop, W.R., 1994. Borehole flowmeters - field application and data-analaysis. Journal of Hydrology 163, 347-371.
Mosier, A., Kroeze, C., Nevison, C., Oenema, O., Seitzinger, S., van Cleemput, O., 1998. Closing the global N2O budget: nitrous oxide emissions through the agricultural nitrogen cycle - OECD/IPCC/IEA phase II development of IPCC guidelines for national greenhouse gas inventory methodology. Nutrient Cycling in Agroecosystems 52, 225-248.
Muhlherr, I.H., Hiscock, K.M., 1998. Nitrous oxide production and consumption in British limestone aquifers. Journal of Hydrology 211, 126-139.
Otero, N., Torrento, C., Soler, A., Mencio, A., Mas-Pla, J., 2009. Monitoring groundwater nitrate attenuation in a regional system coupling hydrogeology with multi-isotopic methods: The case of Plana de Vic (Osona, Spain). Agriculture, Ecosystems and Environment 133, 103-113.
Paillet, F.L., 1998. Flow modeling and permeability estimation using borehole flow logs in heterogeneous fractured formations. Water Resources Research 34 (5), 997-1010.
ACCEPTED MANUSCRIPT
29 Pauwels, H., Kloppmann, W., Foucher, J.C., Martelat, A., Fritsche, V., 1998. Field tracer test for denitrification in a pyrite-bearing schist aquifer. Applied Geochemistry 13 (6), 767-778.
Pauwels, H., Ayraud-Vergnaud, V., Aquilina, L., Molenat, J., 2010. The fate of nitrogen and sulfur in hard-rock aquifers as shown by sulfate-isotope tracing. Applied Geochemistry 25 (1), 105-115.
Philippot, L., Cuhel, J., Saby, N.P.A., Cheneby, D., Chrnokova, A., Bru, D., Arrouays, D., Martin Laurent, F., Simek, M., 2009. Mapping field-scale spatial patterns of size and activity of the denitrifier community. Environmental Microbiology 11 (6), 1518-1526.
Postma, D., Boesen, C., Kristiansen, H., Larsen, F., 1991. Nitrate reduction in an unconfined sandy aquifer – water chemistry, reduction processes, and geochemical modeling. Water Resources Research 27 (8), 2027-2045.
Postma, D., Appelo, C.A.J., 2000. Reduction of Mn-oxides by ferrous iron in a flow system: Column experiment and reactive transport modeling. Geochimica Et Cosmochimica Acta 64 (7), 1237-1247.
Quezada, C.R., Clement, T.P., Lee, K.K., 2004. Generalized solution to multi-dimensional multi-species transport equations coupled with a first-order reaction network involving distinct retardation factors. Advances in Water Resources 27 (5), 507-521.
Ruelleu, S., Moreau, F., Bour, O., Gapais, D., Martelet, G., 2010. Impact of gently dipping discontinuities on basement aquifer recharge: An example from Ploemeur (Brittany, France). Journal of Applied Geophysics 70 (2), 161-168.
Schroth, M.H., Istok, J. D., Conner, G. T., Hyman, M. R., Haggerty, R., O'Reilly, K. T., 1998. Spatial variability in in situ aerobic respiration and denitrification rates in a petroleum-contaminated aquifer. Ground Water 36 (6), 924-937.
ACCEPTED MANUSCRIPT
30 Silvennoinen, H., Liikanen, A., Torssonen, J., Stange, C.F., Martikainen, P.J., 2008. Denitrification and nitrous oxide effluxes in boreal, eutrophic river sediments under increasing nitrate load: a laboratory microcosm study. Biogeochemistry 91 (2), 105-116.
Tarits, C., Aquilina, L., Ayraud, V., Pauwels, H., Davy, P., Touchard, F., Bour, O., 2006. Oxido-reduction sequence related to flux variations of groundwater from a fractured basement aquifer (Ploemeur area, France). Applied Geochemistry 21 (1), 29-47.
Touchard, F., 1999. Caractérisation hydrogéologique d'un aquifère en socle fracturé - Site de Ploemeur Morbihan. Université de Rennes 1.
Tsang, Y.W., 1995. Study of alternative tracer tests in characterizing transport in fractured rocks. Geophysical Research Letters 22 (11), 1421-1424.
Vandenbohede, A., Louwyck, A., Lebbe, L., 2008. Identification and reliability of microbial aerobic respiration and denitrification kinetics using a single-well push-pull field test. Journal of Contaminant Hydrology 95 (1-2), 42-56.
Vongunten, U., Zobrist, J., 1993. Biogeochemical changes in groundwater-infiltration systems - Column studies. Geochimica Et Cosmochimica Acta 57 (16), 3895-3906.
Weber, K.A., Picardal, F.W., Roden, E.E., 2001. Microbially catalyzed nitrate-dependent oxidation of biogenic solid-phase Fe(II) compounds. Environmental Science & Technology 35 (8), 1644-1650.
Weymann, D., Well, R., Flessa, H., von der Heide, C., Deurer, M., Meyer, K., Konrad, C., Walther, W., 2008. Groundwater N2O emission factors of nitrate-contaminated aquifers as derived from denitrification progress and N2O accumulation. Biogeosciences 5 (5), 1215-1226.
ACCEPTED MANUSCRIPT
31 Weymann, D., Geistlinger, H., Well, R., von der Heide, C., Flessa, H., 2010. Kinetics of N2O production and reduction in a nitrate-contaminated aquifer inferred from laboratory incubation experiments. Biogeosciences 7 (6), 1953-1972.
Zhang, Y., Slomp, C.P., Broers, H.P., Passier, H.F., Van Cappellen, P., 2009. Denitrification coupled to pyrite oxidation and changes in groundwater quality in a shallow sandy aquifer. Geochimica et Cosmochimica acta 73, 6716-6726.
Zhang Y.C., Slomp, C.P., Broers H.P., Bostick, B., Passier, H.F., Böttcher M.E., Omoregie, E.O., Lloyd, J.R., Polya D.A. and Van Cappellen, P., 2012. Isotopic and microbiological signatures of pyrite-driven denitrification in a sandy aquifer. Chemical Geology 300-301, 123-132.
ACCEPTED MANUSCRIPT
32
Figures
Fig. 1: Ploemeur site representation;
a) Location of the site, b) Schematic 3D diagram of the Ploemeur pumping site showing the regional contact dipping toward the North and the N20 dextral normal fault along which many boreholes were drilled (modified from Le Borgne et al., 2006), c) Synthetic geological map of Ploemeur area (modified from Ruelleu et al., 2010). White square shows the pumping site location.
ACCEPTED MANUSCRIPT
33 Fig. 2: Evolution with time of nitrate (black) and nitrite (red) concentrations in batch reactors
ACCEPTED MANUSCRIPT
34 Fig. 3: Results of the push-pull test experiment: a) Piezometic head evolution with time highlighthing the different phases of the push-pull test.; b)Normalized breakthrough curves for nitrates and bromides; c) breakthrough curves
ACCEPTED MANUSCRIPT
35 Fig. 4: Cumulative mass of nitrates reduced and reaction by-products produced
ACCEPTED MANUSCRIPT
36 Fig. 5: Cumulative mass of the total reduced NO3- (a-green); produced NO2- (a-red); produced N2O (b-black) and N2
(b-cyan). Curves represent model results for each compound. The blue line (b) represents the estimated NO mass production. The dashed line represents theoretical N2 production. Error bars represent the analytical error..
ACCEPTED MANUSCRIPT
37 Species Injected concentration (mol/L) Initial concentration in the medium (mol/L)Maximum concentration (mol/L) Reduced/ produced mass (mol-Neq) NO3- 3.10-2 0 1.40.10-3 0.45 - Reduced NO2- 0 0 3.02.10-5 0.13 - Produced N2O 0 8.10-6 3.04.10-5 0.048 - Produced N2 0 1.90.10-3 2.00.10-3 0.4 -produced
Table 1: Mass balance calculations
Known parameters
Estimated reaction constants
Parameter Value Unit Parameter Value Unit
C0NO3 0.031 mol/L k1 0.023 h-1
C0Br 0.017 mol/L k2 0.59 h-1
Q 1090 L/h k3 16 h-1
Tinj 15 min k4 5.5 h-1
ACCEPTED MANUSCRIPT
38 Highlights
We highlight the fact that biogeochemical reactions such as denitrification may be efficiently modeled as a chain reaction
We quantify nitrate reduction and by-product formation during autotrophic denitrification.
We provide a first set of parameters to model autotrophic denitrification reaction as a reaction chain in crystalline media.