HAL Id: hal-00304095
https://hal.archives-ouvertes.fr/hal-00304095
Submitted on 15 Apr 2008HAL is a multi-disciplinary open access
archive for the deposit and dissemination of sci-entific research documents, whether they are pub-lished or not. The documents may come from teaching and research institutions in France or abroad, or from public or private research centers.
L’archive ouverte pluridisciplinaire HAL, est destinée au dépôt et à la diffusion de documents scientifiques de niveau recherche, publiés ou non, émanant des établissements d’enseignement et de recherche français ou étrangers, des laboratoires publics ou privés.
Mode resolved density of atmospheric aerosol particles
J. Kannosto, M. Lemmetty, A. Virtanen, J. M. Mäkelä, J. Keskinen, H.
Junninen, T. Hussein, P. Aalto, M. Kulmala
To cite this version:
J. Kannosto, M. Lemmetty, A. Virtanen, J. M. Mäkelä, J. Keskinen, et al.. Mode resolved density of atmospheric aerosol particles. Atmospheric Chemistry and Physics Discussions, European Geosciences Union, 2008, 8 (2), pp.7263-7288. �hal-00304095�
ACPD
8, 7263–7288, 2008 Mode resolved density of atmospheric aerosol particles J. Kannosto et al. Title Page Abstract Introduction Conclusions References Tables Figures ◭ ◮ ◭ ◮ Back CloseFull Screen / Esc
Printer-friendly Version Interactive Discussion
Atmos. Chem. Phys. Discuss., 8, 7263–7288, 2008 www.atmos-chem-phys-discuss.net/8/7263/2008/ © Author(s) 2008. This work is distributed under the Creative Commons Attribution 3.0 License.
Atmospheric Chemistry and Physics Discussions
Mode resolved density of atmospheric
aerosol particles
J. Kannosto1, M. Lemmetty1, A. Virtanen1, J. M. M ¨akel ¨a1, J. Keskinen1, H. Junninen2, T. Hussein2, P. Aalto2, and M. Kulmala2
1
Tampere University of Technology, Department of Physics, Aerosol Physics Laboratory, P.O.Box 692, FIN-33101 Tampere, Finland
2
Department of Physics, University of Helsinki, P.O.Box 64, FI-00014 Uhel, Finland Received: 22 February 2008 – Accepted: 21 March 2008 – Published: 15 April 2008 Correspondence to: A. Virtanen ([email protected])
ACPD
8, 7263–7288, 2008 Mode resolved density of atmospheric aerosol particles J. Kannosto et al. Title Page Abstract Introduction Conclusions References Tables Figures ◭ ◮ ◭ ◮ Back CloseFull Screen / Esc
Printer-friendly Version Interactive Discussion
Abstract
In this study, we investigate the mode resolved density of ultrafine atmospheric par-ticles measured in boreal forest environment. The method used here enables us to find the distinct density information for each mode in atmospheric fine particle popu-lation: the density values for nucleation, Aitken, and accumulation mode particles are 5
presented. The experimental data was gained during 2 May 2005–19 May 2005 at the boreal forest measurement station “SMEAR II” in Hyyti ¨al ¨a, southern Finland. The density values for accumulation mode varied from 1.1 to 2 g/cm3 (average 1.5 g/cm3) and for Aitken mode from 0.4 to 2 g/cm3(average 0.97 g/cm3). As an overall trend dur-ing the two weeks campaign, the density value of Aitken mode was seen to gradually 10
increase. With the present method, the time dependent behaviour of the particle den-sity can be investigated in time scale of 10 min. This allows us the follow the denden-sity evolution of the nucleation mode particles during the particle growth process follow-ing the nucleation burst. The density of nucleation mode particles decreased durfollow-ing the growth process. The density values for 15 nm particles were 1.2–1.5 g/cm3 and 15
for grown 30 nm particles 0.5–1 g/cm3. These values are consistent with the present knowledge that the condensing species are semi volatile organics, emitted from the Boreal forest.
1 Introduction
Atmospheric aerosol contains a complex mixture of particles of natural and anthro-20
pogenic origin, consisting of both primary and secondary particles from a variety of sources (e.g., Seinfeld and Pandis, 1998). Its chemical and elemental composition, optical, hygroscopic and other important physical and chemical properties vary both spatially and temporally. Additionally, there is variation of all these quantities over parti-cle size. The assessment of climatic and adverse health effects of atmospheric aerosol 25
ACPD
8, 7263–7288, 2008 Mode resolved density of atmospheric aerosol particles J. Kannosto et al. Title Page Abstract Introduction Conclusions References Tables Figures ◭ ◮ ◭ ◮ Back CloseFull Screen / Esc
Printer-friendly Version Interactive Discussion
and Feichter, 2005; Pope and Dockery, 2006). For example, the particle size and chemical composition affect the particle residence time in the atmosphere, its optical properties and its potential to act as cloud condensation nuclei as well as its behaviour in human lung. In addition, the particle chemical composition and other chemical and physical properties carry information concerning sources and formation mechanisms 5
of particles.
Atmospheric fine particles can be classified to ultrafine (dp<0.1 µm) and accumula-tion mode (0.1 µm<dp<1 µm) particles. Ultrafine particles can be further divided into nucleation (<30 nm) and Aitken mode particles (30 nm<dp<0.1 µm). The ultrafine size
range dominates the particle number concentration, and in urban areas usually con-10
tributes to more than 90% of particle total number. Generally, after their formation, the fresh aerosol particles in atmosphere appear in this size range. In addition, being also in the critical size range for acting as cloud condensation nuclei, ultrafine size range affects the number concentration of cloud droplets in remote and moderately polluted environments.
15
The composition and properties of accumulation mode particles are fairly well known, because proper measurement and analytical methods have been available for this size range and mass concentration level (e.g., Wall et al., 1988; Seinfeld and Pandis, 1998; Maenhaut et al. 1999; Putaud et al., 2004). A few studies in distinct locations have provided also information on the composition of the ultrafine size mode, such as exis-20
tence of polycyclic aromatics in urban aerosol (Allen et al., 1998), overall urban aerosol at around 100 nm (Cass et al., 2000), elemental composition of chlorine in sub 10 nm coastal aerosol (M ¨akel ¨a et al., 2002), distinct chemical components such as amines in boreal forest (M ¨akel ¨a, 2001a), organics vs. in-organics in boreal forest (O’Dowd et al., 2002) and organics in coastal aerosol (Vaattovaara et al., 2006). Recent results 25
obtained by mass spectrometers give first insights to the full chemical composition of ultrafine particles (Zhang et al., 2005; Smith et al., 2005; Allan et al., 2006). However, there are still clear gaps in the overall knowledge about the ultrafine size range.
ACPD
8, 7263–7288, 2008 Mode resolved density of atmospheric aerosol particles J. Kannosto et al. Title Page Abstract Introduction Conclusions References Tables Figures ◭ ◮ ◭ ◮ Back CloseFull Screen / Esc
Printer-friendly Version Interactive Discussion
particles in atmosphere (Kulmala et al., 2004a). There have been intensive and suc-cessful efforts to identify different nucleation mechanisms (e.g. Kulmala et al., 2006). Regardless of the progress, there are still gaps in the general understanding of the new particle formation, and between the experimental data and models. In the ex-perimental data there are for example long time series available showing particle size 5
evolutions after nucleation event (e.g., Dal Maso et al., 2005), but the observations of composition and properties are mostly lacking. It is not clear which compounds are responsible for condensational growth process of nucleation mode particles (e.g., Kul-mala et al., 2004b). A number of different organic species has been linked with the particle growth process in natural forest environment (e.g., O’Dowd, 2002; Tarvainen 10
et al., 2005; Laaksonen et al., 2007)
As a property complementary to particle composition, the density of the particles is of great interest. Accumulation and coarse mode particle density has been studied e.g. by McMurry et al. (2002) and Saarikoski et al. (2005). In this study, we investigate mode resolved density of atmospheric ultrafine particles in boreal forest environment, using 15
a density fitting method (e.g., Virtanen et al., 2006). Preliminary, time averaged density values have been discussed by Kannosto et al. (2006). Here we present analysis of the full data set, reporting values for nucleation, Aitken, and accumulation modes. As a new aspect, we study the time dependent behaviour of the particle density. This allows us to follow the density change of particles during the particle growth process following 20
a nucleation burst.
2 Method description
Particle density was estimated using the parallel measurement method developed at Tampere University of Technology, first described by Ristim ¨aki et al. (2002). The method is based on simultaneous (“parallel”) distribution measurement with ELPI and 25
SMPS/DMPS and further on the relationship between particle aerodynamic size, mo-bility size and effective density. First applied to laboratory aerosols and diesel exhaust
ACPD
8, 7263–7288, 2008 Mode resolved density of atmospheric aerosol particles J. Kannosto et al. Title Page Abstract Introduction Conclusions References Tables Figures ◭ ◮ ◭ ◮ Back CloseFull Screen / Esc
Printer-friendly Version Interactive Discussion
particles, the method has been developed further to be suitable for atmospheric aerosol (Virtanen et al., 2006; Kannosto et al. 2006). We have now further modified the data treatment method to be suitable for large data series and multimodal distributions which are typical for Boreal forest environment.
As the shape of the aerosol distributions are commonly relatively close to lognormal 5
distributions, the measured number distribution on mobility axis is divided into log-normal sub-distributions (modes). The automatic algorithm described by Hussein et al. (2005) is used in fitting the lognormal distributions to measured DMPS or SMPS data. In order to find the correct density for each mode the ELPI response to the multi-modal distribution is simulated. In the calculation of the simulated ELPI currents 10
a mathematical model of ELPI is used. The complete set of information, required to construct the mathematical model of ELPI, can be found in Marjam ¨aki et al. (2005).
In the calculation of the simulated currents, the effective density of particles is needed. By changing the effective densities of modes the simulated ELPI currents are changed. The simulated ELPI currents are obtained by summing up the currents pro-15
duced by each sub-distribution. The main difference to the single mode case (Ristim ¨aki et al., 2002) is that instead of one effective density, effective density for each mode is searched. This means that the search algorithm has to operate in multi-dimensional space and result may be more sensitive to the start point than with single mode case. Several methods can be used to define the start point for the search algorithm. We 20
have initialized the effective densities with an ad hoc method where the initial effective densities are suggested in a sequence starting from the distribution contributing most of the ELPI current and ending with the one that contributes least. These contributions can be easily calculated as the total current produced by distribution does not depend on the effective density. The actual initialisation of each mode is performed by utilizing 25
a set of pre-selected densities ranging from 0.1 to 10 g/cm3, and defining the density which gives the smallest difference between measured and simulated currents. After the initialisation the search algorithm (the “fminsearch” function of Matlab®) minimises the difference between the measured and simulated ELPI currents by changing the
ACPD
8, 7263–7288, 2008 Mode resolved density of atmospheric aerosol particles J. Kannosto et al. Title Page Abstract Introduction Conclusions References Tables Figures ◭ ◮ ◭ ◮ Back CloseFull Screen / Esc
Printer-friendly Version Interactive Discussion
effective densities of each mode. 2.1 Method evaluation
The method used in this article has been previously evaluated in laboratory setting by Virtanen et al. (2006). They used laboratory aerosols with bimodal size distributions. The particles consisted of Fomblin (perfluorinated polyether inert fluid, Ausimont Ltd, 5
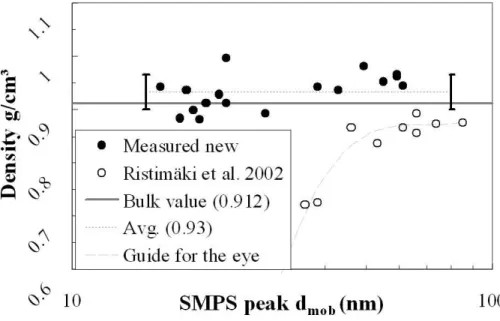
ρ=1.9 g/cm3) and di-octyl sebacate (DOS, ρ=0.91 g/cm3) and the geometric mean di-ameters of two modes were varied between 40–150 nm. The method produced density estimates of (0.8±0.08) g/cm3and (1.8±0.26) g/cm3for DOS and Fomblin respectively. Some additional laboratory tests with DOS and smaller particle sizes were performed by Ristim ¨aki (2006). In Fig. 1, the results measured with carefully calibrated impactor 10
are shown (black dots in Fig. 1). The lowest mode size measured was 13 nm. The agreement with bulk value of DOS (gray line in Fig. 1) and measurement results is good. In the Fig. 1 also the earlier laboratory test results reported by Ristim ¨aki et al. (2002) are shown (open circles). Those points are calculated by using the older impactor kernel functions, which had some inaccuracy in the cut of curve of the 1st 15
impactor stage. The figure clearly shows that a careful calibration of the impactor is essential.
Because of the number of variables affecting the performance of the method, lab-oratory tests are not an efficient way to find out the restrictions of the density fitting method. Thus a large number of simulations were made to find out the “detection 20
limit” of the method. The simulations show that the detection limit depends mainly on GMD of modes and relative concentration of modes. According to the simulations, the method is usable and occasional wrong results are not statistically significant. Accord-ing to simulation runs, the density analyzAccord-ing method is capable of evaluatAccord-ing density of nucleation mode particles in multimodal distribution, even when the smallest mode 25
GMD is around 15 nm. The density results of nucleation mode particles in multimodal distributions can be accurate if circumstances are favourable. First of all, this requires sufficiently high concentrations to get a good mode fitting result from the SMPS/DMPS
ACPD
8, 7263–7288, 2008 Mode resolved density of atmospheric aerosol particles J. Kannosto et al. Title Page Abstract Introduction Conclusions References Tables Figures ◭ ◮ ◭ ◮ Back CloseFull Screen / Esc
Printer-friendly Version Interactive Discussion
measurement. In addition, the nucleation mode must generate enough current in the ELPI in order for our method to arrive at a reliable density estimate. If approximately 20% of the measured current is produced by the nucleation mode the density value can be found.
According to method runs made with simulated data, there are a few situations when 5
the method has an increased possibility to yield incorrect density results. These sit-uations are encountered in cases where two modes both generate approximately the same amount of ELPI current or if the current generated by the one mode is insignif-icant. In the former case, when generating the ELPI response, the two modes may swap places on the aerodynamic axis (“mode swapping”). This can be recognized as 10
the other mode receives an improbably high density value, while the other one receives an improbably low one. In the latter case, the mode producing the small ELPI current may receive almost any density value without affecting the density of the dominant mode significantly. Both types of error can be recognized and the erroneous density values removed during analysis.
15
The sensitivity of the particle density calculation to measurement errors was inves-tigated using the method first employed by Virtanen et al. (2004). In order to see how easily the particle density results are affected by measurement error, we took the existing measurement data and added a random, normally distributed 5% noise com-ponent to each of the measured ELPI current channels. For each measurement point, 20
the density analysis was then run with 100 noisy samples. In most cases, the standard deviation of the density result was less than 10%. We used high standard deviation values to remove the less reliable data points from further analysis. The measurement points where the added noise caused mode swapping received high standard devia-tion and the points were removed. The data points with one dominant mode tended to 25
receive high standard deviation values for the less dominant mode density. The density data for the less dominant mode were removed from analysis. As the more dominant mode density values did not receive high standard deviation, they were not removed.
ACPD
8, 7263–7288, 2008 Mode resolved density of atmospheric aerosol particles J. Kannosto et al. Title Page Abstract Introduction Conclusions References Tables Figures ◭ ◮ ◭ ◮ Back CloseFull Screen / Esc
Printer-friendly Version Interactive Discussion
3 Description of measurement campaign
The experimental data was gained during 2 May 2005–19 May 2005 at the boreal forest measurement station “SMEAR II” in Hyyti ¨al ¨a (61◦51′N, 24◦17′E, 181 m a.s.l.), southern Finland. Hyyti ¨al ¨a is background measurement station at southern Finland and around the SMEAR there are extended areas of Scots Pine (Pinus sylvestris). Concentrations 5
are typical background levels except wind directions 215◦–265◦ where city of Tampere and station buildings are located. During the 16 (from noon) and 18 (until the morning) May the instruments were not in use. The measurement site has been presented more detail in Kulmala et al. (2001) and by Hari and Kulmala (2005).
The particles size distributions were measured with four separate instruments: ELPI 10
(Dekati Ltd), outdoor ELPI (Dekati Ltd), SMPS (CPC 3025, DMA 3071, TSI), and DMPS two Vienna type DMAs, with 11 cm and 28 cm tube lengths, CPC 3025, CPC 3010 (M ¨akel ¨a et al., 1997). The measurement range of ELPI (with 10 lpm flow) and outdoor ELPI (with 30 lpm flow) were 7 nm–6 µm and measurement time resolution was 1 min. The SMPS size range was ab. 10 nm–400 nm and time resolution 10 min. The DMPS 15
data is a combination of two parallel DMPS and the overall measurement size range was range ab. 3 nm–500 nm. Measurement instruments located in two different cot-tages (ELPI and SMPS in one and outdoor ELPI and DMPS in another) and distance between the two cottages was about 70 m. The SMPS and ELPI sampling line was ∅ 12 mm steel tube and the inlet height was 4 m. The outdoor ELPI and DMPS had own 20
inlets and sampling lines. Inlets were at 4 m high and sampling lines were ∅ 8 mm steel tube. The results shown in this paper are measured by using DMPS and ELPI (10 lpm) unless otherwise noted.
The weather during the measurements was typical for Finnish spring. Temperature varied between 1 to 22◦C and average temperature during daytime was 10◦C and dur-25
ing night time 5◦C. First days (2–8 May 2005) wind direction was between South-West-South-East (100◦–217◦) and during 8–14 May 2005 wind direction turned towards north (300◦–50◦most of the time) and last days (14–19 May 2005) wind direction was mainly
ACPD
8, 7263–7288, 2008 Mode resolved density of atmospheric aerosol particles J. Kannosto et al. Title Page Abstract Introduction Conclusions References Tables Figures ◭ ◮ ◭ ◮ Back CloseFull Screen / Esc
Printer-friendly Version Interactive Discussion
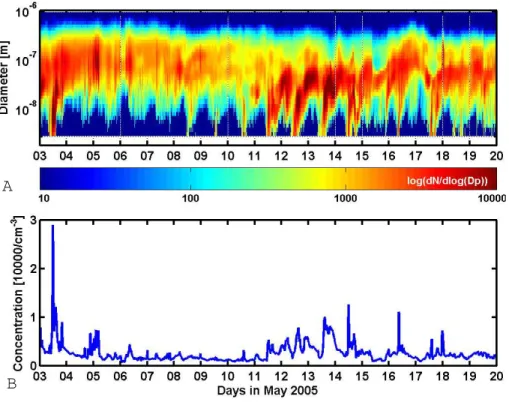
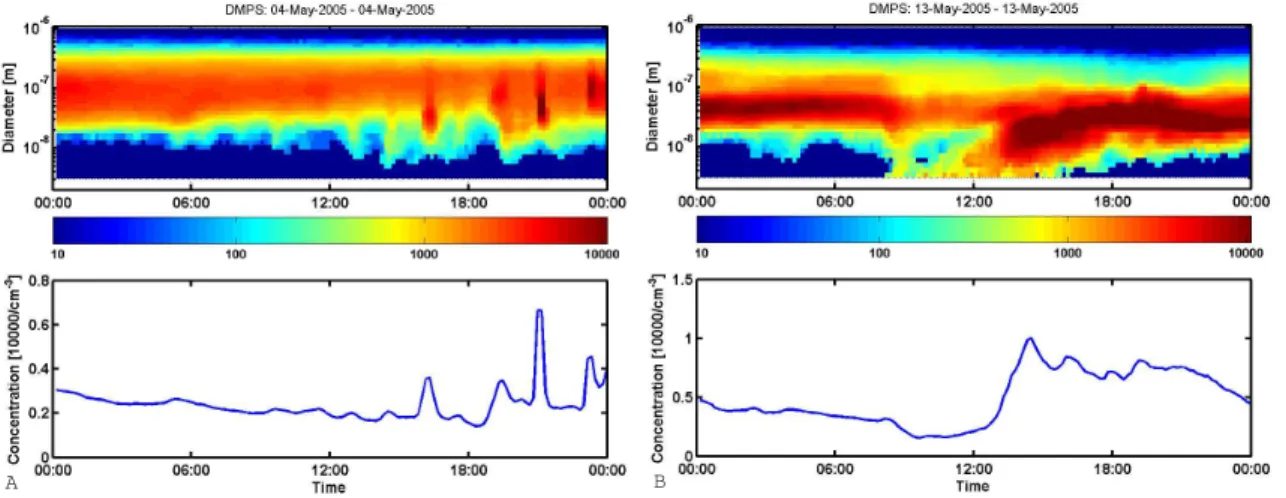
150◦–260◦. There was some rain 3 May 2005 and 5 May 2005 evening and night, 15 May 2005 day and night and during the night 16–17 May 2005. In Fig. 2 the par-ticle concentrations measured during the campaign are presented as a contour plot (Fig. 2a) and as a time series (Fig. 2b). The particle formation episodes were recorded during 3, 8, 11–15 May and 17–18 2005.
5
4 Results
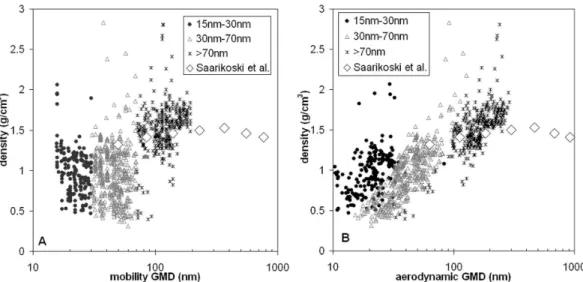
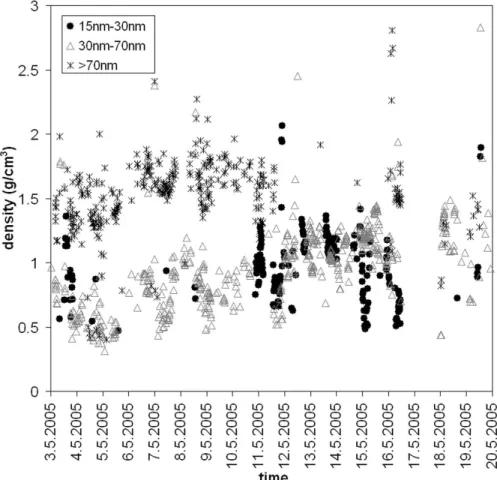
In Fig. 3a, all density values gained during the campaign are plotted as a function of mode GMD. The atmospheric particles are typically grouped into different modes according to mode GMD (M ¨akel ¨a et al., 2001b). In our data treatment we have also grouped the results according to mode diameter. All GMD values presented in this 10
paper are mobility equivalent sizes unless otherwise mentioned. As can be seen, the density of nucleation mode particles (15–30 nm) varies between 0.5 and 1.5 g/cm3. Let us next investigate the density results of the Aitken and accumulation mode particles. For Aitken mode particles we have chosen the size range 30–70 nm instead of the of-ten used 30–100 nm (e.g., Hussein et al., 2004; Koponen et al., 2003). The reason for 15
the chosen size range is justified when Fig. 3a is investigated in more detail. It shows that the particle density values are separated into two groups, depending on their mode GMD. Particles with the mobility based mode diameter smaller than 70 nm clearly have lower density values than the larger particles. The separation of atmospheric aerosol particles into different modes is based on the assumption that the modes have differ-20
ent origin (e.g., Seinfeld and Pandis, 1998). Thus it can be assumed that the modes have also different compositions and density. The clearly distinguishable density val-ues of particles in the two groups shown in Fig. 3 support this assumption. According to these results, we can conclude that during our measurement campaign in Hyyti ¨al ¨a the justified size limit (mobility based) for Aitken and accumulation modes was around 25
70 nm. In Fig. 3b, particle density is presented as a function of the aerodynamic parti-cle diameter. The aerodynamic diameter is related to partiparti-cle mass and therefore also
ACPD
8, 7263–7288, 2008 Mode resolved density of atmospheric aerosol particles J. Kannosto et al. Title Page Abstract Introduction Conclusions References Tables Figures ◭ ◮ ◭ ◮ Back CloseFull Screen / Esc
Printer-friendly Version Interactive Discussion
to particle density. In Fig. 3b it can be seen that the modes are even more clearly distinguishable on the aerodynamic size axis than on the mobility axis. The aerody-namic size limit for Aitken and accumulation mode is approximately 100 nm during our campaign in Hyyti ¨al ¨a. It seems that the particle density measurement gives valuable information that can be used when the particles are to be separated into Aitken and 5
accumulation modes. Such a clear difference in density values of Aitken mode and nucleation mode particles was not detected.
The density results reported in this study are also compared to values reported by Saarikoski et al. (2006) (Fig. 3a and b). They studied the chemical composition of particles collected with a low pressure impactor in Hyyti ¨al ¨a. The density was derived 10
from the mass closure analysis. The agreement of the results presented by Saarikoski et al. and the results presented in this paper is good. During the campaign the size distributions were measured with SMPS and DMPS and also by ELPI (10 lpm) and outdoorELPI (30 lpm) as mentioned in the previous section. The densities gained by using different instrument pairs were in good agreement: the difference was 17% at 15
maximum. This confirms that the density analyzing method can be applied to different instrument pairs having different characteristics if the instruments are carefully cali-brated as was the case here.
The particle density results plotted at time axis are shown in Fig. 4, where the density values of the Nucleation mode particles (black dots in Fig. 4) with 15 nm<GMD<30 nm, 20
Aitken (GMD 30–70 nm, open triangles in Fig. 4) and accumulation (GMD>70 nm, open circles in Fig. 4) modes are presented. From the evening of 16 May 2005 to morning of 18 May 2005 the instruments were not in use, thus the corresponding data points are missing in Fig. 4. As shown in Fig. 4, the density values of Aitken mode varied from 0.4 to 2 g/cm3(average 0.97 g/cm3) and the values for accumulation mode varied 25
from 1.1 to 2 g/cm3 (average 1.5 g/cm3). The found density values for accumulation mode agreed well with those reported in other studies (McMurry et al., 2002; Virtanen et al., 2006; Saarikoski et al., 2005; Cozic et al., 2007). The Aitken and accumulation mode particle densities had lowest values in the beginning of the campaign. As an
ACPD
8, 7263–7288, 2008 Mode resolved density of atmospheric aerosol particles J. Kannosto et al. Title Page Abstract Introduction Conclusions References Tables Figures ◭ ◮ ◭ ◮ Back CloseFull Screen / Esc
Printer-friendly Version Interactive Discussion
overall trend during the two weeks campaign, the density value of Aitken mode was seen to gradually increase. During the particle formation episodes that took place at 11–15 May, the concentration of the accumulation mode particles was too low for the successful density analysis. The density values of Aitken mode increased during the campaign and reached their maximum value at 14 of May. The highest values of Aitken 5
mode densities (0.9–1.3 g/cm3) were recorded in the period during which the particle formation events took place. Increasing density of Aitken mode particles coincided with decreasing relative humidity and increasing solar radiation, accompanied with a turn in the wind direction towards north. However, a larger amount of data is needed before the dependence of the particle density on the different (meteorological) parameters can 10
be properly analyzed.
The density values for the nucleation mode particles were obtained only when the particle concentration was adequate and the mode diameter equal or larger than 15 nm. According to the simulations, the nucleation mode particle concentration was suf-ficient for density analysis if the nucleation mode particles produce 20% of the current 15
measured in ELPI. This requirement was fulfilled during the particle formation events. During the events the concentration levels of accumulation mode particles were too low to get reliable mode fitting. Hence only density result of Aitken and nucleation modes are presented. During the night of 15 and 16 May, nucleation mode was present, but a clear increase in particle size was not detected. The density of nucleation mode 20
particles varied between 1.5 and 0.5 g/cm3. The density of growing nucleation mode particles was lower during the 11–12 May than during the 13–14 May. This follows the overall density progress of Aitken mode particles during those days. The nucle-ation mode particles appearing during the nights of 15 and 16 May had generally lower density values than particles appearing during the daytime. On 16 May the particle 25
formation event took place in the afternoon when our measurement devices were not in use.
To investigate the trends in particle density in more detail, two days were chosen, different in particle dynamics. 4 May was a day with practically no nucleation mode
ACPD
8, 7263–7288, 2008 Mode resolved density of atmospheric aerosol particles J. Kannosto et al. Title Page Abstract Introduction Conclusions References Tables Figures ◭ ◮ ◭ ◮ Back CloseFull Screen / Esc
Printer-friendly Version Interactive Discussion
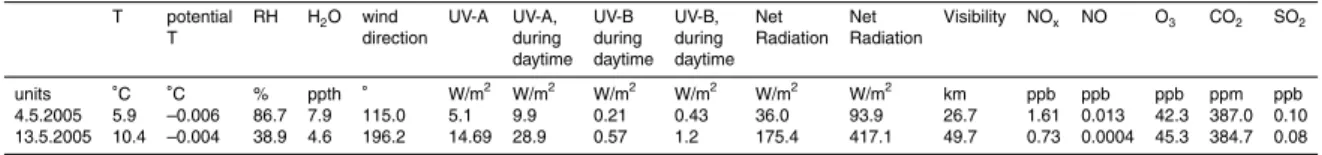
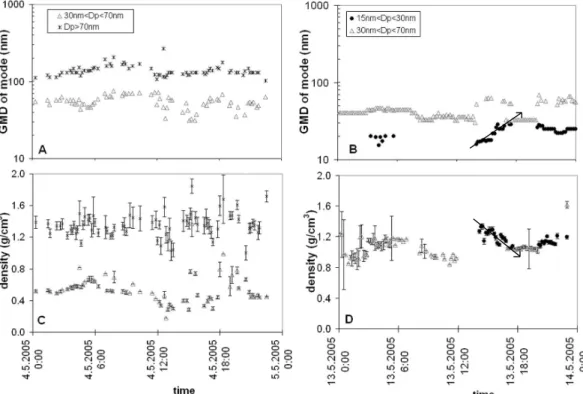
present whereas on 13 May there was intense particle formation and a high nucleation mode concentration in the afternoon. The weather information and some gas compo-nent concentrations of the two days are presented in Table 1. In Fig. 6c–d, the mode densities are plotted as functions of time. The corresponding GMD sizes are shown in Fig. 6a and b. It should be noted here that in Fig. 6a–b only the GMD values of the 5
modes for which the density analysis was successful are shown. The error bars show the standard deviation estimated with the method described in the Sect. 2 of this paper. During the 4 May (Fig. 5a), the particle population was stable and no remarkable changes in GMDs and concentrations of modes occurred. On 4 May also the particle density values were stable: the density values for Aitken mode were very low: (0.5±0.2) 10
g/cm3 (Fig. 6c). The accumulation mode densities were approximately 1.4±0.2 g/cm3 during the whole day (Fig. 6c). The 4 May represents the first days of the campaign during which the particle density were low.
On 13 May (Fig. 6b) the particle formation event took place at 12 a.m. During the particle formation event and the growth process the nucleation mode concentration 15
was very high and the accumulation mode concentration was very low. The new par-ticles achieved a stable mode diameter of approximately 33 nm at around 6 p.m. The density of the nucleation mode peaking at 17 nm was approximately 1.3 g/cm3(Fig. 6b and d). The particle density decreased simultaneously with the particle growth pro-cess indicating condensation of some lighter compounds. The particles grew until they 20
reached 33 nm mode diameter, when the density levelled at 1.0 g/cm3(Fig. 6d). Start-ing at 19:20 the mode diameter decreased from 33 nm to 20 nm (Fig. 6b). At the same time, the particle density increased from 1 g/cm3to 1.2 g/cm3(Fig. 6d).
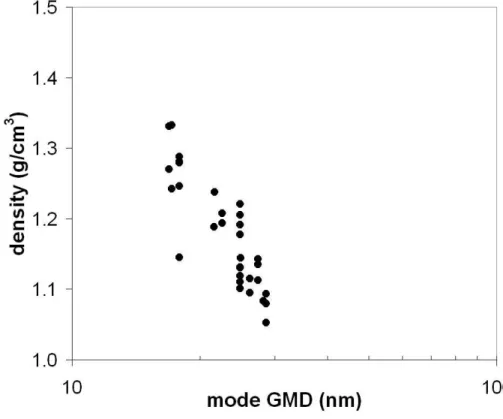
The density decrease associated with the particle growth process during the particle formation event on 13 May is indicated in Fig. 6 by the dashed arrows. The density 25
values of the nucleation mode particles during this process are presented as a function of mode GMD in Fig. 7. By assuming spherical particles the density of condensing species can be estimated by calculating the change in particle mass during the growth process. In calculations we have assumed that the change in mode GSD corresponds
ACPD
8, 7263–7288, 2008 Mode resolved density of atmospheric aerosol particles J. Kannosto et al. Title Page Abstract Introduction Conclusions References Tables Figures ◭ ◮ ◭ ◮ Back CloseFull Screen / Esc
Printer-friendly Version Interactive Discussion
to the increase in the particle size and thus the GSD values and related density values have been used (see Fig. 7). The resulted density estimate for the condensing species was 1.0±0.2 g/cm3. The above analysis for the growth process of nucleation mode particles was made also for the events that took place on 3, 11, 12 May. The density data for 14 and 15 May were too unstable for such analyze. On 3 May the density 5
of species condensing on to the nucleation mode particles was 0.5±0.2 g/cm3. This is in a good agreement with the low density values of Aitken mode particles detected in the first days of the campaign. On 11 and 12 May the corresponding density was 0.7±0.3 g/cm3.
5 Conclusions
10
We have presented the simultaneously measured density values of atmospheric nu-cleation, Aitken and accumulation mode particles. The Aitken and accumulation mode particle densities had lowest values in the beginning of the campaign. The density values of Aitken mode increased during the campaign and reached their maximum value at 14 of May. The highest values of Aitken mode densities (0.9–1.3 g/cm3) were 15
recorded in the period during which the particle formation events took place. We could not find any unambiguous dependence of the density changes on individual weather parameters. Increasing particle density coincident with decreasing relative humidity and increased solar radiation, accompanied with a turn in the wind direction towards north. However, a larger amount of data is needed before the dependence of the par-20
ticle density on the different (meteorological) parameters can be properly analyzed. Density value of nucleation mode particles decreased during the particle forma-tion events. The density values for 15 nm particles were 1.2–1.5 g/cm3 and for grown ∼30 nm particles 0.5–1 g/cm3. The density of the species condensing on the particles during the growth process was estimated from the data. The resulted estimates varied 25
between 0.5 and 1 g/cm3. According to authors’ knowledge there are no prior data on the development of the particle density of nucleation mode during the growth process.
ACPD
8, 7263–7288, 2008 Mode resolved density of atmospheric aerosol particles J. Kannosto et al. Title Page Abstract Introduction Conclusions References Tables Figures ◭ ◮ ◭ ◮ Back CloseFull Screen / Esc
Printer-friendly Version Interactive Discussion
A number of different organic species has been linked with the particle growth process in natural forest environment (e.g., O’Dowd, 2002; Tarvainen et al., 2005; Laaksonen et al., 2007) and the density of those species varies from 0.5 g/cm3 to 1.9 g/cm3. Longer data collection, more detailed analysis and additional measurements of e.g. VOC emis-sions are needed before the found density can be related to any specific species. This 5
is a subject for further studies.
Acknowledgements. The study has been funded by Maj and Tor Nessling foundation. The
authors wish to thank J. Ristim ¨aki, presently at W ¨artsil ¨a Finland Oy, for his kind co-operation.
References
Allan, J. D., Alfarra, M. R., Brower, K. N., Coe, H., Jayne, J. T., Worsnop, D. R., Aalto, P. P., 10
Kulmala, M., Hy ¨otyl ¨ainen, T., Cavalli, F., and Laaksonen, A.: Size and composition measure-ments of background aerosol and new particle growth in a Finnish forest during QUEST 2 using an Aerodyne Aerosol Mass Spectrometer, Atmos. Chem. Phys., 6, 315–327., 2006. Allen, J. O., Durant, J. L., Dookeran, N. M., Taghizadeh, K., Plummer, E. F., Lafleur, A. L.,
Sarofim, A. F., and Smith. K. A.: Measurement of C24H14Polycyclic Aromatic Hydrocarbons 15
Associated with a Size-Segregated Urban Aerosol, Environ. Sci. Technol., 32(13), 1928– 1932, 1998.
Cass, G. R., Hughes, L. A., Bhave, P., Kleeman, M. J., Allen, J. O., and Salmon, L. G.: The Chemical Composition of Ultrafine Particles, Philosophical Transactions of the Royal Society of London, 358, 2581–2592, 2000.
20
Cozic, J., Verheggen, B., Weingartner, E., Crosier, J., Bower, K., Flynn, M., Coe, H., Hen-ning, S., Steinbacher, M., Collaud Coen, M., Petzold, A., and Baltensperger, U.: Chemical composition of free tropospheric aerosol for PM1 and coarse mode at the high alpine site Jungfraujoch, Atmos. Chem. Phys. Discuss., 7, 12 145–12 184, 2007.
Dal Maso, M., Kulmala, M., Riipinen, I., Wagner, R., Hussein, T., Aalto, P. P., and Lehtinen, 25
K. E. J.: Formation and growth of fresh atmospheric aerosols: eight years of aerosol size distribution data from SMEAR II, Hyytiala, Finland, Boreal Environ. Res., 10, 323–336, 2005. Hari, P. and Kulmala, M.: Station for Measuring Ecosystems - Atmosphere Relations (SMEAR
ACPD
8, 7263–7288, 2008 Mode resolved density of atmospheric aerosol particles J. Kannosto et al. Title Page Abstract Introduction Conclusions References Tables Figures ◭ ◮ ◭ ◮ Back CloseFull Screen / Esc
Printer-friendly Version Interactive Discussion
Hussein, T., Puustinen, A., Aalto, P. P., M ¨akel ¨a, J. M., H ¨ameri, K., and Kulmala, M.: Urban aerosol number size distributions, Atoms. Chem. Phys., 4, 391–411, 2004.
Hussein, T., Dal Maso, M., Petaja, T., Koponen, I. K., Paatero, P., Aalto, P. P., H ¨ameri, K., and Kulmala, M.: Evaluation of an automatic algorithm for fitting the particle number size distributions, Boreal Environ. Res., 10, 337–355, 2005.
5
Kannosto, J., Ristim ¨aki, J., Virtanen, A., Keskinen, J., Aalto, P., and Kulmala, M.: Density analysis of boreal forest aerosols, Chemical Engineering Transactions, 10, 95–99, 2006. Koponen, I., Virkkula, A., Hillamo, R., Kerminen, V.-M., and Kulmala, M.: Number size
distribu-tions and concentradistribu-tions of the continental summer aerosols in Queen Maud Land, Antartica. J. Geophys. Res., 108(D18), 45872002, doi:10.1029/2003JD003614, 2003.
10
Kulmala, M., H ¨ameri, K., Aalto, P. P., M ¨akel ¨a, J. M., Pirjola, L., Nilsson, E. D., Buzorius, G., Rannik, U., Dal Maso, M., Seidl, W., Hoffman, T., Janson, R., Hansson, H. C., Viisanen, Y., Laaksonen, A., and O’Dowd, C. D.: Overview of the international project on biogenic aerosol formation in the boreal forest (BIOFOR), Tellus, 53B, 324–343, 2001.
Kulmala, M., Vehkam ¨aki, H., Pet ¨aj ¨a, T., Dal Maso, M., Lauri, A., Kerminen, V.-M., Birmili, W., 15
and McMurry, P. H.: Formation and growth rates of ultrafine atmospheric particles: A review of observations, J. Aerosol Sci. 35, 143–176, 2004a.
Kulmala, M., Laakso, L., Lehtinen, K. E. J., Riipinen, I., Dal Maso, M., Anttila, T., Kerminen, V.-M., H ˜orrak, U., Vana, M., and Tammet, H.: Initial steps of aerosol growth, Atmos. Chem. Phys., 4, 2553–2560, 2004b,
20
http://www.atmos-chem-phys.net/4/2553/2004/.
Kulmala, M., Lehtinen, K. E. J., and Laaksonen, A.: Cluster activation theory as an explanation of the linear dependence between formation rate of 3 nm particles and sulphuric acid con-centration, Atmos. Chem. Phys., 6, 787–793, 2006,
http://www.atmos-chem-phys.net/6/787/2006/.
25
Laaksonen, A., Kulmala, M., O’Dowd, C. D. , Joutsensaari, J., Vaattovaara, P., Mikkonen, S., Lehtinen, K. E. J., Sogacheva, L., Dal Maso, M., Aalto, P., Pet ¨aj ¨a, T., Sogachev, A., JunYoon, Y., Lihavainen, H., Nilsson, D., Facchini, M. C., Cavalli, F., Fuzzi, S., Hoffmann, T., Arnold, F., Hanke, M., Sellegri, K., Umann, B., Junkermann, W., Coe, H., Allan, J. D., Rami Alfarra, M.,: Worsnop, D. R, Riekkola, M.-L., Hy ¨otyl ¨ainen T., and Viisanen Y.: The role of VOC oxidation 30
products in continental new particle formation, Atmos. Chem. Phys. Discuss., 7, 7819–7841, 2007,
ACPD
8, 7263–7288, 2008 Mode resolved density of atmospheric aerosol particles J. Kannosto et al. Title Page Abstract Introduction Conclusions References Tables Figures ◭ ◮ ◭ ◮ Back CloseFull Screen / Esc
Printer-friendly Version Interactive Discussion
Lohman, U. and Feichter, J.: Global indirect aerosol effects: a review, Atmos. Chem. Phys., 5, 715–737, 2005,
http://www.atmos-chem-phys.net/5/715/2005/.
Maenhaut, W., Jaffrezo, J.-L., Hillamo, R. E., M ¨akel ¨a, T., and Kerminen, V.-M.: Size-fractionated aerosol composition during an intensive 1997 summer field campaign in northern Finland, 5
Nucl. Instrum. Methods, B150, 345–349, 1999.
Marjam ¨aki, M., Lemmetty, M., and Keskinen, J.: ELPI response and data reduction – I: Re-sponse functions, Aerosol Sci. Tech., 39, 575–582, 2005.
McMurry, P., Wang, X., Park, K., and Ehara, K.: The relationship between mass and mobility for atmospheric particles: A new technique for measuring particle density, Aerosol Sci. Tech., 10
36, 227–238, 2002.
M ¨akel ¨a, M., Aalto, P., Jokinen, V., Pohja, T., Nissinen, A., Palmroth, S., Markkanen, T., Seitso-nen, K., LihavaiSeitso-nen, H., and Kulmala, M.: Observations of ultrafine aerosol particle formation and growth in boreal forest, Geophys. Res. Let., 24, 1219–1222, 1997.
M ¨akel ¨a, J. M., Hoffmann, T., Holzke, C., V ¨akev ¨a, M., Suni, T., Mattila, T., Aalto, P. P., Tapper, 15
U., Kauppinen, E. I., and O’Dowd, C. D.: Biogenic iodine emissions and identification of end products in coastal ultrafine particles during nucleation bursts, J. Geophys. Res., 107, 8110, doi:10.1029/2001JD000580, 2002.
M ¨akel ¨a, J., Koponen, I., Aalto, P., and Kulmala, M.: One-year data of submicron size modes of tropospheric background aerosol in southern Finland, J. Aerosol Sci., 31, 595–611, 2001b. 20
M ¨akel ¨a, J.M., Yli-Koivisto, S., Hiltunen, V., Seidl, W., Swietlicki, E., Teinil ¨a, K., Sillanp ¨a ¨a, M., Koponen, I.K., Paatero, J., Rosman, K., and H ¨ameri, K.: Chemical composition of aerosol during particle formation events in boreal forest, Tellus, 53B, 380–393, 2001a.
O’Dowd, C. D., Aalto, P., H ¨ameri, K., Kulmala, M., and Hoffmann, T.: Atmospheric particles from organic Vapours, Nature, 416, 497–498, 2002.
25
Pope, C. A. and Dockery, D. W.: Health Effects of Fine Particulate Air Pollution: Lines that Connect, J. Air and Waste Manage. Assoc., 56, 709–742, 2006.
Putaud, J.-P., Van Dingenen, R., Dell’Acqua, A., Raes, F., Matta, E., Decesari, S., Facchini, M. C., and Fuzzi, S.: Size-segregated aerosol mass closure and chemical composition in Monte Cimone (I) during MINATROC, Atmos. Chem. Phys., 4, 889–902, 2004
30
Ristim ¨aki, J., Virtanen, A., Marjam ¨aki, M., Rostedt, A., and Keskinen J.: On-line measurement of size distribution and effective density of submicron aerosol particles, J. Aerosol Sci., 33, 1541–1557, 2002.
ACPD
8, 7263–7288, 2008 Mode resolved density of atmospheric aerosol particles J. Kannosto et al. Title Page Abstract Introduction Conclusions References Tables Figures ◭ ◮ ◭ ◮ Back CloseFull Screen / Esc
Printer-friendly Version Interactive Discussion
Ristim ¨aki, J.: Sampling and measurement methods for diesel exhaust aerosol, Tampere Uni-versity of Technology Publications no. 638, PhD Thesis, 2006.
Saarikoski, S., M ¨akel ¨a, T., Hillamo, R., Aalto, P., Kerminen, V.-M., and Kulmala, M.: Physico-chemical characterization and mass closure of size-segregated atmospheric aerosols in Hyyti ¨al ¨a, Finland, Boreal Environ. Res., 10, 385–400, 2005.
5
Seinfeld, J. H. and Pandis, S. N.: Atmospheric chemistry and physics. From air pollution to climate change, John Wiley & Sons, New York, 1998.
Smith, J. N., Moore, K. F., Eisele, F. L., Voisin, D., Ghimire, A. K., Sakurai, H., and McMurry, P. H.: Chemical composition of atmospheric nanoparticles during nucleation events in Atlanta, J. Geophys. Res., 110, D22S03, doi:10.1029/2005JD005912, 2005
10
Tarvainen V., Hakola H., Hellen H., Back J., Hari P., and Kulmala M.: Temperature and light dependence of the VOC emissions of Scots pine, Atmos. Chem. Phys.,5, 989–998,2005 Vaattovaara, P., Huttunen, P. E., Yoon, Y. J., Joutsensaari, J., Lehtinen, K. E. J., O’Dowd, C. D.,
and Laaksonen, A.: The composition of nucleation and Aitken modes particles during coastal nucleation events: evidence for marine secondary organic contribution, Atmos. Chem. Phys., 15
6, 4601–4616, 2006,
http://www.atmos-chem-phys.net/6/4601/2006/.
Virtanen, A., Ristim ¨aki, J., and Keskinen, J.: New method to define the effective density and fractal dimension of agglomerate particles Aerosol Sci. Tech., 38, 437–446, 2004.
Virtanen, A., R ¨onkk ¨o, T., Kannosto, J., Ristim ¨aki, J., M ¨akel ¨a, J. M., Keskinen, J., Pakkanen, T., 20
Hillamo, R., Pirjola, L., H ¨ameri, K.: Winter and summer time size distributions and densities of traffic related aerosol particles at a busy highway in Helsinki, Atmos. Chem. Phys., 6, 2411–2421, 2006,
http://www.atmos-chem-phys.net/6/2411/2006/.
Wall, S. M., John, W., and Ondo, J. L.: Measurement of aerosol size distributions for nitrate and 25
major ionic species, Atmos. Environ., 22, 1649–1656, 1988.
Yu, H., Kaufman, Y. J., Chin, M., Feingold, G., Remer, L. A., Anderson, T. L., Balkanski, Y., Bellouin, N., Boucher, O., Christopher, S., DeCola, P., Kahn, R., Koch, D., Loeb, N., Reddy, M. S., Schulz, M., Takemura, T., and Zhou M.: A review of measurement-based assessment of the aerosol direct radia-tive effect and forcing, Atmos. Chem. Phys., 6, 613–666, 2006, 30
http://www.atmos-chem-phys.net/6/613/2006/.
Zhang, O., Canagaratna, M. R., Jayne, J. T., Worsnop, D. R., and Jimenez, J.-L.: Time- and size-resolved chemical composition of submicron particles in Pittsburgh:
ACPD
8, 7263–7288, 2008 Mode resolved density of atmospheric aerosol particles J. Kannosto et al. Title Page Abstract Introduction Conclusions References Tables Figures ◭ ◮ ◭ ◮ Back CloseFull Screen / Esc
Printer-friendly Version Interactive Discussion
Implications for aerosol sources and processes, J. Geophys. Res., 110, D07S09, doi:10.1029/2004JD004649, 2005.
ACPD
8, 7263–7288, 2008 Mode resolved density of atmospheric aerosol particles J. Kannosto et al. Title Page Abstract Introduction Conclusions References Tables Figures ◭ ◮ ◭ ◮ Back CloseFull Screen / Esc
Printer-friendly Version Interactive Discussion
Table 1.Weather parameters on 4 and 13 May.
T potential RH H2O wind UV-A UV-A, UV-B UV-B, Net Net Visibility NOx NO O3 CO2 SO2 T direction during during during Radiation Radiation
daytime daytime daytime
units ◦C ◦C % ppth ◦ W/m2 W/m2 W/m2 W/m2 W/m2 W/m2 km ppb ppb ppb ppm ppb 4.5.2005 5.9 –0.006 86.7 7.9 115.0 5.1 9.9 0.21 0.43 36.0 93.9 26.7 1.61 0.013 42.3 387.0 0.10 13.5.2005 10.4 –0.004 38.9 4.6 196.2 14.69 28.9 0.57 1.2 175.4 417.1 49.7 0.73 0.0004 45.3 384.7 0.08
ACPD
8, 7263–7288, 2008 Mode resolved density of atmospheric aerosol particles J. Kannosto et al. Title Page Abstract Introduction Conclusions References Tables Figures ◭ ◮ ◭ ◮ Back CloseFull Screen / Esc
Printer-friendly Version Interactive Discussion
Fig. 1. Laboratory tests of the method using DOS particles. The results gained by carefully
calibrated impactor kernels (black dots) are compared to inaccurate kernels (open circles). Figure adapted from Ristim ¨aki (2006).
ACPD
8, 7263–7288, 2008 Mode resolved density of atmospheric aerosol particles J. Kannosto et al. Title Page Abstract Introduction Conclusions References Tables Figures ◭ ◮ ◭ ◮ Back CloseFull Screen / Esc
Printer-friendly Version Interactive Discussion
Fig. 2. The number size distributions and total number concentrations measured during the
campaign. The concentrations are presented as a contour plot (Fig. 2a) and as a time series (Fig. 2b).
ACPD
8, 7263–7288, 2008 Mode resolved density of atmospheric aerosol particles J. Kannosto et al. Title Page Abstract Introduction Conclusions References Tables Figures ◭ ◮ ◭ ◮ Back CloseFull Screen / Esc
Printer-friendly Version Interactive Discussion
Fig. 3.Particle densities as a function of mobility size (a) and aerodynamic size (b) of the mode
ACPD
8, 7263–7288, 2008 Mode resolved density of atmospheric aerosol particles J. Kannosto et al. Title Page Abstract Introduction Conclusions References Tables Figures ◭ ◮ ◭ ◮ Back CloseFull Screen / Esc
Printer-friendly Version Interactive Discussion
ACPD
8, 7263–7288, 2008 Mode resolved density of atmospheric aerosol particles J. Kannosto et al. Title Page Abstract Introduction Conclusions References Tables Figures ◭ ◮ ◭ ◮ Back CloseFull Screen / Esc
Printer-friendly Version Interactive Discussion
ACPD
8, 7263–7288, 2008 Mode resolved density of atmospheric aerosol particles J. Kannosto et al. Title Page Abstract Introduction Conclusions References Tables Figures ◭ ◮ ◭ ◮ Back CloseFull Screen / Esc
Printer-friendly Version Interactive Discussion
Fig. 6. The densities of separate modes measured on 4 May (a) and 13 May (b), and mode
GMDs measured on 4 May (c) and 13 May (d). The dashed arrows show the trend of decreas-ing nucleation mode particle density durdecreas-ing the growth process.
ACPD
8, 7263–7288, 2008 Mode resolved density of atmospheric aerosol particles J. Kannosto et al. Title Page Abstract Introduction Conclusions References Tables Figures ◭ ◮ ◭ ◮ Back CloseFull Screen / Esc
Printer-friendly Version Interactive Discussion
Fig. 7.The density of nucleation mode particles as a function of mode GMD during the growth