HAL Id: hal-01196402
https://hal.archives-ouvertes.fr/hal-01196402
Submitted on 17 Sep 2015
HAL is a multi-disciplinary open access
archive for the deposit and dissemination of
sci-entific research documents, whether they are
pub-lished or not. The documents may come from
teaching and research institutions in France or
abroad, or from public or private research centers.
L’archive ouverte pluridisciplinaire HAL, est
destinée au dépôt et à la diffusion de documents
scientifiques de niveau recherche, publiés ou non,
émanant des établissements d’enseignement et de
recherche français ou étrangers, des laboratoires
publics ou privés.
Distributed under a Creative Commons Attribution| 4.0 International License
Barometric pumping of a fractured porous medium
Valeri Mourzenko, C. Varloteaux, S. Guillon, Jean-François Thovert, E. Pili,
P. M. Adler
To cite this version:
Valeri Mourzenko, C. Varloteaux, S. Guillon, Jean-François Thovert, E. Pili, et al.. Barometric
pumping of a fractured porous medium. Geophysical Research Letters, American Geophysical Union,
2014, 41 (19), pp.6698-6704. �10.1002/2014GL060865�. �hal-01196402�
RESEARCH LETTER
10.1002/2014GL060865 Key Points:• Barometric pumping is simulated for complex fractured porous media • A detailed qualitative and
quantita-tive description of this mechanism is made
• Barometric pumping is most efficient in a limited range of parameters
Correspondence to:
P. M. Adler, [email protected]
Citation:
Mourzenko, V. V., C. Varloteaux, S. Guillon, J.-F. Thovert, E. Pili, and P. M. Adler (2014), Barometric pumping of a fractured porous medium, Geophys.
Res. Lett., 41, 6698–6704,
doi:10.1002/2014GL060865.
Received 1 JUL 2014 Accepted 25 AUG 2014
Accepted article online 27 AUG 2014 Published online 6 OCT 2014
This is an open access article under the terms of the Creative Commons Attribution-NonCommercial-NoDerivs License, which permits use and distri-bution in any medium, provided the original work is properly cited, the use is non-commercial and no mod-ifications or adaptations are made.
Barometric pumping of a fractured porous medium
V. V. Mourzenko1, C. Varloteaux2, S. Guillon3,4, J.-F. Thovert1, E. Pili3,4, and P. M. Adler2
1Institut Pprime, CNRS, SP2MI, Futuroscope Chasseneuil, France,2UPMC Metis, Paris, France,3CEA, DAM, DIF, Arpajon, France,4Institut de Physique du Globe de Paris, Paris VII-Denis Diderot University, Paris, France
Abstract
Barometric pumping plays a crucial role in the release of trace gases from fractured porous media to the atmosphere, and it requires a rigorous and complete modeling in order to go beyond the approximate schemes available in the literature. Therefore, a coupled set of convection and convection-diffusion equations for a slightly compressible fluid in unsteady conditions should be solved. The numerical methodology is presented, and it is applied to conditions close to the ones of the Roselend Natural Laboratory (France). The precision of the code is assessed and the mechanism of barometric pumping is explained. The usual schematization by simple vertical fractures is shown to be only qualitative. Finally, barometric pumping is shown to be efficient in a narrow range of parameter values; its efficiency is a decreasing function of the matrix porosity and of the fracture density.1. Introduction
Fluctuations in the ambient atmospheric pressure result in motion of air in fractured porous media. This mechanism, known as barometric pumping, can efficiently transport gaseous species through the vadose zone to the atmosphere. This is of interest in many environmental and engineering fields as shown by the abundant literature and the review by Kuang et al. [2013]. Barometric pumping plays an important role in the remediation of contaminated sites, and it controls the exposure to radon in buildings. Pressure-driven airflow is responsible for the possible seepage of gases from a cavity to the atmosphere [Nilson et al., 1991]. This latter feature is expected to play a central role in the detection of underground nuclear explosions [Nilson et al., 1991; Carrigan et al., 1996], and it is involved in seepage of CO2from carbon sequestration sites [Oldenburg and Unger, 2003]. In response to these challenges, a precise modeling of barometric pumping is needed for any kind of fractured porous media in order to make progress with respect to the approximate schemes developed up to now.
The formalism of flow through a porous medium from a cavity under the action of pressure variation is anal-ogous to that of heat conduction in solids, which broadens its applicability to temperature variations. As stressed by Nilson et al. [1991], barometric pumping is enhanced by the presence of fractures, which permit pressure variations to propagate deeper than in porous media, to the order of 100 m. To date, barometric pumping has not been modeled for heterogeneous porous media with realistic shapes and distributions of fractures.
This paper is organized as follows. Section 2 presents the flow and convection-dispersion equations through fractured porous media. Section 3 provides the main results. Preliminary checks are reported first. Then, the phenomenon of barometric pumping is discussed, including a comparison with pure diffusion and configu-rations with vertical fractures. Some parametric studies on the influence of fracture density and porosity are detailed. These numerical simulations are conducted with parameter values relevant for the Roselend Natu-ral Laboratory (Alps, France), where flow parameters of the crystalline rocks were determined [Guillon et al., 2013; Patriarche et al., 2007]. The influence of some other parameters such as the molecular diffusion coef-ficient, the fracture aperture, and the percolating character of the fracture network is summarized. A few concluding remarks and possible extensions are given in section 4.
2. General
This section addresses briefly single phase, slightly compressible flow through fractured porous media [Adler
et al., 2012]. Due to the specific transport properties of fractures, the flow through a naturally fractured
Geophysical Research Letters
10.1002/2014GL060865
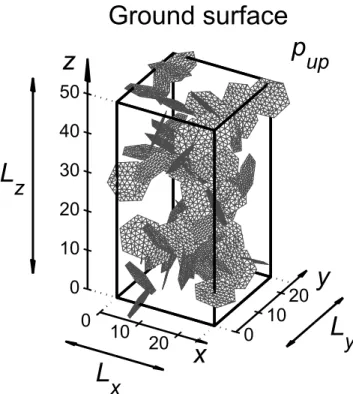
Figure 1. Scheme of the model and of the fracture mesh used for the
simulations. The fracture network has a density𝜌 = 1.86 10−3m−3and a
mesh size𝛿 = R∕4(see text for details).
in most cases the porous matrix pro-vides the main storage for the fluids while transport takes place mainly through the fracture system. The general situation is presented in Figure 1 where notations are given. A fractured porous medium of size
Lx× Ly× Lzis subjected to a sinusoidal pressure variation at its top z = Lz. At its bottom z = 0, a constant con-centration c = 1 is maintained. The microscale Reynolds and Péclet num-bers are assumed to be small with respect to 1 in the porous medium and the fractures; these assumptions are satisfied for the applications given in section 3.
The porous matrix has a bulk perme-ability Km[L2] which may vary with
space. In the matrix, Darcy’s law for the local seepage velocity v and the mass conservation for slightly compressible flow can be written as
v = −Km
𝜇 ∇p , 𝜀mCm𝜕p𝜕t + ∇⋅ v = 0
(1) where t is the time,𝜇 the viscosity of the gas, and p the pressure; 𝜀mis the air matrix porosity, and Cmthe air
compressibility. If𝜀mCmis constant, a matrix pressure diffusivity Dpmcan be defined and (1) can be written
as a diffusion equation for the pressure
𝜕p 𝜕t − ∇⋅ ( Dpm∇p ) = 0 , Dpm= Km 𝜇𝜀mCm (2) When the resistance to normal flow can be neglected, the hydraulic properties of a fracture can be charac-terized by its transmissivity𝜎 [L3] which relates the in-plane flow rate J to the surface pressure gradient ∇
sp
[Adler et al., 2012]
J = − 𝜎
𝜇∇sp (3)
For illustration, the fracture can be viewed as a plane channel of aperture b. Then, the classical Poiseuille law yields the transmissivity𝜎
𝜎 =12b3 (4)
The continuity equation for the flow through such a fracture reads as
b Cf𝜕p
𝜕t + ∇s⋅ J = [v] ⋅ n (5)
where [v] denotes the jump of the seepage velocity in the porous medium across the fracture and Cfis the
compressibility of the gas in the fracture. Again, if bCfis constant in a fracture, a pressure diffusivity Dfcan
be defined, and (5) is written as
𝜕p 𝜕t − ∇s⋅ (Df∇sp) = [v]⋅ n b Cf , Df= 𝜎 b𝜇Cf (6)
The assumptions of uniform𝜀mCmand bCfused to write down the diffusion equations (2) and (6) are by no
means a requirement for the numerical model. At this point, notations can be simplified; Cmand Cfare equal
The tracer transported by the gas is assumed to be chemically passive. Hence, in a medium of porosity𝜀, the mass balance equation for the tracer concentration c∗reads
𝜕 (𝜀c∗) 𝜕t + ∇⋅ (vc∗) − Dm∇⋅ ( Dpm∇c∗ ) = 0 (7)
where Dmis the molecular diffusion coefficient and Dpmthe effective conductivity of the porous medium. In the fractures, c∗is regarded as constant across the fracture aperture; because of continuity, it is equal to
c∗in the matrix on either side (i.e., [c∗] = 0). The mass balance reads
𝜕 (bc∗) 𝜕t + ∇s⋅ (Jc∗) − Dm∇s⋅ ( Σ∇sc∗)+[(vc∗− D pmDm∇c∗ )] ⋅ n = 0 (8) where Σ is the fracture conductivity; for a channel of constant width b, Σ is equal to b [Adler et al.,
2012]. Gaseous tracer flux continuity at the fracture/matrix interfaces is built in equation (8) through the exchange term.
This system of equations should be also supplemented with constitutive equations for at least the effective conductivity Dpm. Archie’s law is supposed to hold
Dpm=𝜀1.4 (9)
Boundary conditions are as follows. The fracture network, the fluid flow, and the concentration are sup-posed to be spatially periodic along the horizontal x and y axes. On the bottom and top layers, the following conditions are imposed
z = 0 ∶ zero fluid flux , c (x, y, 0, t) = 1 (10a)
z = Lz∶ p(x, y, Lz, t)= pa+ Δp sin(𝜔t) , c(x, y, Lz, t)= 0 (10b) where pais the mean surface pressure (Pa), Δp the amplitude of the pressure fluctuations (Pa), and𝜔 its
pulsation (s−1).
The initial conditions are the following. Flow calculations are made independently; after a few periods, the pressure field undergoes periodic variations. The convection-diffusion equation is solved for these periodic flow variations. Initially, c(x, y, z, 0) is equal to zero everywhere for z > 0.
The equations are solved in the following way. The fractures and the porous medium are meshed by trian-gles and tetrahedra of sides smaller than a given size𝛿. The equations are discretized by the finite volume technique and solved by conjugate gradient methods. Numerical dispersion in the convection-diffusion equations is diminished by a flux-limiting scheme. A particular attention is paid to the exchanges between the fractures and the surrounding porous medium.
Finally, the previous equations can be used in a stationary state in order to derive an estimation of the macroscopic permeability K and of the macroscopic diffusion coefficient D∗fpmof the fractured porous medium. The 3-D, time-dependent concentration field can be compared to the one-dimensional analytical solution of pure diffusion in a uniform porous medium [Carslaw and Jaeger, 1959]
c∗ an(z, t) = erfc [ 0.5z(D∗fpmt)−1∕2 ] (11)
3. Results
3.1. Parameters and Preliminary Checks
The barometric pressure parameters chosen in this paper are
𝜔 = 10−5s−1 , Δp = 103Pa (12)
They represent variations in weather patterns at the Roselend site [Guillon et al., 2013]. The molecular diffusion coefficient is taken as
Geophysical Research Letters
10.1002/2014GL060865
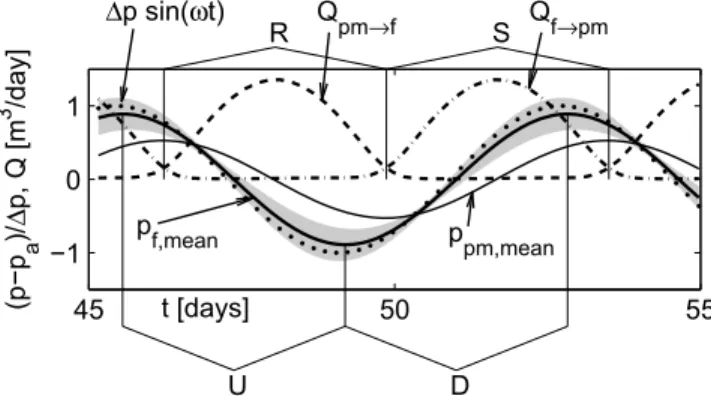
Figure 2. Analysis of barometric pumping. Data are for the conditions
(12)–(14). The imposed pressure variationΔp sin(𝜔t)is indicated by the dotted line;pf,meanis the mean-normalized pressure in the fractures,
ppm,meanthe mean-normalized pressure in the matrix,Qf→pmthe flow rate from fractures to matrix, andQpm→ffrom matrix to fractures. Four periods can be distinguished for the tracer movements: storage (S) into the matrix and restitution (R) to the fractures; up (U) and down (D) in the fracture network. Shaded area indicates standard deviation of the fracture pressure spatial variations.
This value compares with the order of magnitude of diffusion coefficients for most gaseous tracers [Marrero and
Mason, 1972]. As for the transport
parameters, air viscosity, compressibil-ity coefficient, matrix permeabilcompressibil-ity, and porosity are taken as
𝜇 = 2 ⋅ 10−5Pa s, C = 10−5Pa−1,
Km= 10−16m2, 𝜀 = 0.01
(14) following Guillon et al. [2013]. The fracture network properties were deter-mined from the stereological analysis of fractures observed in the Roselend tunnel [Patriarche et al., 2007]. The frac-tures are supposed to be hexagonal, and the radius of the circumscribed disk is R = 5 m. The fracture aper-ture is b = 5⋅ 10−4m; therefore, the
dimensionless fracture transmissivity
𝜎′=𝜎∕(K
mR) [Adler et al., 2012] is equal to 2.013 ⋅ 104. The number of fractures per cubic meter is chosen to
be equal to𝜌 = 1.86 10−3m−3which is just above the percolation threshold. Two other fracture networks of
densities 4.85 10−3and 9.7 10−3m−3are studied as well for sensitivity analysis.
The size of the unit cell is 25 × 25 × 50 m3, as recalled in Figure 1. Its vertical dimension corresponds roughly
to the Roselend site.
As a preliminary check, numerical simulations were conducted in an unfractured porous medium. The results agree very well with the one-dimensional solution c∗
an(z, t) (11) down to a concentration of 10−5. 3.2. Illustration of the Barometric Pumping
The key features of barometric pumping as a transport mechanism are explained in Figure 2. The mean pressure pf,meanin the fractures, obtained by averaging pressure over all the fractures, closely follows the barometric pressure variations indicated by the dotted line. pf,meanhas been smoothed; the shaded area indicates standard deviation of the fracture pressure spatial variations. The pressure averaged over all the matrix ppm,meanhas also been smoothed; as expected, ppm,meanis out of phase and of smaller amplitude than pf,mean.
Two periods can be distinguished, namely, up (U) and down (D), when tracer migrates upward (respectively, downward) in the fracture network, following the sign of the time derivative of pf,mean(Figure 2).
The gas flow rates from the fractures to the porous medium Qf→pmand from the porous medium to the
frac-tures Qpm→fwere calculated and are presented in Figure 2. Two other periods can be distinguished, namely, storage (S) in the porous medium, when Qf→pmis positive, and restitution (R) to the fractures when Qpm→f
is positive. Qf→pmis significant when the mean pressure in the fractures is larger than the mean pressure in the matrix, and it is otherwise equal to zero. However, there is a phase shift between this flow rate and the mean pressure difference since the exchange rate depends on the fast-responding matrix pressure near the fractures, whereas the variations of ppm,meanare delayed. Analogous comments can be done for Qpm→f.
The succession of tracer transport up and down the fractures (U,D) combined with tracer storage and restitu-tion, in and out the matrix (S, R) is characteristic of barometric pumping; this stepwise and irreversible effect, also called ratcheting effect [Nilson et al., 1991], results in enhanced migration toward the surface.
The concentration field of the gaseous tracer, calculated during 98 days, is represented in Figure 3. A very important characteristic is that the gaseous tracer reaches the surface rapidly compared to the purely dif-fusive case. Gaseous tracer concentration at the surface (z = 50 m) is of the order of 10−5after 50 days
Figure 3. Barometric pumping in a fractured porous medium with a density𝜌 = 1.86 10−3m−3and a matrix porosity 𝜖 = 0.01. The concentration field after (a) 10, (b) 50, and (c) 98 days. The (d) concentration and (e) pressure averaged over horizontal sections are shown at 50 days in the matrix and the fractures (solid lines marked m and f, respectively); concentration and pressure profiles obtained with a finer mesh𝛿 = R∕8correspond to the dashed lines. The concentra-tion profiles in Figure 3d are averaged over one period, with grey areas indicating the ranges of variaconcentra-tions of the gaseous tracer concentrations. The dotted line in Figure 3d shows the analytical 1-D diffusion solutionc∗an(z, t). Symbols show the concentration profiles for a single vertical fracture with an equivalent overall permeability (b = 2.9 ⋅ 10−4m,▾) or an
equivalent macroscopic diffusion coefficient (b = 1.26 ⋅ 10−3m,
∙
).Close to the source (z≤ 5 m) where concentration is high, transport is controlled by diffusion and the con-centration depends mostly on z as shown by Figure 3d. Further from the source, barometric pumping is the controlling transport mechanism, and the concentration shows a limited dependence on z.
The concentration averaged over a section appears to always be higher in the fractures than in the porous matrix (Figure 3d). This is due to the ratcheting effect.
Since the pressure fluctuations driving migration are acting at the surface while the tracer source is at depth, only the fractures that do percolate are used as a preferential path for tracer migration. Therefore, baro-metric pumping is a very efficient transport mechanism, even in very complex fracture networks, the tracer being shortly connected with the surface.
3.3. Parametric Studies
Some preliminary checks were performed first. For𝜌 = 1.86 10−3m−3, two simulations were conducted, with
mesh sizes𝛿 = 0.25 R and 0.125 R; after 50 days, the average pressures and the average concentrations are very close whatever𝛿 (Figures 3d and 3e). Configurations with a single fracture or repeated parallel vertical fractures [e.g., Nilson et al., 1991], which were extensively used for semianalytical models, were calculated with the same values of the parameters as for the fracture network, except b which is chosen in such a way
Geophysical Research Letters
10.1002/2014GL060865
Figure 4. Influence of the fracture density and matrix porosity. Data are for a fractured porous medium with (a–c) 𝜌 = 1.86 10−3and (d–f )4.85 10−3m−3, and for𝜖 = 0.01(Figures 4a and 4d) and 0.05 (Figures 4b and 4e) after 98 days.
In Figures 4c and 4f the averaged concentration profiles in the matrix (dashed lines) and in the fractures (solid lines) are shown for𝜖 = 0.01and 0.05, as indicated by numbers. The concentration profiles are averaged over one period, grey areas indicate the ranges of variations of the gaseous tracer concentrations during one period. The dash-dotted and dotted lines in Figures 4c and 4f show the 1-D analytical solutionc∗
an(z, t)(11) withD ∗
fpmcalculated for𝜖 = 0.01and
0.05, respectively.
that the media with a single fracture and the network have either the same macroscopic permeability or the same macroscopic diffusion coefficient. Concentration for a single fracture is seen to be much smaller than the values obtained for the fracture network (Figure 3d). Therefore, using fracture networks with realistic shapes is required in order not to underestimate the efficiency of barometric pumping.
A nonpercolating network could be generated for the same density𝜌 = 1.86 10−3m−3. The difference
with the concentration fields shown in Figure 3 is spectacular, since the concentration profile is practically one-dimensional and completely controlled by diffusion.
Evolutions with time for the three fracture densities𝜌 = 1.86 10−3, 4.85 10−3, and 9.7 10−3m−3were
ana-lyzed, and only the first two are shown in Figure 4. For𝜌 = 1.86 10−3m−3, the tracer quickly finds and
follows the preferential connected fracture path, and it reaches the top of the medium within 98 days (Figure 4a). Simultaneously, the concentration increases in a quasi one-dimensional way at the bottom of the medium and around the preferential connected fracture path. When𝜌 increases, the preferential path tends to disappear (Figure 4d). The tracer migrates by diffusion until transport in the fracture network is ini-tiated. For𝜌 = 9.7 10−3m−3, this trend is more pronounced and the concentration field follows the 1-D
diffusion solution.
Two values of matrix porosities, namely,𝜖=0.01 and 0.05, were also studied for the networks with
effective conductivity is multiplied by a factor of 10 when porosity increases from 0.01 to 0.05. When poros-ity is increased while Kmand𝜎 remain the same, the fluid fluxes are not changed. However, it results in a larger storage effect in the matrix, reducing the efficiency of barometric pumping. An increase in poros-ity has a similar effect as an increase in fracture densporos-ity since both diminish the transport efficiency by barometric pumping.
Other calculations were performed which cannot be detailed in this letter. The influence of the molecular diffusion coefficient, of the fracture aperture, and of the matrix permeability were studied. The conclusion is always the same; when transport in the porous matrix is too large, barometric pumping is suppressed and the overall behavior is diffusive as shown in Figure 4e. Another test was performed with a network of density𝜌 = 1.86 10−3m−3which did not percolate along any of the three dimensions; flow and transport
are considerably diminished and the overall behavior is again diffusive.
Therefore, the efficiency of barometric pumping appears to be controlled by the ratio of the gaseous tracer transfers through the network and from the fractures into the matrix. When is too small, the behavior of the fractured porous medium is diffusive.
4. Conclusion
Barometric pumping can be simulated for complex discrete fracture networks embedded in a porous matrix. A detailed qualitative and quantitative description of this mechanism is made. This can be applied to situa-tions where release of gas to the atmosphere could be a threat such as in the safety assessment of carbon sequestration; moreover, quantitative predictions of gas emission following an underground nuclear test are highly desirable. Transport by barometric pumping is most efficient for a limited range of parameter val-ues. The fracture network must be connected; an increase in the matrix porosity or in the fracture density results in a decrease in the barometric pumping efficiency. The qualitative discussion of the possible crucial influence of the ratio should be made more quantitative.
This initial study can be extended in many ways. The properties of the porous matrix and of the fractures can be varied at will since every mesh element may be given different properties. Morever, the boundary con-ditions which are spatially periodic in the horizontal plane can be changed. Calculations can also be made with measured pressure fluctuations at the ground surface. Finally, as the formalism of pressure-driven flow is similar to that of heat conduction in solids, these developments can also be extended to temperature variations.
References
Adler, P. M., J.-F. Thovert, and V. V. Mourzenko (2012), Fractured Porous Media, Oxford Univ. Press, Oxford, U. K.
Carrigan, C. R., R. A. Heinle, G. B. Hudson, J. J. Nitao, and J. J. Zucca (1996), Trace gas emissions on geological faults as indicators of underground nuclear testing, Nature, 382, 528–531.
Carslaw, H. S., and J. C. Jaeger (1959), Conduction of Heat in Solids, Oxford Univ. Press, Oxford, U. K.
Guillon, S., M. T. Vu, E. Pili, and P. M. Adler (2013), Field and numerical determinations of pneumatic flow parameters of unsaturated fractured porous rocks on various scales, Water Resour. Res., 49, 2801–2811, doi:10.1002/wrcr.20263.
Kuang, X., J. J. Jiao, and H. Li (2013), Review on airflow in unsaturated zones induced by natural forcings, Water Resour. Res., 49, 6137–6165, doi:10.1002/wrcr.20416.
Marrero, T. R., and E. A. Mason (1972), Gaseous diffusion coefficients, J. Phys. Chem. Ref. Data, 1, 3–118.
Nilson, R. H., E. W. Peterson, K. H. Lie, N. R. Burkhard, and J. R. Hearst (1991), Atmospheric pumping: A mechanism causing vertical transport of contaminated gases through fractured permeable media, J. Geophys. Res., 96, 21,933–21,948.
Oldenburg, C. M., and A. J. A. Unger (2003), On leakage and seepage from geologic carbon sequestration sites: Unsaturated zone attenuation, Vadose Zone J., 2, 287–296.
Patriarche, D., E. Pili, P. M. Adler, and J.-F. Thovert (2007), Stereological analysis of fractures in the Roselend tunnel and permeability determination, Water Resour. Res., 43, W09421, doi:10.1029/2006WR005471.
Acknowledgments
More information can be obtained on the data and results by contacting the authors. This is IPGP contribution number 3483.
The Editor thanks two anonymous reviewers for their assistance in evaluating this paper.